PFAS—have you heard of them? Do you know what they are, or is it more of a term thrown around without much context?
PFAS are per- and polyfluoroalkyl substances. PFAS is a class of chemicals found in various industrial and consumer goods. For instance, you may find them in food packaging, textiles, cosmetics, and frequently in aqueous film-forming foams (AFFFs) used to extinguish fires. PFAS chemicals are known for repelling grease, water, and stains, making them widely used in various applications. These chemicals are stable and persistent, earning them the nickname “forever chemicals” because they do not readily biodegrade, or break down easily in the environment.
Numerous researchers suggested PFAS are abundant in aquatic systems and toxic to a range of aquatic organisms, with additional concerns of bioaccumulation of PFAS. PFAS accumulate in sediments and aquatic organisms, which pose health risks to wildlife and humans through the food chain. Research suggests linkages of PFAS to disruption of endocrine function, reproduction, and development in aquatic organisms. Research suggests similar linkages of PFAS to humans, like increased cancer risk, immune system suppression, endocrine and reproductive disruption, and child developmental concerns.
The United States Geological Survey (USGS) estimated at least 45% of the United States’ tap water has one or more PFAS chemicals (Smalling et al. 2023). At least one PFAS was identified in 60% of public wells and 20% of domestic wells supplying drinking water in the eastern United States (McMahon et al. 2022).
Have PFAS been found in Okaloosa County drinking water and surface waters?
Measured PFAS in Florida and Okaloosa County Drinking Waters
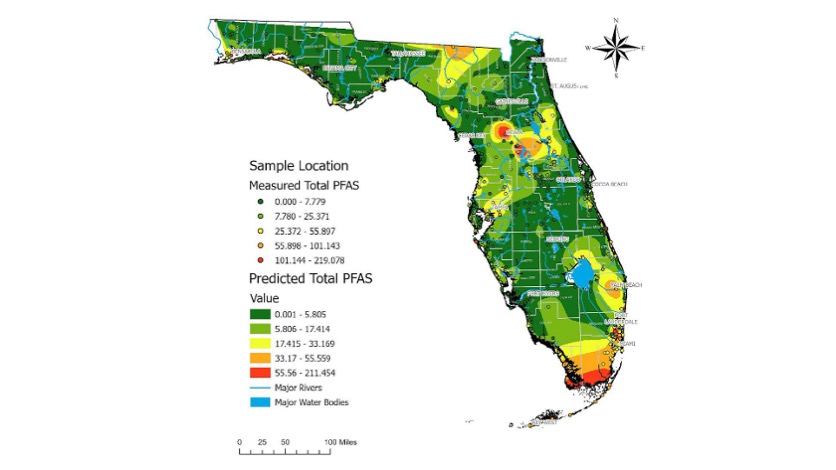
Figure 1. Map with measured total PFAS samples across a gradient of low concentrations (green dots) to medium concentrations (yellow dots) to higher concentrations (red dots). Shaded map colors are the predicted total PFAS using estimated values of PFAS concentrations from low (green) to high (red). Data, figure, and result interpolation from Sinkway et al. 2024.
A team of researchers completed a comprehensive statewide assessment of PFAS in Florida drinking water (Sinkway et al. 2024). The team collected 448 drinking water samples across all 67 Florida counties. The drinking water samples were analyzed for 31 PFAS, where 19 PFAS were found in at least one drinking water sample. The top five most frequently detected PFAS were 6:2 fluorotelomer sulfonate (6:2 FTS) (in 84% of the samples analyzed), Perfluorooctanoic acid (PFOA) (65%), linear perfluorooctane sulfonate (PFOS) (65%), branched PFOS (64%), and perfluorobutane sulfonic acid (PFBS).
A total of 107 taps had PFOA or PFOS concentrations above 4 ng/L (ppt), where the maximum total PFAS concentration in a tap was 219 ng/L (Click on link for higher resolution–Figure 1). The maximum contaminant level for PFOA and PFOS is 4 ng/L, legally enforced by the United States Environmental Protection Agency National Primary Drinking Water Regulation as of May 14, 2025 (USEPA, 2025). Overall, 8% of the drinking water samples analyzed exceeded 4 ng/L for PFOA and 16% for PFOS. The average total PFAS in city water was 15.6 ng/L, and in well water was 4.5 ng/L.
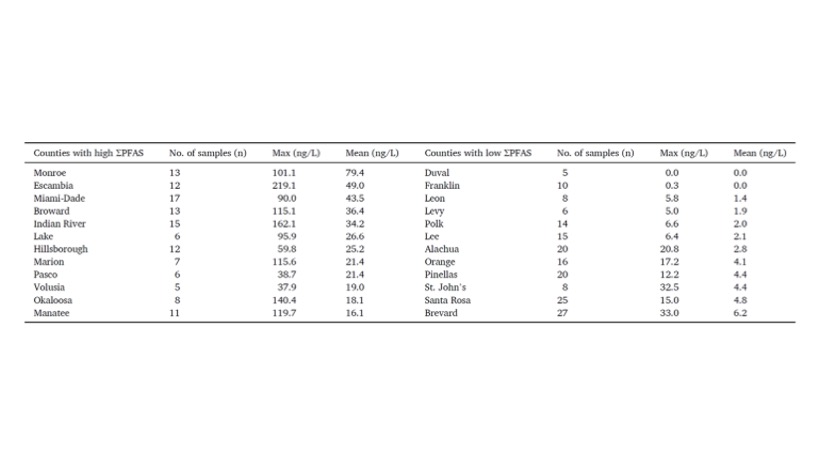
Table 1. Top average 12 Florida counties with highest and lowest total PFAS concentrations (ng/L). Data, figure, and result interpolation from Sinkway et al. 2024.
Okaloosa County had the 11th highest total PFAS (ng/L) concentration among the 67 Florida counties (Click on link for higher resolution–Table 1). Among the eight drinking water samples collected, the maximum PFAS concentration measured was 140 ng/L, and the lowest was 18 mg/L. Okaloosa County had one drinking water sample that exceeded the 4 ng/L standard for PFOA. There were no drinking water samples that exceeded 4 ng/L for PFOS.
Measured PFAS in Florida and Okaloosa County Surface Waters
A team of researchers completed a comprehensive statewide assessment of PFAS in Florida surface waters (Camacho et al. 2024). A network of citizen scientists collected 2,323 surface water samples across the 67 Florida counties. These surface water samples were analyzed for 50 PFAS, with 33 PFAS being detected in at least one surface water sample. The top five most frequently detected PFAS were perfluorooctanoic acid (PFOA) (94% of the samples), perfluorobutane sulfonic acid (PFBS) (65%), perfluorohexanoic acid (PFHxA) (61%), perfluorononanoic acid (PFNA) (54%), and perfluorooctane sulfonate (PFOS) (53%).
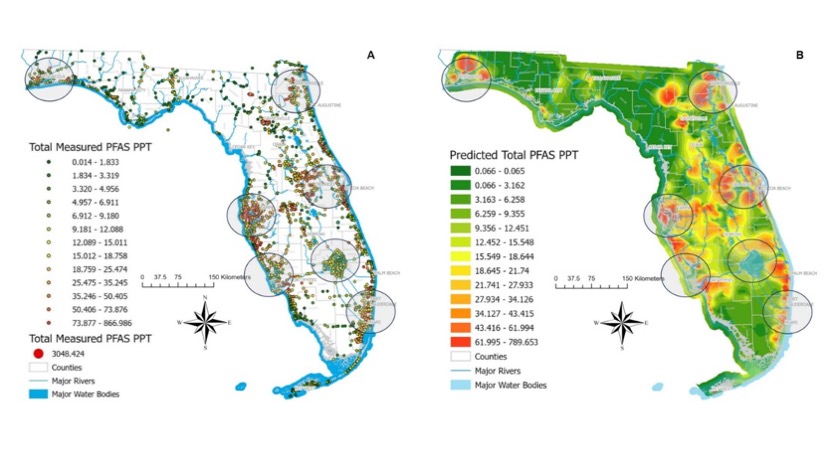
Figure 2. Map A contains all surface water sampled sites with detected PFAS, where the dots’ color represents the total PFAS concentration measured. Map B shows predicted PFAS levels based on measured total PFAS concentrations in surface water samples. Note that these values do not represent predicted PFAS concentrations on land. Data, figure, and result interpolation from Camacho et al. 2024.
There were 915 (39%) surface water samples with PFOA concentrations above 4 ng/L and 920 (40%) samples with PFOS above 4 ng/L (Click on link for higher resolution–Figure 2). All counties had at least one sample with PFOA, 96% had PFNA, 93% had PFBS, 91% had PFOS, and 82% of counties had PFHxA. The average PFAS detected among counties ranged from 2 ng/L of PFNA to 10 ng/L of PFOS. The maximum PFAS detected among counties ranged from 81 ng/L of PFOA to 1135 ng/L of PFOS. Figure 2
Okaloosa County ranked 27th among Florida counties due to 10 (20%) surface water samples with PFOA above 4 ng/L. Okaloosa County ranked 9th for the number of samples (38 total samples or 78% of the samples) above 4 ng/L for PFOS. A total of 49 surface water samples were collected in Okaloosa County. The average total PFAS concentration detected in a surface water sample was 31 ng/L, while the maximum total PFAS concentration detected in a sample was 185 ng/L.
Dr. Bowden, with the University of Florida’s College of Veterinary Medicine and Chemistry Department, led the PFAS research shared here. Dr. Bowden has extensive information on the Bowden Lab website (https://www.bowdenlaboratory.com/dr-bowden.html), including an interactive map of all the PFAS surface water samples collected in Florida. Select Okaloosa County under the filter section to see the surface water samples and learn more about the PFAS information for each sample collected in Okaloosa County (https://www.bowdenlaboratory.com/florida-surface-water.html).Figure 2Table 1
What does this mean for Okaloosa County?
PFAS have been detected in drinking water and surface waters in Okaloosa County. Although not the highest concentrations or most frequent identified in Florida, there were drinking and surface water samples above USEPA’s 4 ng/L contaminant level standard. Understanding what PFAS are and joining in educational conversations about PFAS helps our community. Efforts that support continued sampling and extended monitoring also increase our understanding of PFAS concentrations in Okaloosa County’s drinking and surface waters. If you want to learn more about PFAS or join community scientists’ efforts to expand PFAS water monitoring, please contact Dana Stephens at the UF/IFAS Okaloosa County Extension Office.
References
Camacho, C.G., et al. 2024. Statewide surveillance and mapping of PFAS in Florida surface waters. American Chemical Society, 4: 434-4355. https://doi.org/10.1021/acsestwater
McMahon, P.B., Tokranov, A.K., and Bexfield, L.M. 2022. Perfluoroalkyl and polyfluoroalkyl substances in groundwater used as a source of drinking water in the Eastern United States. Environmental Science and Technology 56(4): 2279-2288. https://doi.org/10.1021/acs.est.1c04795
Skinkway, T.D., et al. 2024. Crowdsourcing citizens for statewide mapping of per- and polyfluoroalkyl substances (PFAS) in Florida drinking water. Science of the Total Environment, 926: 1-9. https://doi.org/10.1016/j.scitotenv.2024.171932
I love summer; going to the beach, snorkeling, kayaking and grilling in the backyard. But summer comes with its own share of challenges. One of my least favorite summer guests is bugs. The list of bugs I dislike is long, but I’d like to focus on a few that like to torment us all.
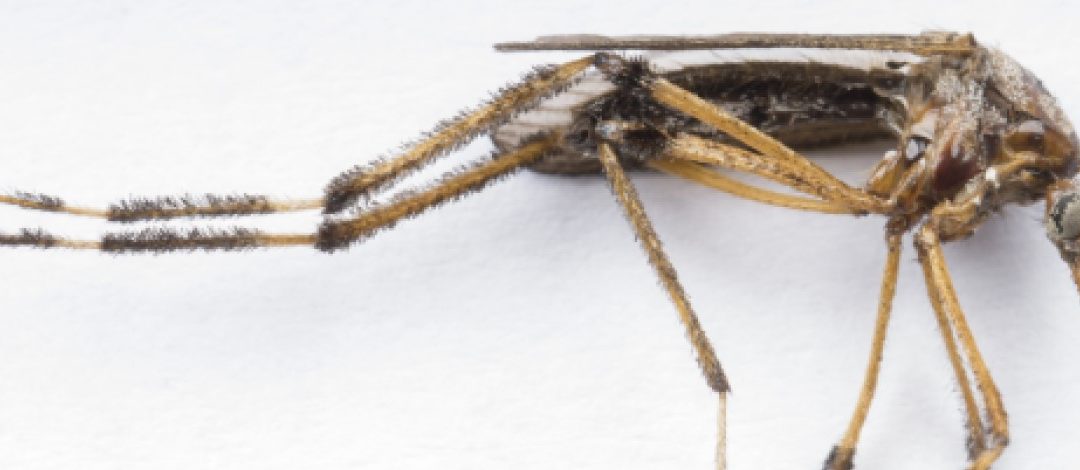
Mosquitos are one of summer’s bad actors. Mosquito lay their eggs and their larvae mature in both manmade and natural water-holding containers such as bird baths, plants, bucket, used tire and holes in trees. Some mosquitos just bite while others carry disease. The easiest way to get rid of mosquitos is to get rid of any water-holding containers in the area.
Ants, in particular fire ants, are another unwelcome summer arrival. This invasive species is aggressive, and their painful stings can injure both humans and animals. Fire ant nests look like large mounds of dirt and typically have multiple openings. You must kill the queen to completely eliminate a colony. Even if the queen is killed, surviving ants may inhabit the mound or make a new mound until they die off. Some treatments that may work to get rid of these pests include baits, pesticides and boiling water.
Many biting flies, yellow flies are my least favorite, persistently attack man and animals to obtain a blood meal. Like mosquitoes, it is the female fly that is responsible for inflicting a bite. These biting flies like shady areas under bushes and trees and wait for their victim to pass by. They typically attack during daylight hours, a few hours after sunrise and two hours before sunset. Currently there are no adequate means for managing populations. Traps are sometimes effective in small areas such as yards, camping sites, and swimming pools.
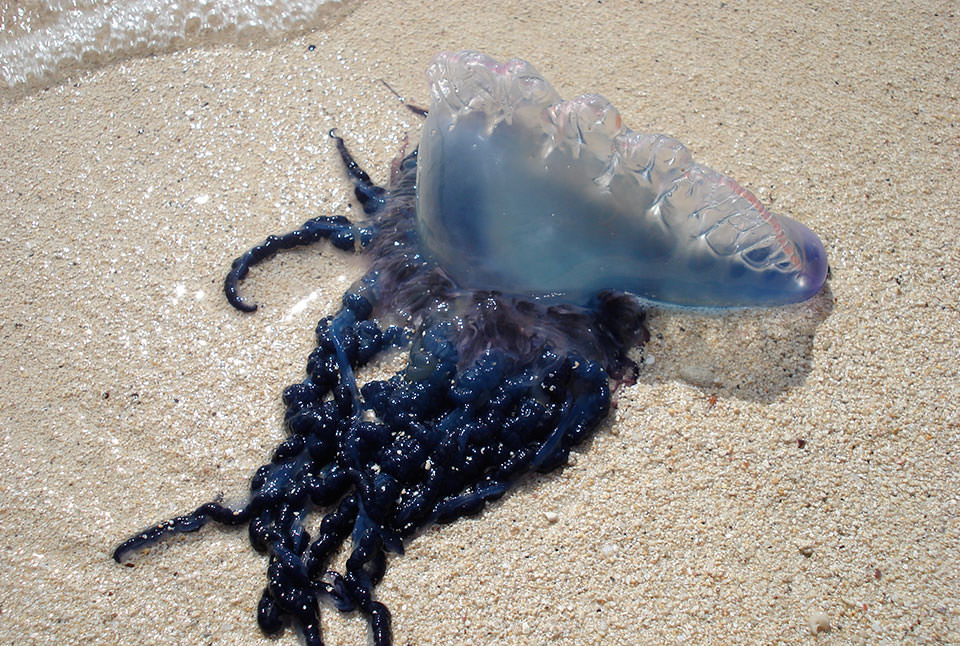
In the water, jellyfish are the most common summer pest. While not bugs, their reputation for stinging people puts them in a similar category with the above-mentioned pests. Sea lice, actually the larval form of the thimble jellyfish, is a common near shore pest, while Portuguese Man-O-War and the box jellyfish can give a very painful sting. Another type, comb jellies, are not true jellyfish and do not sting. I you get stung, rinse the sting site with large amounts of household vinegar, or jelly-fish-free ocean water, for at least 30 seconds. Do not rub sand or apply any pressure to the area or scrape the sting site.
The University of Florida – IFAS has several good publications with information about these pests and more detail on how to manage them. Check out these publications if you, like me, have had your fill of summer pests.
Spring is a time of change. Spring brings changes in our waters as well. Some of these changes are visible on top of the water and cause concern among water users and viewers. Let’s dispel some of these concerns associated with the spring season.
Sometimes, water users and viewers notice what appears to be oil floating on top of the water. Could this be oil? Potentially. Could this not be oil? Most likely. Plants perish, and decomposition occurs, typically during the spring and fall seasons of the year. Much of the decomposition that happens in spring is associated with the initial growth and development of plants. Bacteria living in the soils within and around the water break down the perished plants. These bacteria are decomposing the old plant material. The waste product produced from the bacteria’s decomposition of the old plant material is an oily substance. The oily sheen on the water is a waste product of bacteria. Frequently, the oil accumulates in portions of water where there is little to no water movement. As the decomposition process completes, the oily sheen should lessen over the next few days to weeks. This bacteria-produced oil from decomposition is a natural process.
Petroleum-based oil seen on water is not a natural process. Petroleum-based oil could enter water from various sources, such as but not limited to transportation spills, stormwater runoff, and improper disposal of products containing oil. Like the oily substances produced by bacteria during decomposition, petroleum-based oils will float on top of the water and accumulate where there is little to no water movement.
Here are some tips to identify the difference between oils in water:
Bacteria-produced Oil
Petroleum-based Oil
Appearance
Oily sheen on top of water with little to no difference in color throughout
Oily sheen on top of water with differences in color throughout (may even appear like a rainbow)
Touch
(use a stick)
When disturbed, the sheen breaks away easily with irregular patterns and does not reform. The oil will not adhere to the stick.
When disturbed, the sheen swirls, elongates, and does reform. The oil may adhere to the stick.
Odor
(not always present)
Strong organic, musty, or earthy smell.
Volatile organic compounds (VOCs) smelling like gasoline or diesel fuel.
Another sheen on our waters that is frequent during Florida’s springtime is pollen. Pine, tree, and weed pollen accumulate on top of water, especially in areas with little or no water movement. If the sheen on the water is yellow, orange, or sometimes white, this is most likely due to pollen. Think about how pollen shows on a car in Florida during spring…our waters can show the same to some extent.
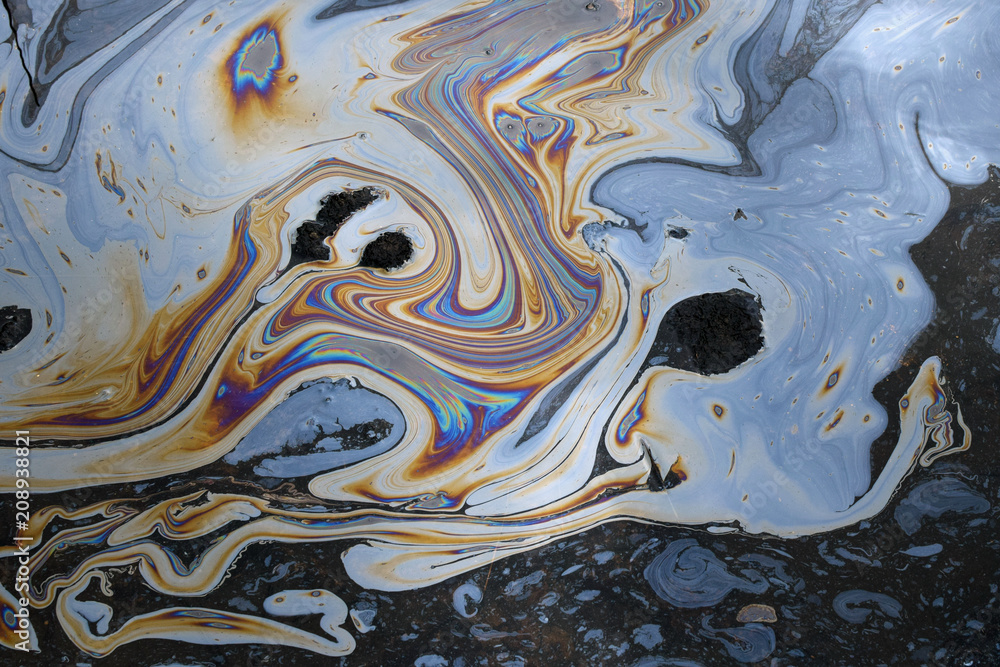
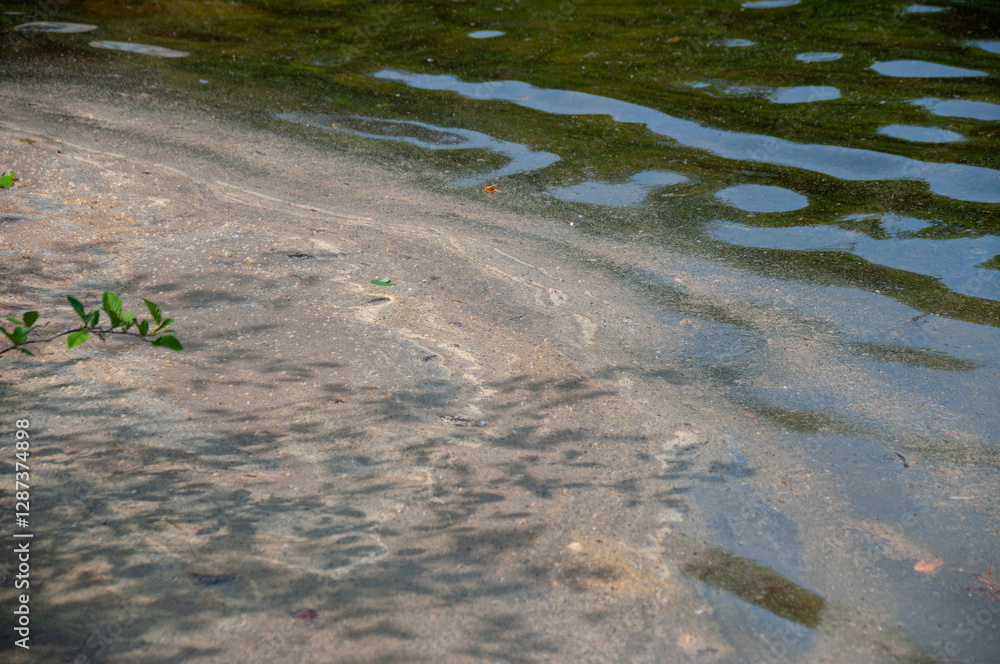
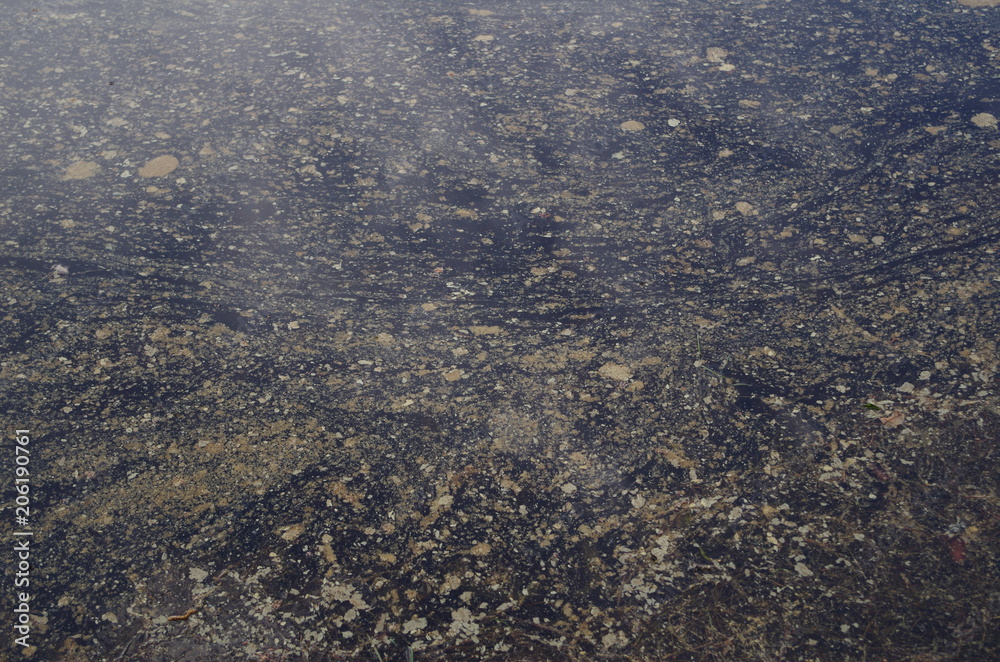
Let’s give it a try! See if you can identify the sheens in water in each photo—answers at the bottom of the page.
Photo 1
Photo 2
Photo 3
Photo 4
Photo 5
Photo 6
Keep Scrolling For Answers!
.
.
.
.
.
.
PHOTO ANSWERS: Photo 1: Bacteria-produced oil sheen. Photo 2: Pollen sheen. Photo 3: Petroleum-based oil sheen. Photo 4: Pollen sheen. Photo 5: Petroleum-based oil sheen. Photo 6: Mixture of bacteria-produced oil and pollen sheen. Note all photos were obtained from Adobe Stock Photos.
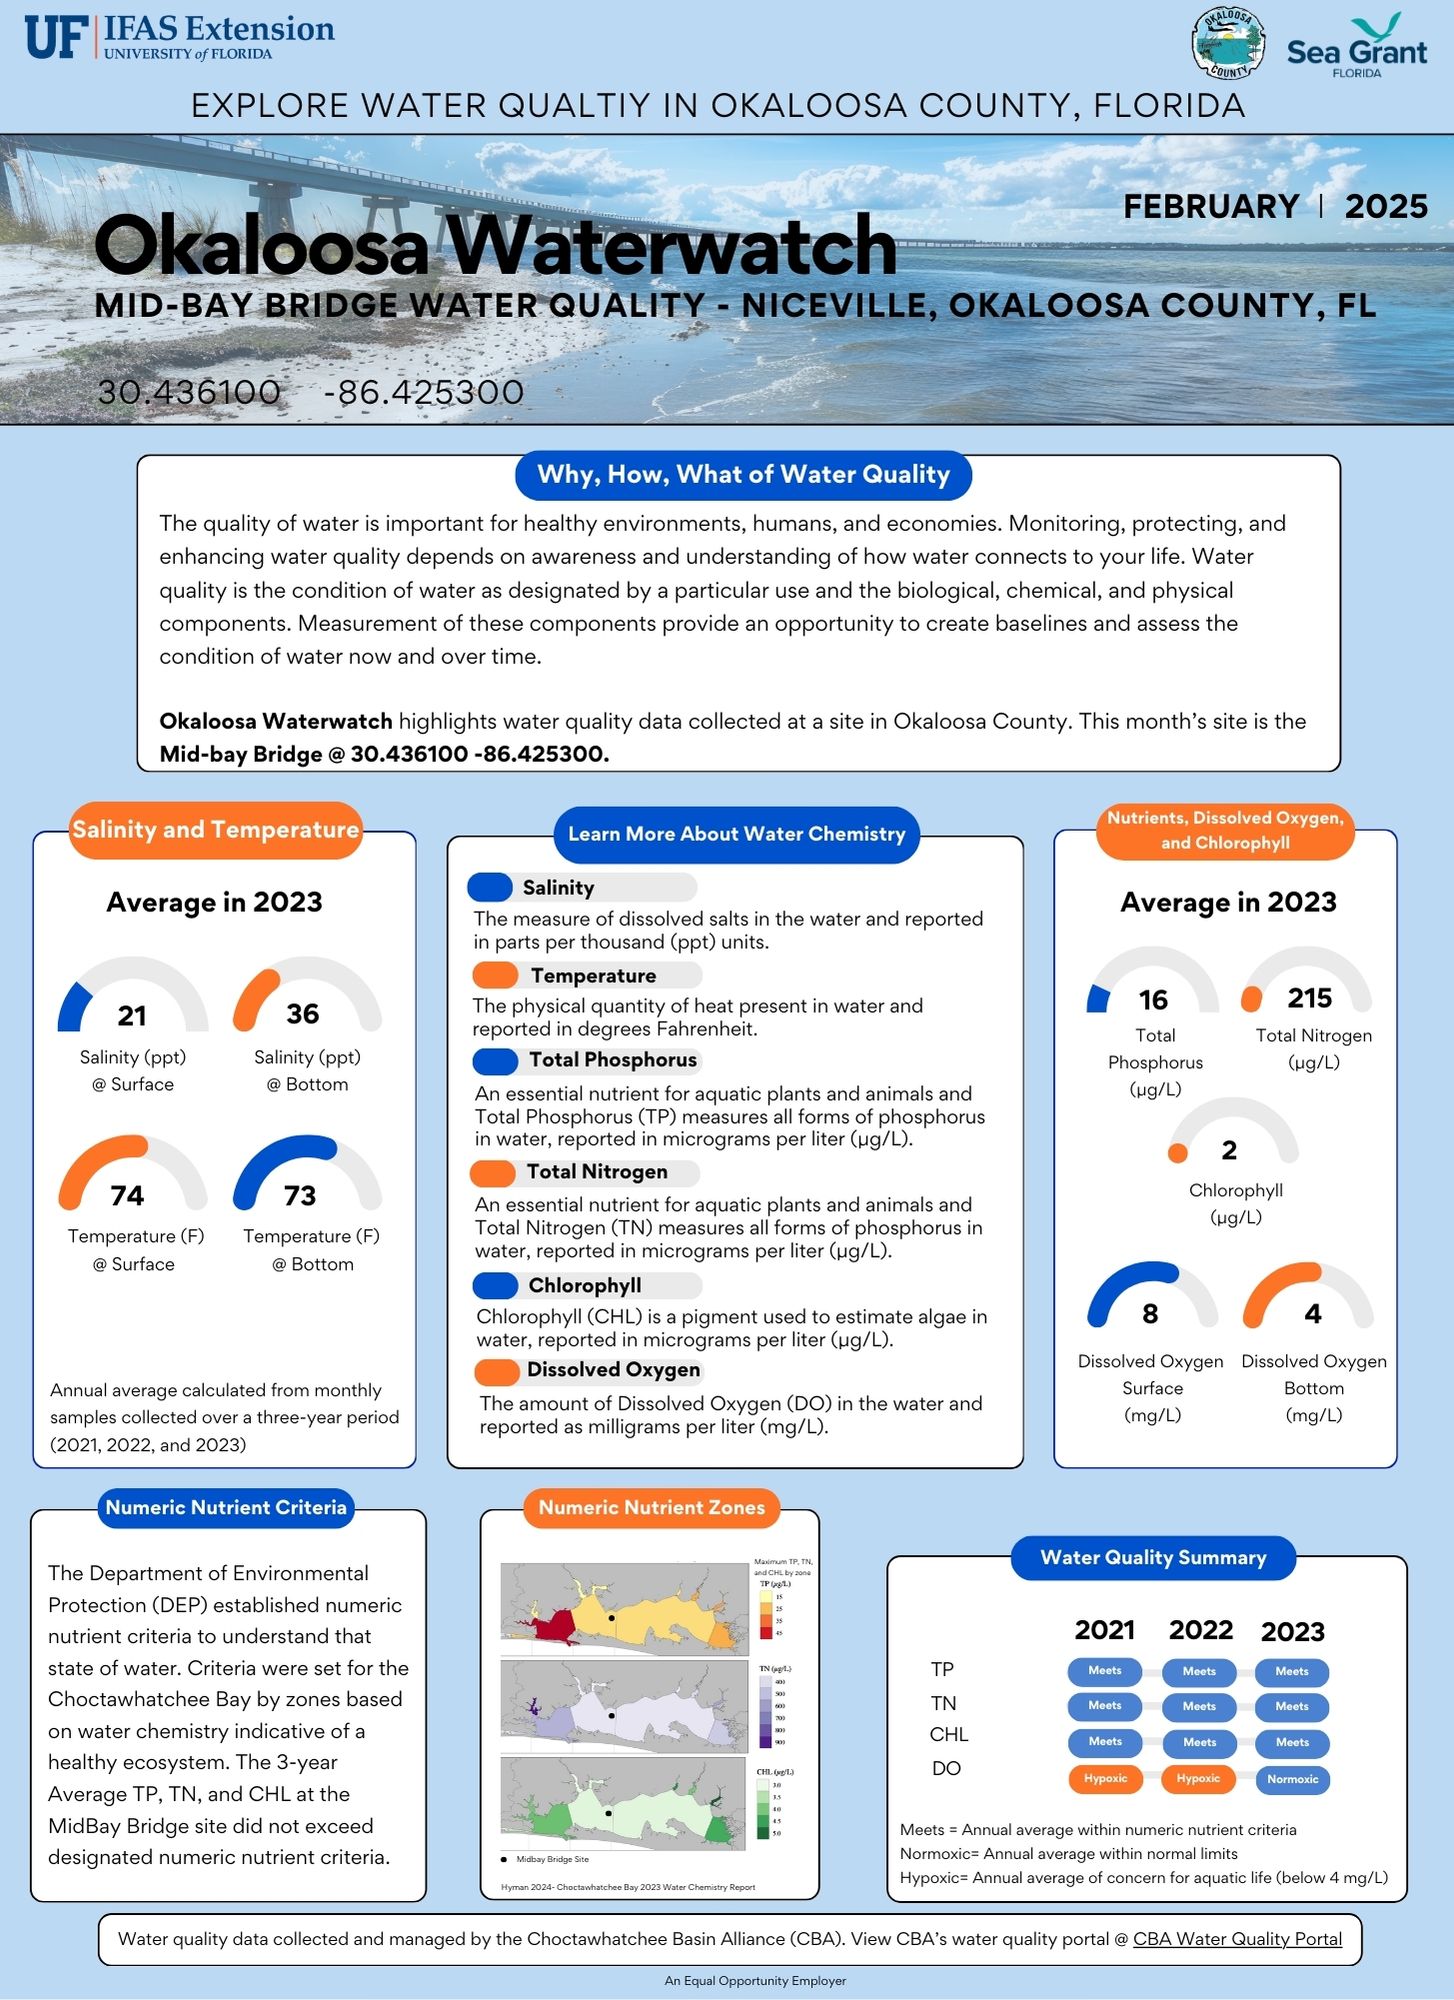
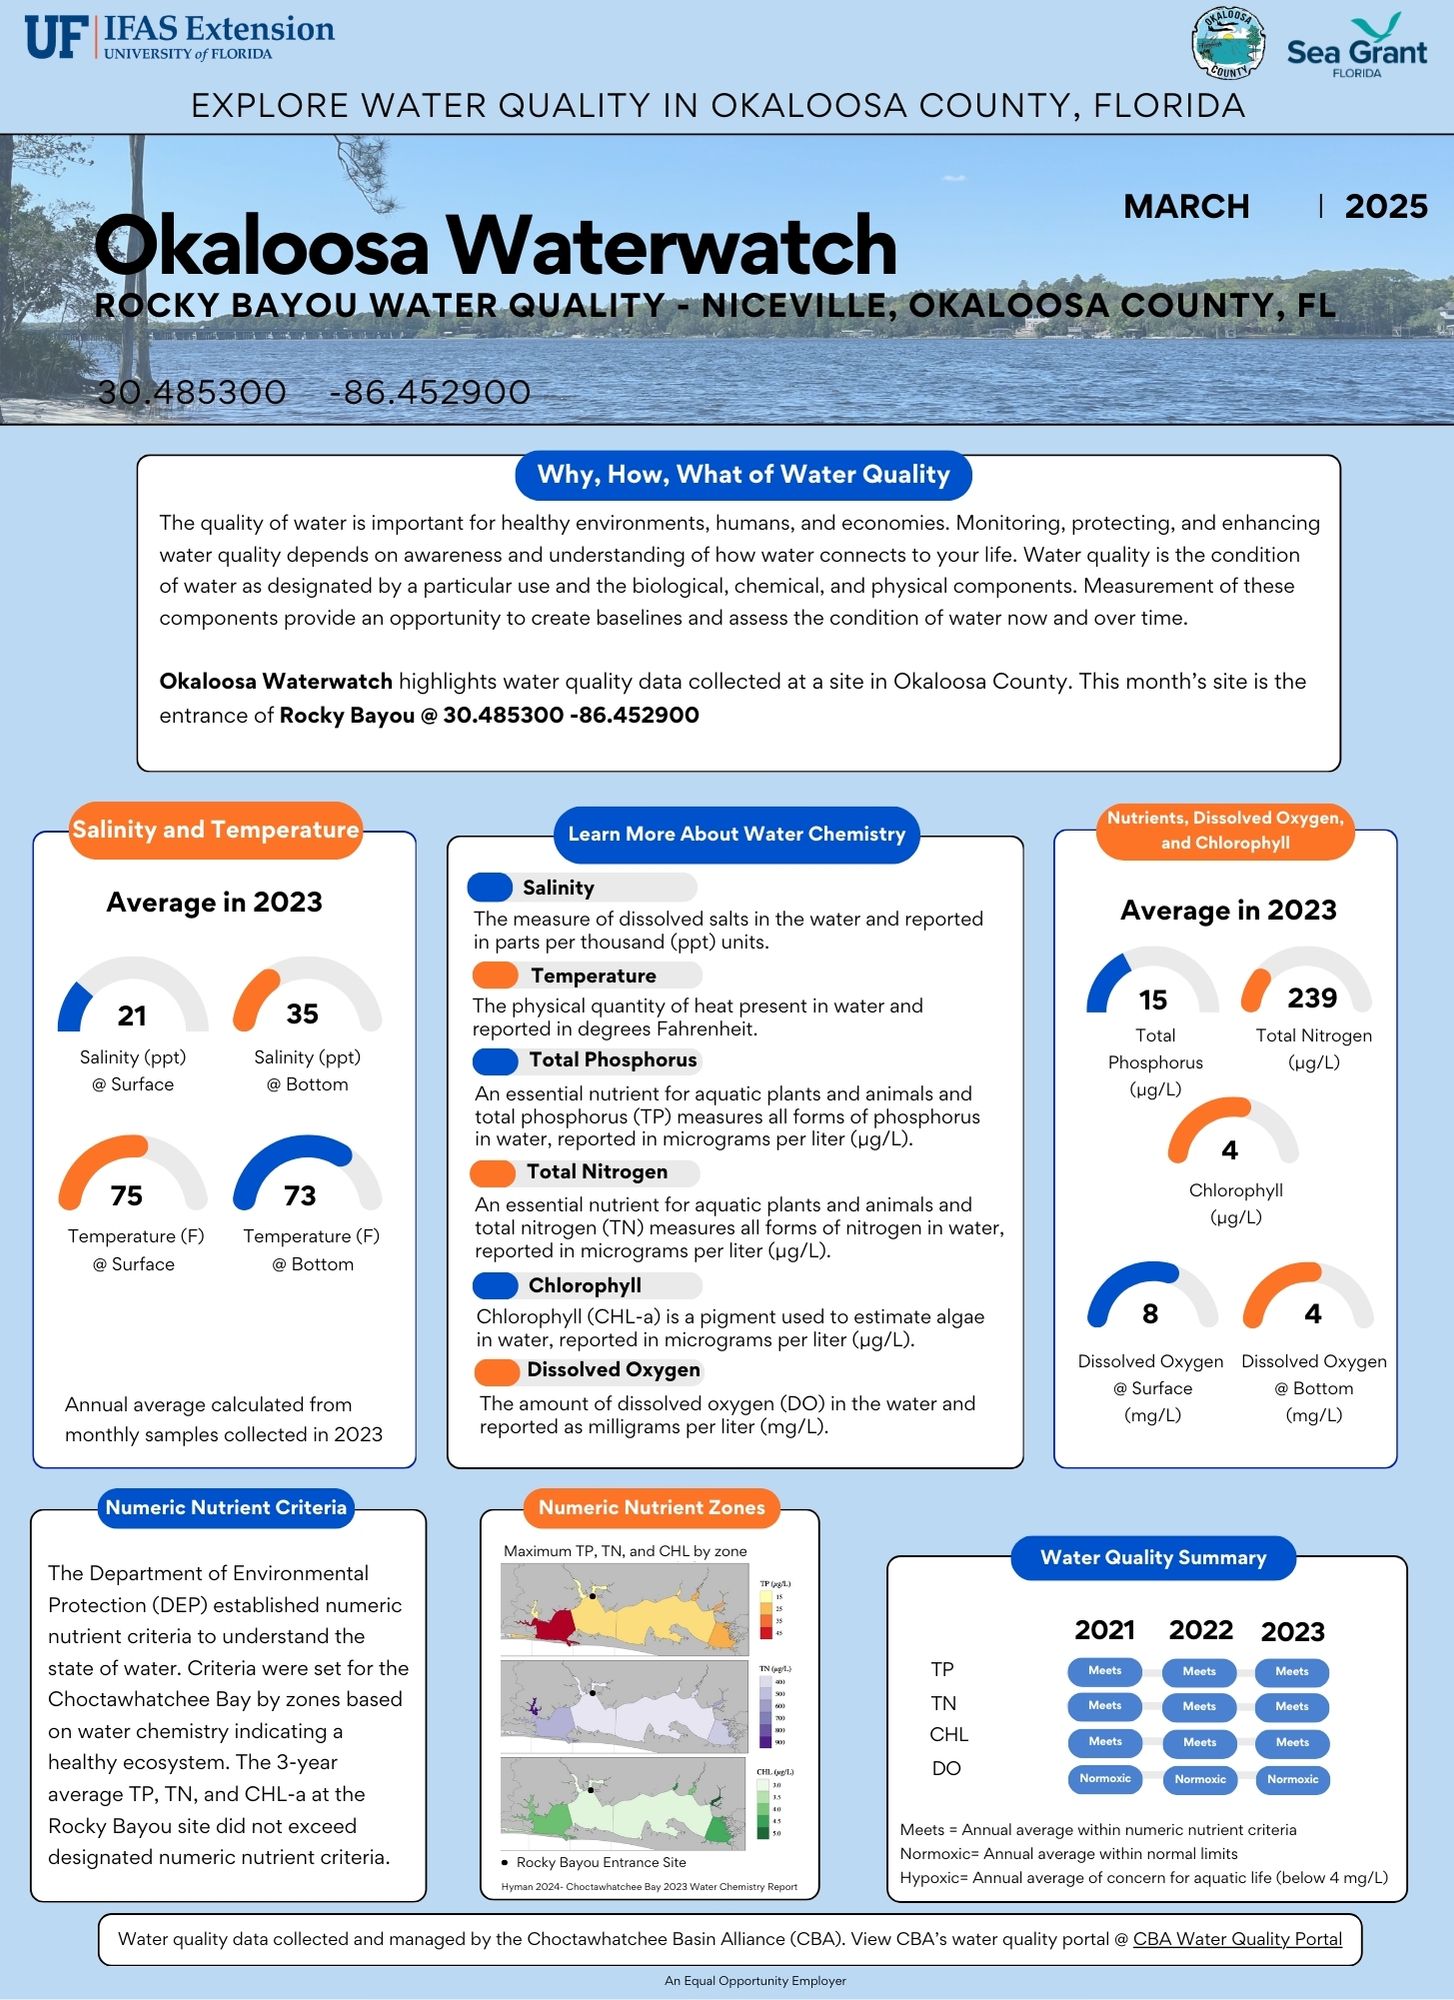
Okaloosa Waterwatch is an opportunity to explore water quality data in selected locations spanning the Okaloosa County portion of the Choctawhatchee Bay.
A site is selected each month, and available water quality data are summarized and explained. The purpose is to understand water quality and the condition of our waters. Thanks to the Choctawhatchee Basin Alliance (CBA), water quality data has been collected frequently (monthly) for many years.
Below are the February and March Okaloosa Waterwatch water quality summaries. February highlights the mid-bay bridge (Niceville) location, and March highlights the entrance to Rocky Bayou (Niceville) location.
Check out the Okalooas Waterwatch YouTube channel for a personalized audio review of the water quality summaries. The YouTube channel is Okaloosa Waterwatch (@OkaloosaWaterwatch) or navigate directly using this link: https://www.youtube.com/channel/UCGPVMsyMiTU5BT9xyrFhuYQ
Please contact Dana Stephens, UF/IFAS Okaloosa County Sea Grant Extension Agent, for more information or to learn more about water quality in Okaloosa County. Email is dlbigham@ufl.edu and office phone is 850-689-5850.
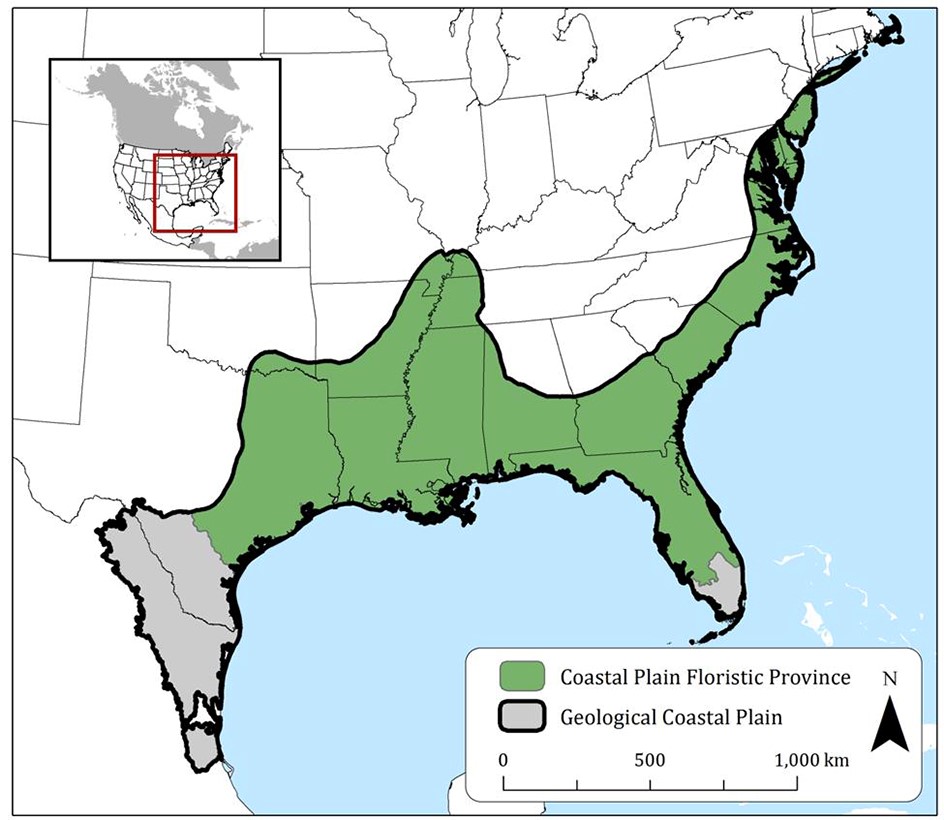
The North American Coastal Plain. Diagram courtesy Musa Jundi, UF Biodiversity Institute.
According to Conservation International, there are 36 biodiversity hotspots worldwide. These are defined as areas with “at least 1,500 vascular plants as endemics — which is to say, it must have a high percentage of plant life found nowhere else on the planet. A hotspot, in other words, is irreplaceable. It must have 30% or less of its original natural vegetation. In other words, it must be threatened.”
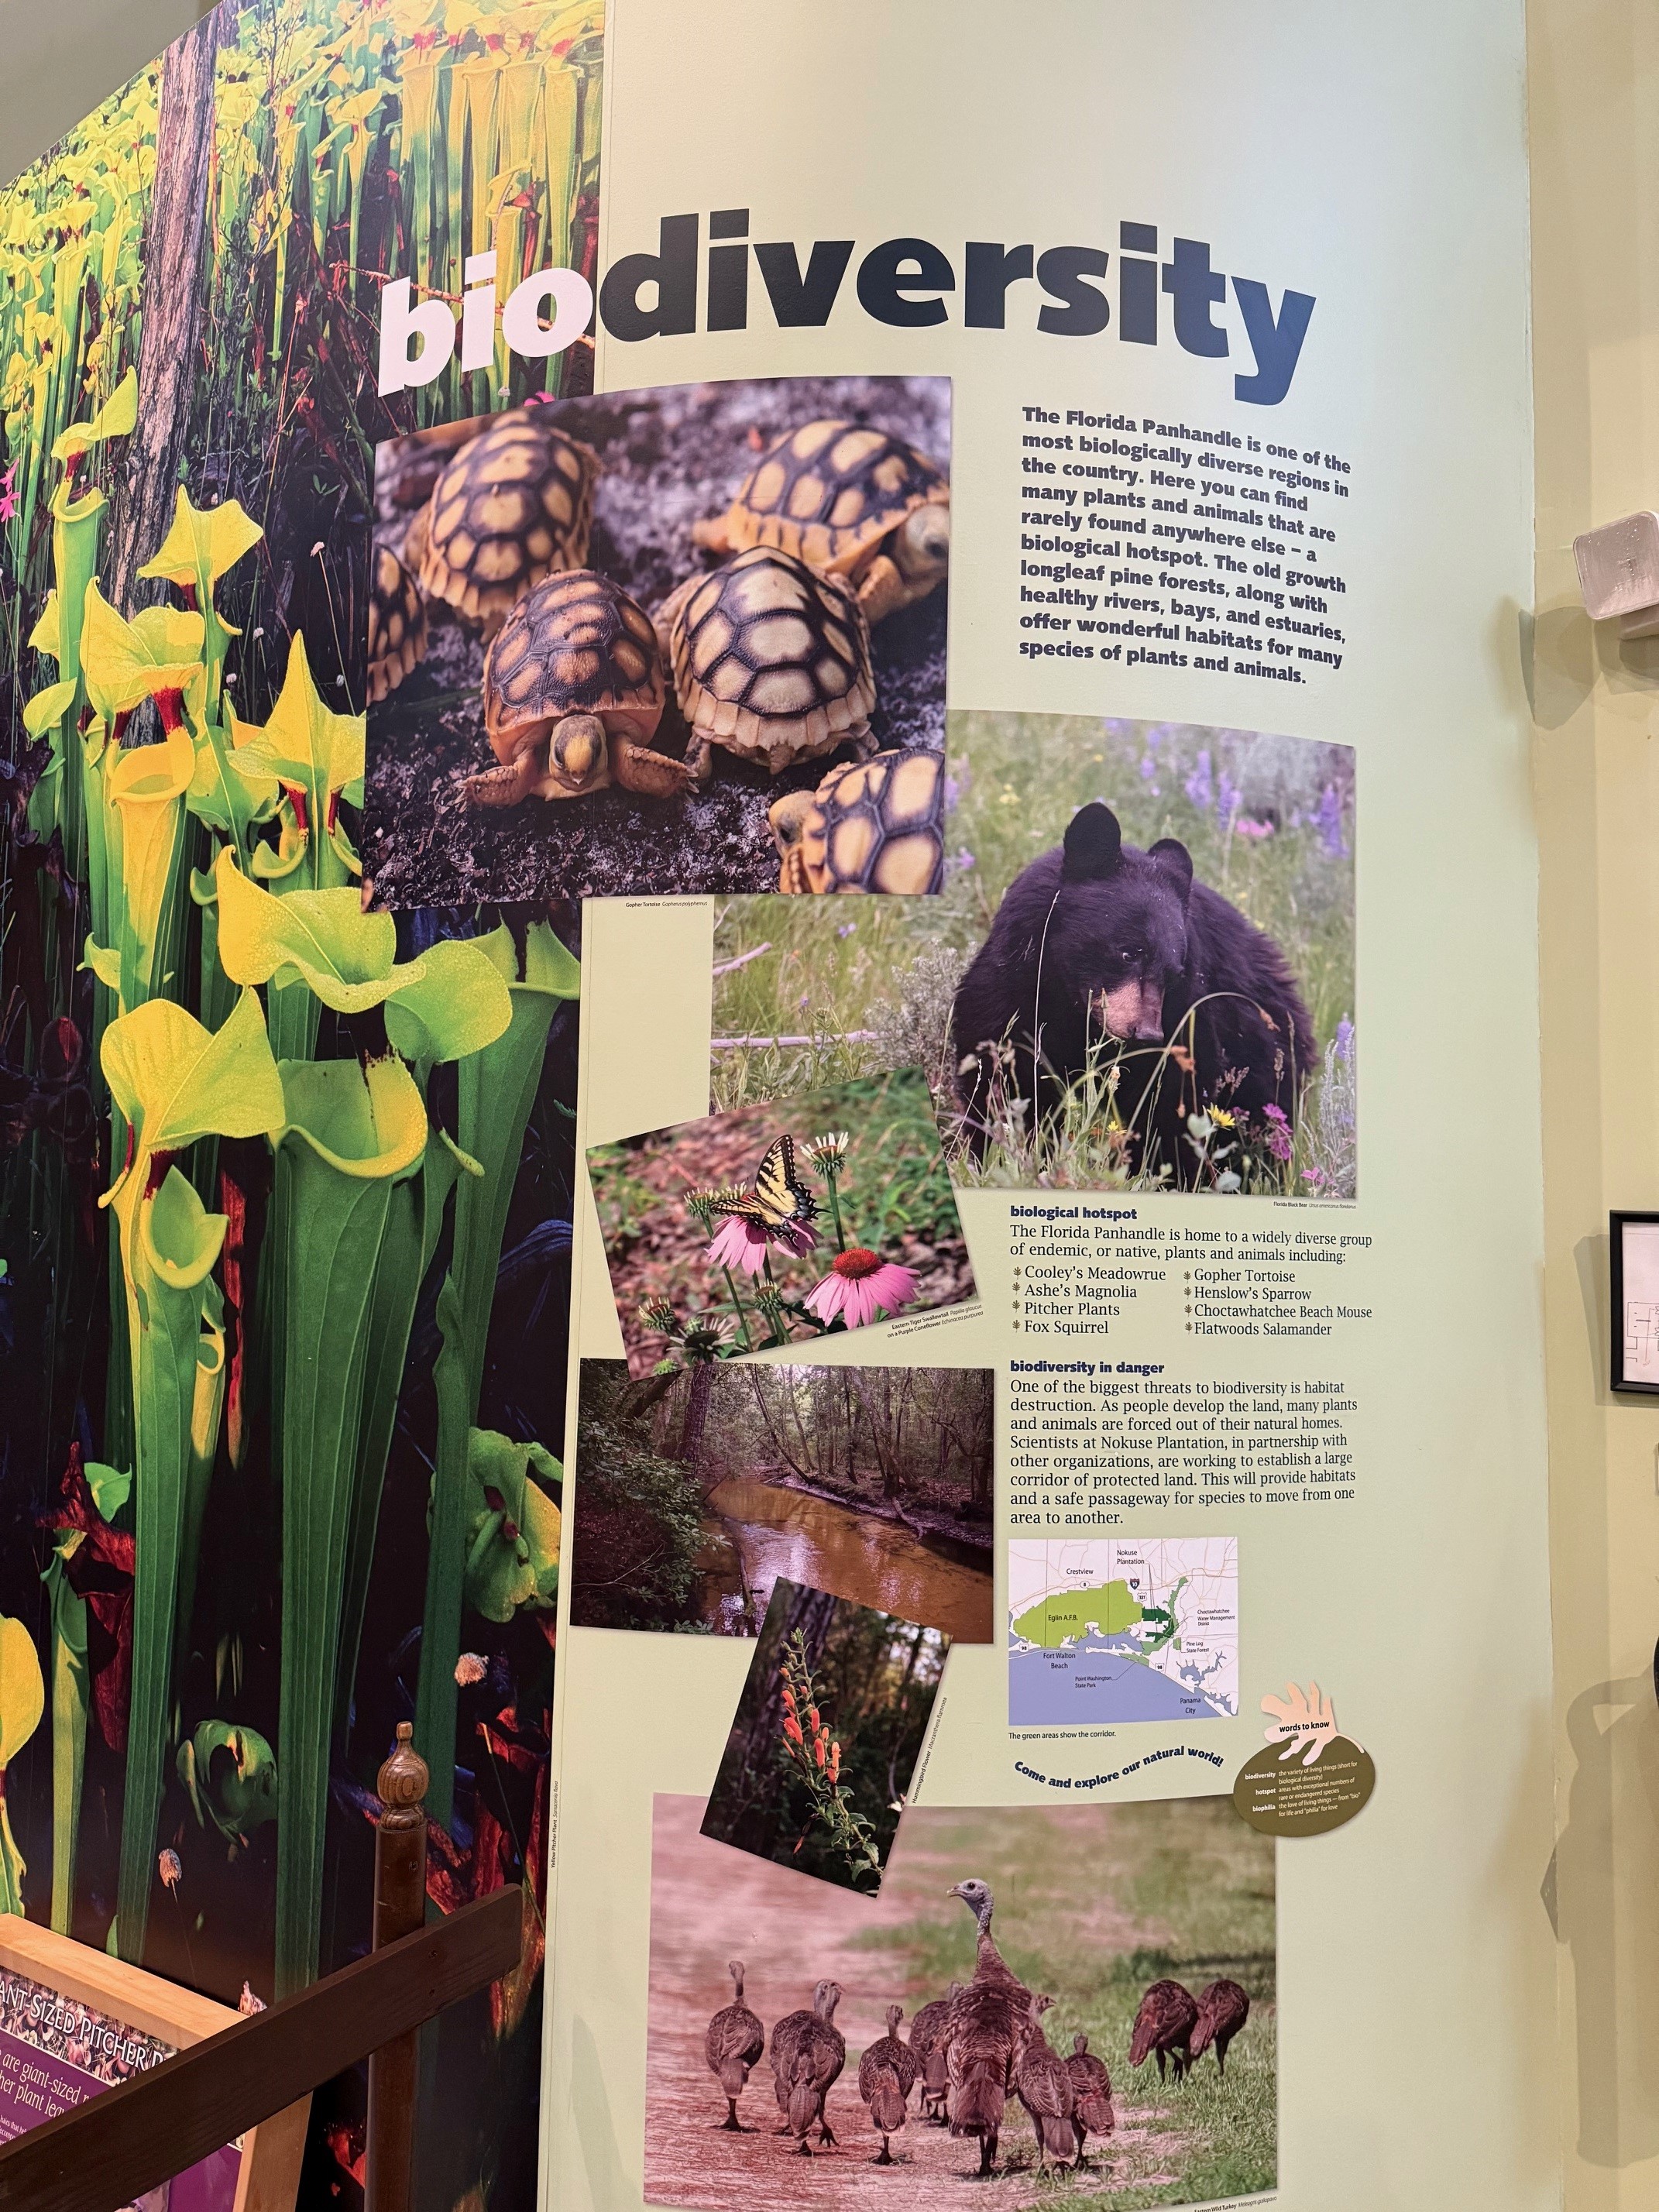
An exhibit at the Biophilia Center in Walton County highlights the biodiversity of our region. Photo credit: Carrie Stevenson, UF IFAS Extension
Only two of these 36 biodiversity hotspots lie within the United States, including the North American Coastal Plain, which stretches from Texas along the Gulf Coast and up the Atlantic coast. The state of Florida rests fully within the coastal plain. Within that region, northwest Florida is the hottest “biodiversity hotspot,” one of just six designated regions in North America.
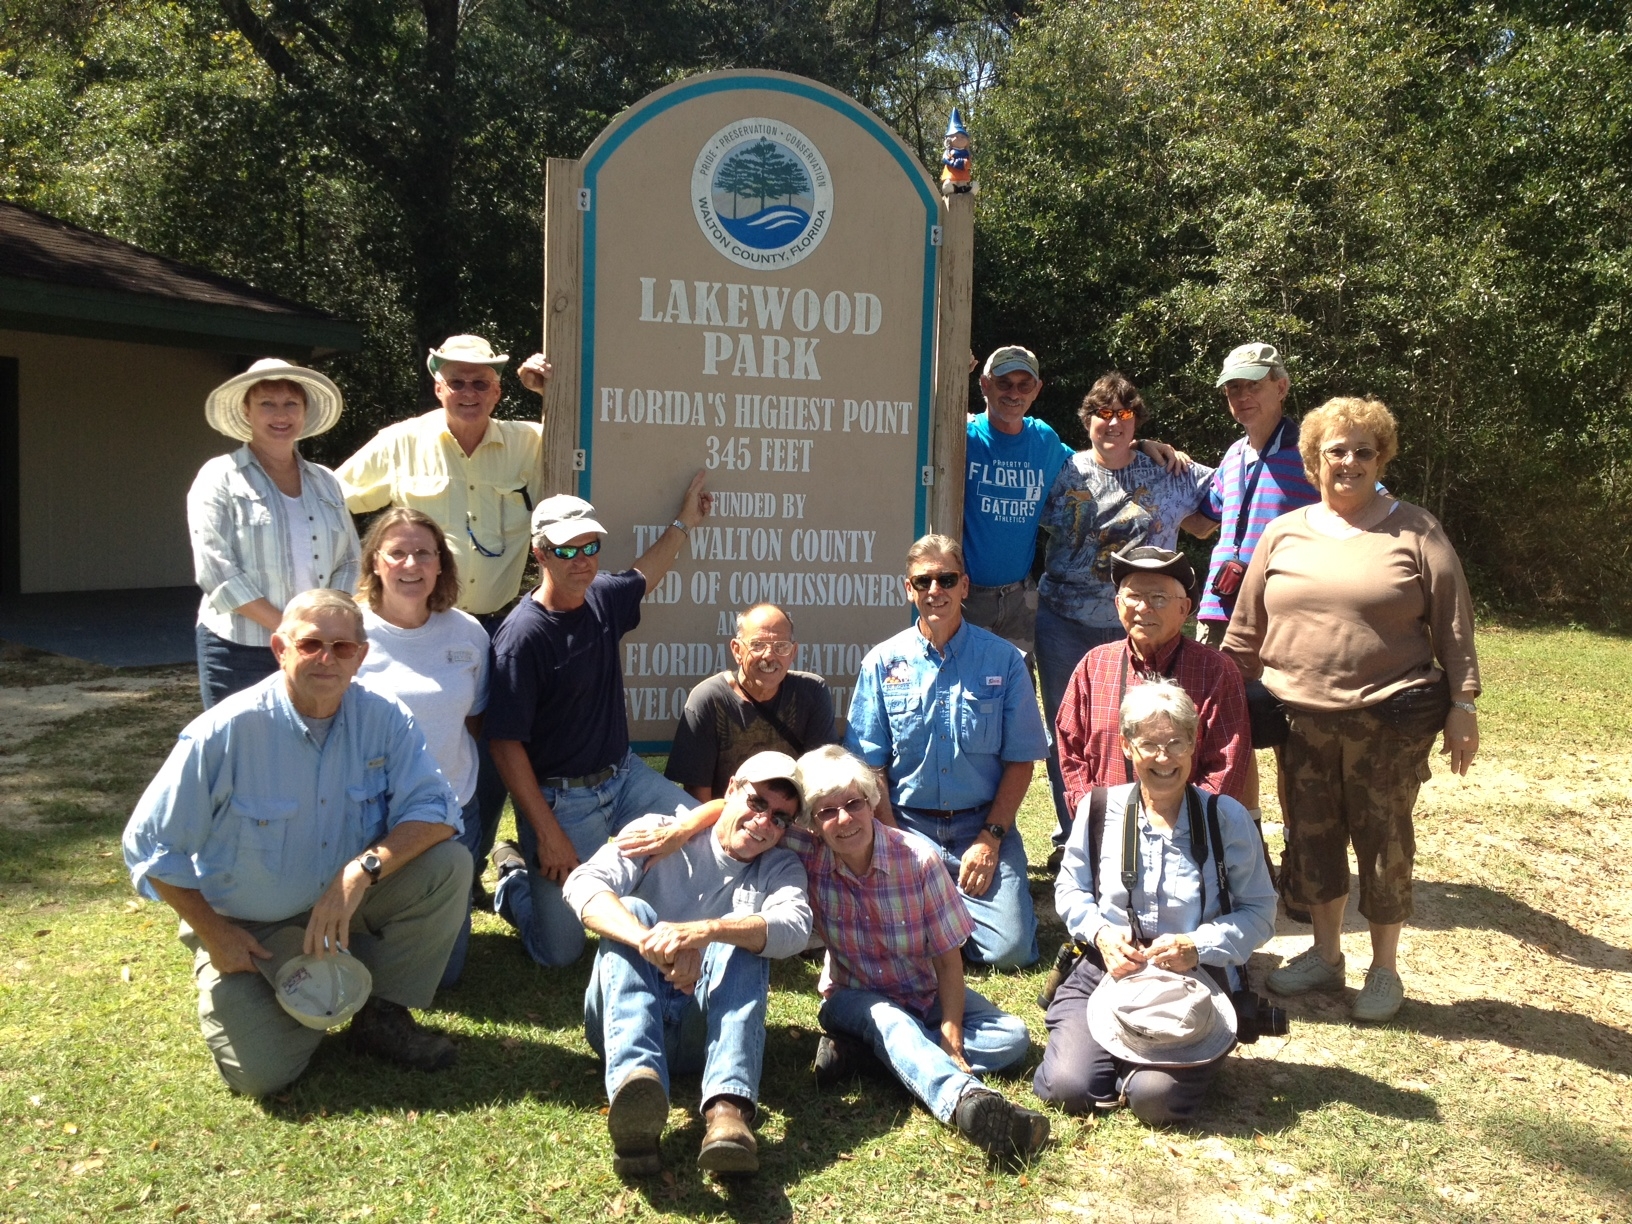
Why us? How did our little corner of the state earn such notoriety? If you’ve ever spent August here, you know how very hot and humid it gets in the summer. As we experienced with the snow and freeze a couple of weeks ago, the Panhandle endures some rather extreme temperatures that fall within our natural range. Our coastal communities sit just above sea level, but we’ve also got hills—while not terribly high (345 feet), the state’s highest point is in Walton County. Along the bluffs of the Apalachicola are whispers of the last Ice Age, where fingers of the Appalachian Mountain range are visible in the same hardwood species and geologic formations typical of north Georgia and Tennessee.
Florida Master Naturalist students visit Britton Hill, the highest point in Florida. Photo credit: Carrie Stevenson, UF IFAS Extension
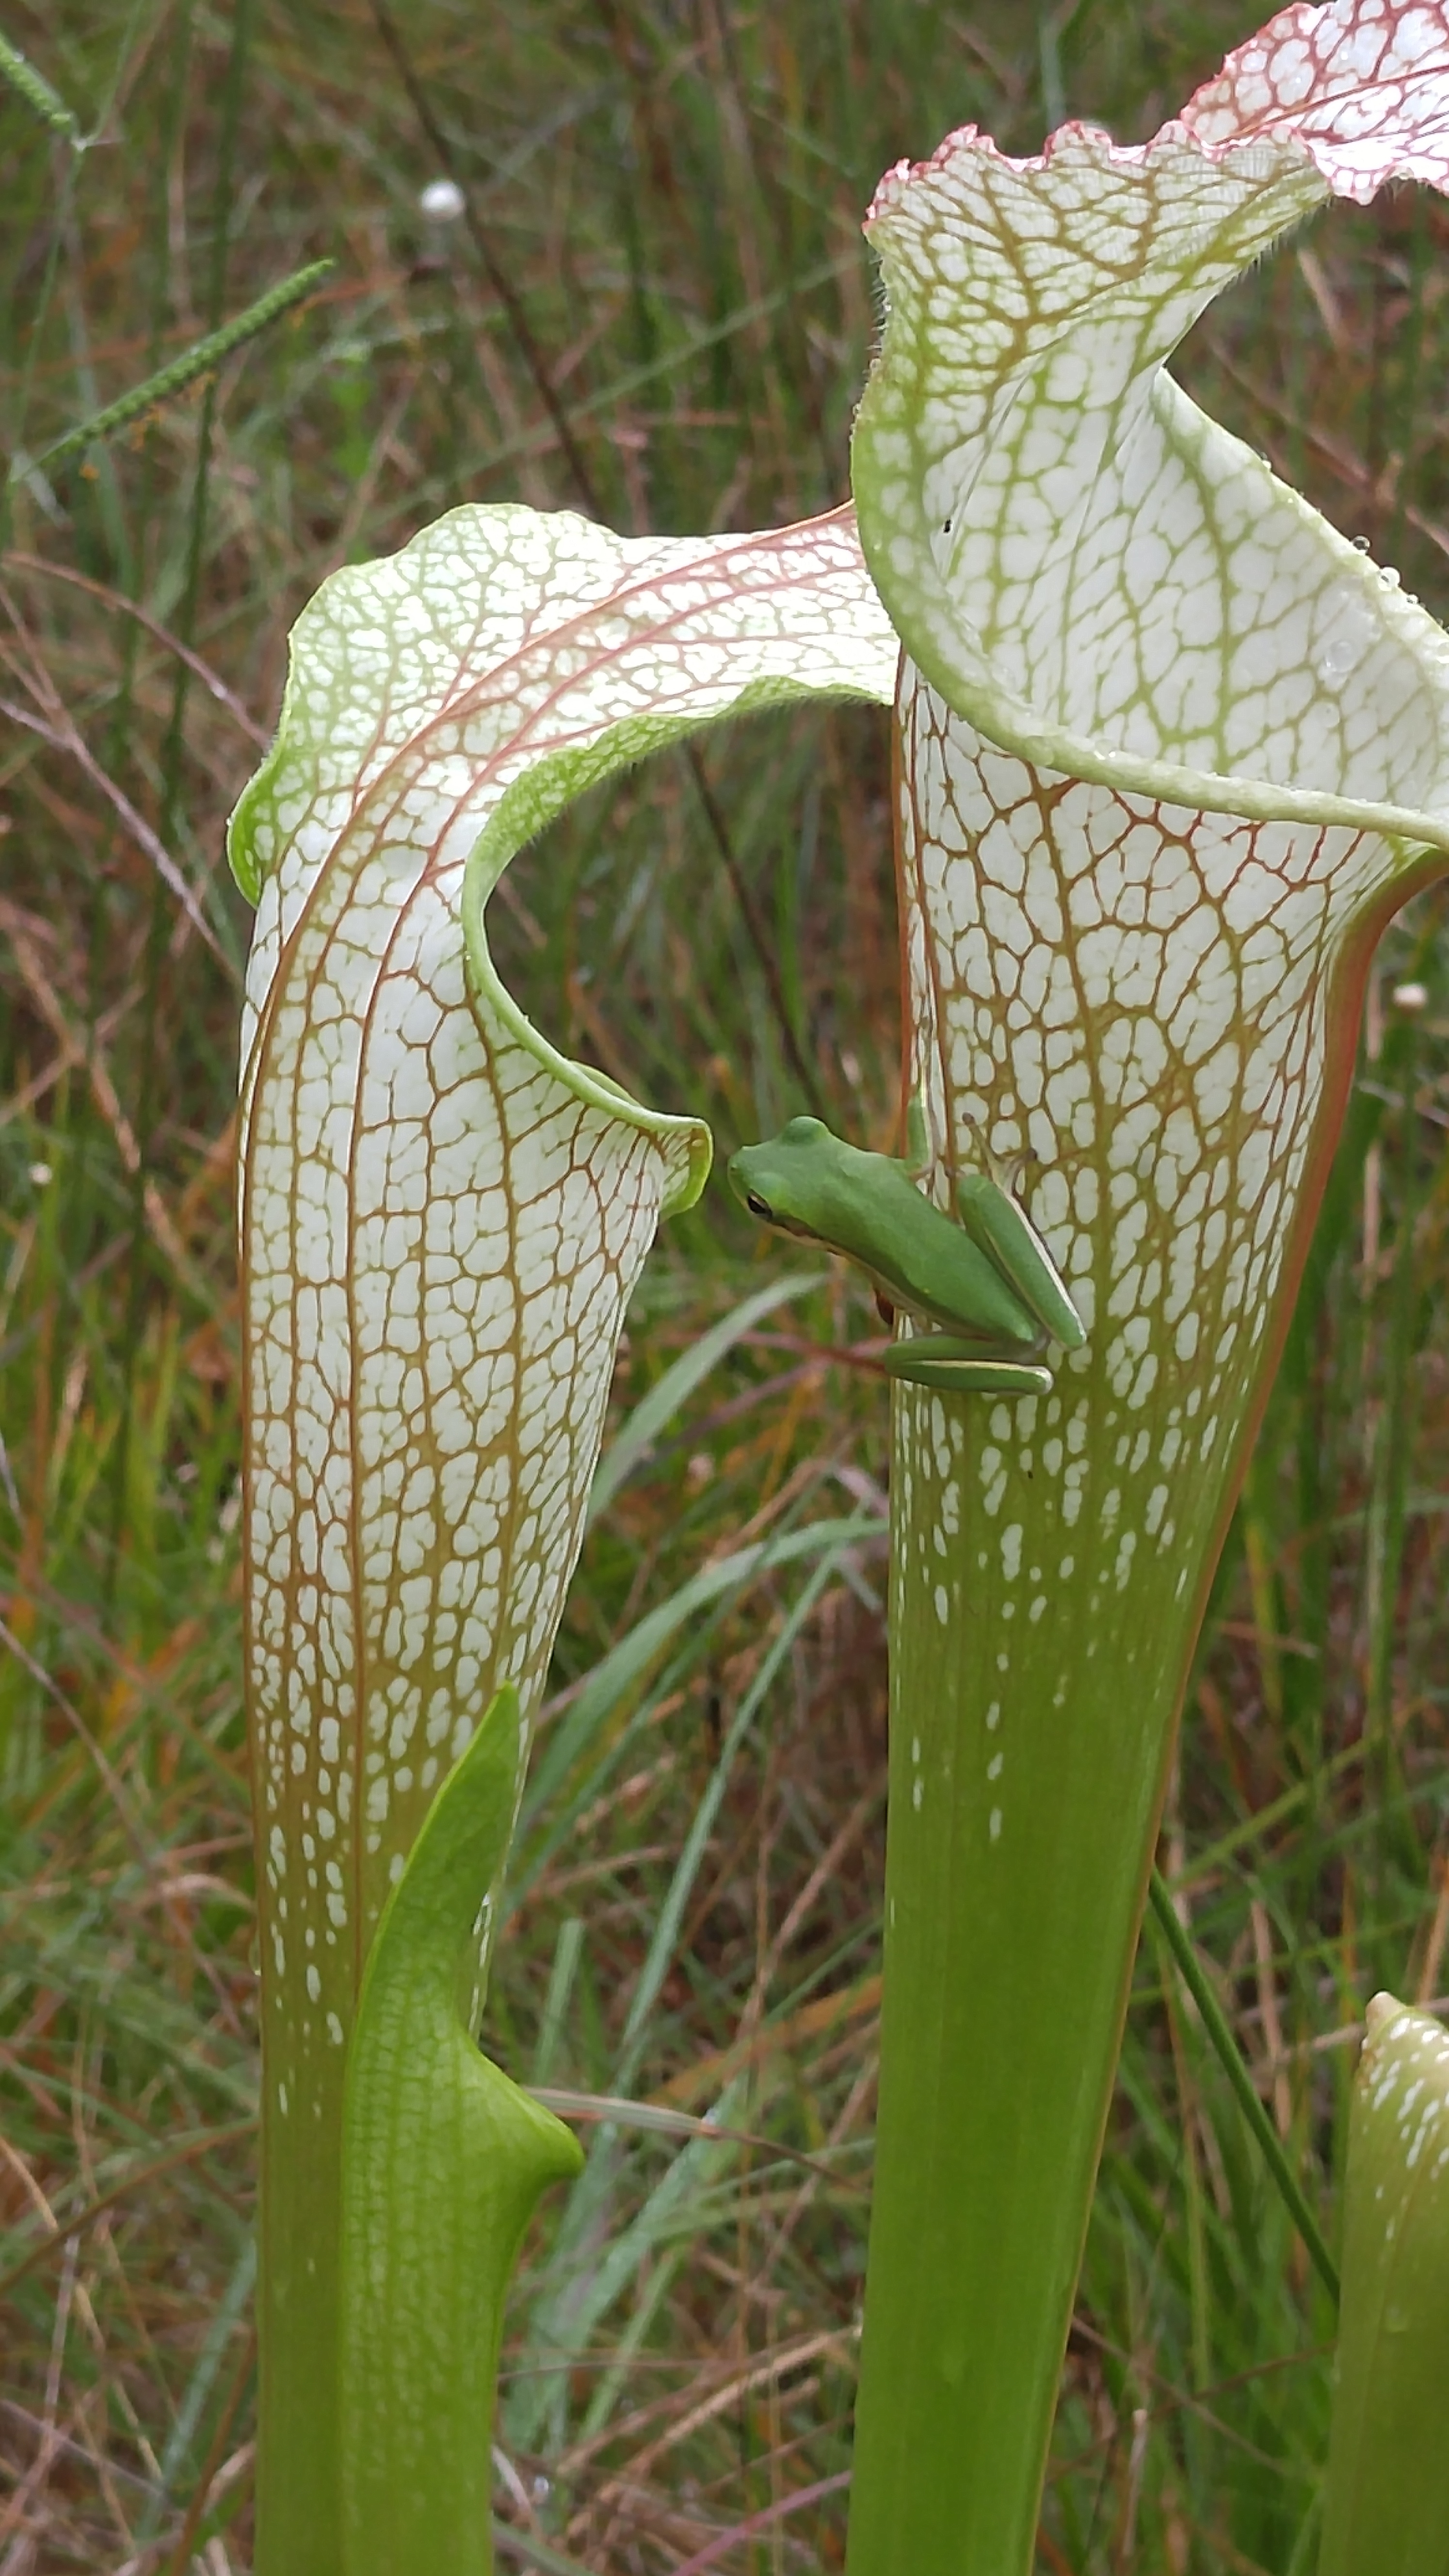
As they say, variety is the spice of life, and this wide spectrum of livable habitats, from coastal marsh to high and dry ridges means we have more options for plants and wildlife to inhabit. The Florida panhandle is home to more than 2500 plant species, 300 species of birds, and 25 species of salamanders, including many endemic species found nowhere else in the world. The oxygen-deprived soils of our flatwood bogs give rise to dozens of carnivorous plant species. They’ve adapted to poor nutrition in the soil by supplementing with insects. Vast waterways mean we have 500 species of saltwater fish and at least 85-90 freshwater fish, including those that live a portion of their life cycle in both.
In the wild world of pitcher plant bogs, frogs compete with plants for insect prey. Photo credit: UF IFAS Extension
A project known as the Northwest Florida Greenway Corridor is actively being funded and set aside to create a 150,000 acre conservation region connecting two million acres of protected land including Blackwater River State Forest, Eglin Air Force Base, and Apalachicola National Forest . Along with coastal barrier islands and inland areas of Gulf Islands National Seashore, these huge swaths of land enable large species like bears, alligators, and cats to roam with less interference from human development. Restoration of longleaf pine and dune ecosystems mean the land and waters are managed to ensure the survival of smaller endangered species like flatwoods salamanders, beach mice, gopher tortoises, red cockaded woodpeckers, and sea turtles. The confluence of less development (compared with densely urban areas to our south), large state and national parks, and protected military bases have allowed plants and wildlife to thrive unlike any other region.
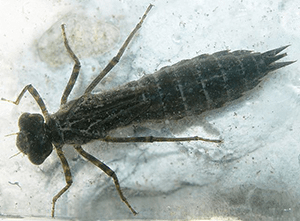
The presence of dragonfly larvae is a sign of good water quality. Photo credit: UF IFAS Extension
In science, we measure both species richness (the number of different species in an area) and abundance (actual number of individuals) to come up with an index for species diversity. Generally, the higher these numbers, the healthier the ecosystem. A clear example of this can be seen when monitoring water quality in streams. If you sample the macroinvertebrate population of a creek and find only bloodworms, you know water quality conditions are terrible. These species can survive in sewage water. But, if you find dozens of species, particularly the larvae of pollution-sensitive caddisflies, mayflies, and stoneflies, this indicates the water is clean and hospitable to a wide variety of species. These insects serve as the basis of the food web for fish, crabs, and larger animals that maintain a healthy ecosystem.
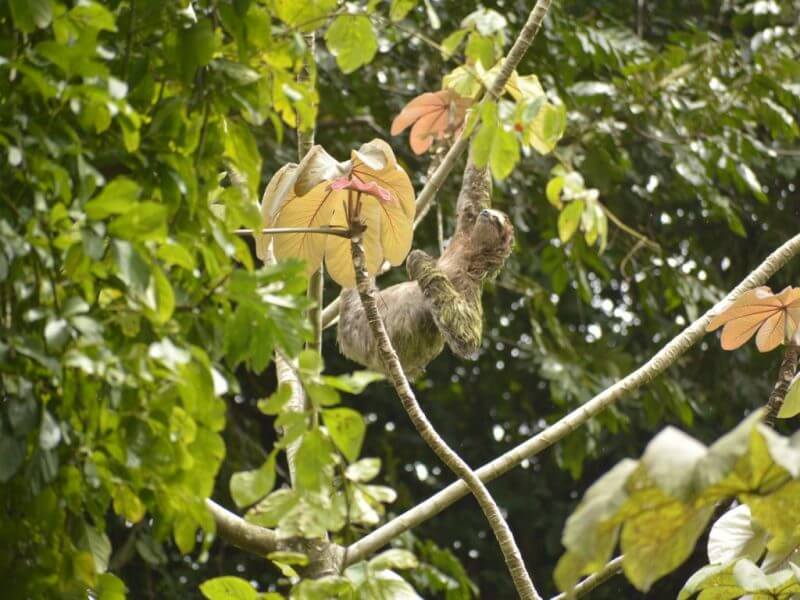
The layered canopies of trees with diverse fruit and flowers provide habitat for thousands of bird, reptile, mammal, amphibian, and insect species, making it the most biodiverse habitat type on the planet. Photo courtesy Manuel Antonio National Park, Costa Rica.
It’s generally understood in ecology that the “higher the diversity, the greater the stability.” When we create monocultures—ecosystems containing one or only a handful of dominant species types—these systems are weak and susceptible to attack. Agricultural operations that grow one crop are prime examples of how monocultures can be highly vulnerable—orange groves devastated by disease or freezes; chicken farms wiped out by avian influenza. They cannot adapt to threats, and being genetically similar they can be easily devastated by a single disease or environmental threat. Having a diversity of species creates a redundant “back-up” system for crucial ecosystem services, like providing pollen, erosion management, or shade from extreme heat if other species suffer from pathogens or parasites.
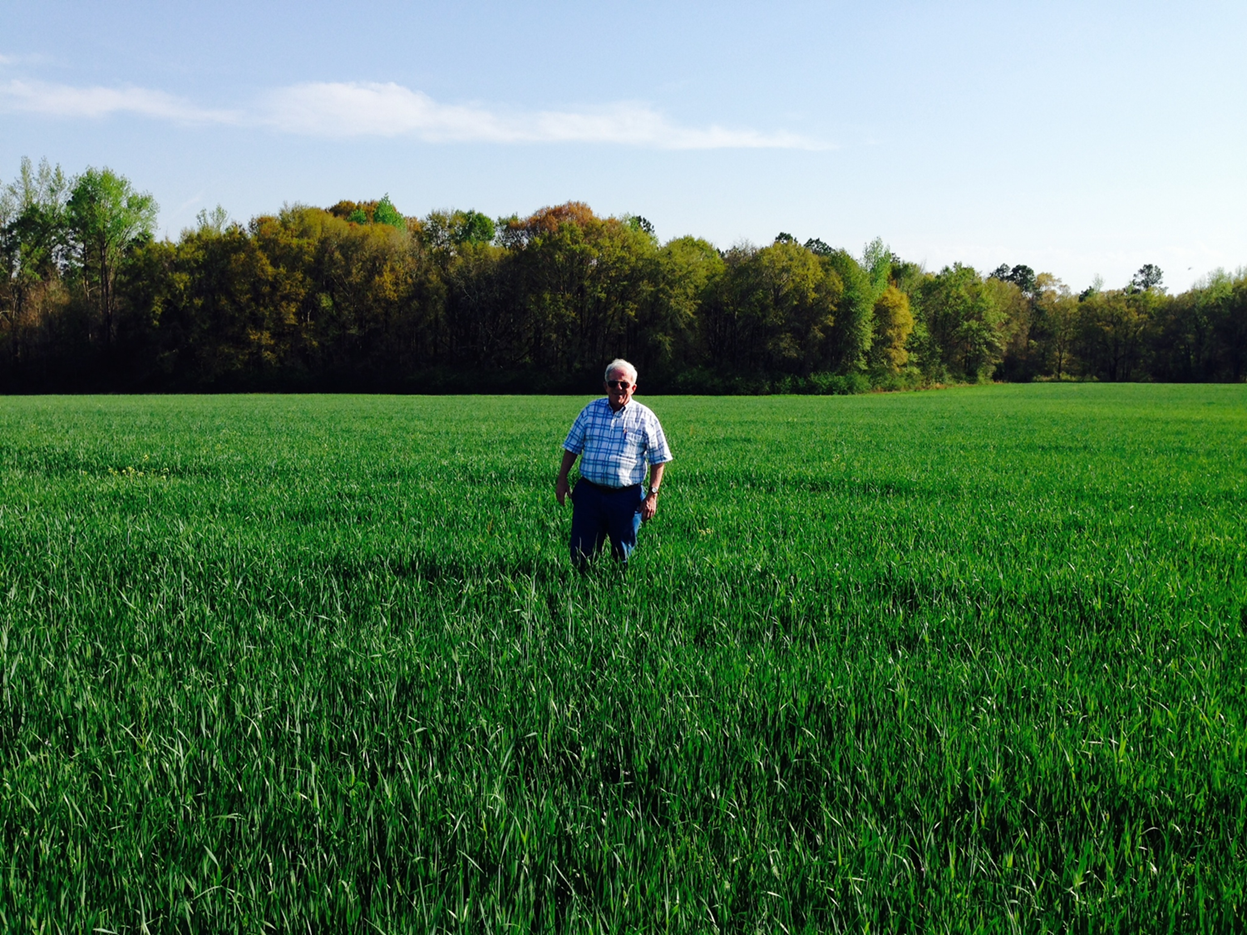
Agriculturists recommend rotating crops annually or seasonally to increase soil health and prevent the weaknesses brought on by monocultures. Photo credit: Ann Blount, UF IFAS Extension
Just like economists measure the health of an economy by productivity, ecologists can analyze ecosystems mathematically. And where are those most productive ecosystems located? It’s not the extreme habitats of tundra, grassland, and desert, where only a handful of species survive. The most productive ecosystems—those cycling nutrients, producing oxygen, and converting solar energy to biomass, are the most diverse ones. At the top are tropical rainforests, coral reefs, and estuarine swamps and marshes. These ecosystems have thousands of moving parts and are virtually impenetrable to a single disease or pest wiping them out. If one species suffers, there are so many backups to fill in and perform the important roles. In fact, the only disturbance any of these systems can’t defend against are complete clearing or extreme pollution by humans.
The world is much bigger than humanity. It is wise to consider the words of my favorite biologist, E.O. Wilson. An expert on insects, especially ants, he once said, “If all mankind were to disappear, the world would regenerate back to the rich state of equilibrium that existed ten thousand years ago. If insects were to vanish, the environment would collapse into chaos.”