Bay scallops (Argopecten irradians) have been an important part of the economy of many gulf coast communities within the Florida Big Bend for decades. It was once abundant in all gulf coast counties of the state but beginning in the 1960s populations in many bays began to decline to levels where they are all but nonexistent. The cause of this decline has been associated with many factors including a decline in water quality, a decline in suitable habitat (sea turtle grass beds – Thalassia), and overharvesting. Most likely the cause included all of these. Since the collapse of both the commercial and recreational fishery, Gulf coast communities have been trying to address all three of the stressors above. Multiple monitoring projects are ongoing in the Pensacola Bay area and one of those is the Great Scallop Search.
The Great Scallop Search was developed by Sea Grant Agents in Southwest Florida and expanded, through Florida Sea Grant, to Northwest Florida. In each location volunteers snorkel a 50-meter transect line searching for live bay scallops, as well as monitoring the status of the seagrass habitat. Since 2015 317 volunteers have logged 634 hours surveying 407 50-meter transects in 106 grids in Big Lagoon or Santa Rosa Sound. In that time 4 live scallops have been logged, though we hear anecdotal reports of additional scallops being found in these bodies of water.
Survey Method
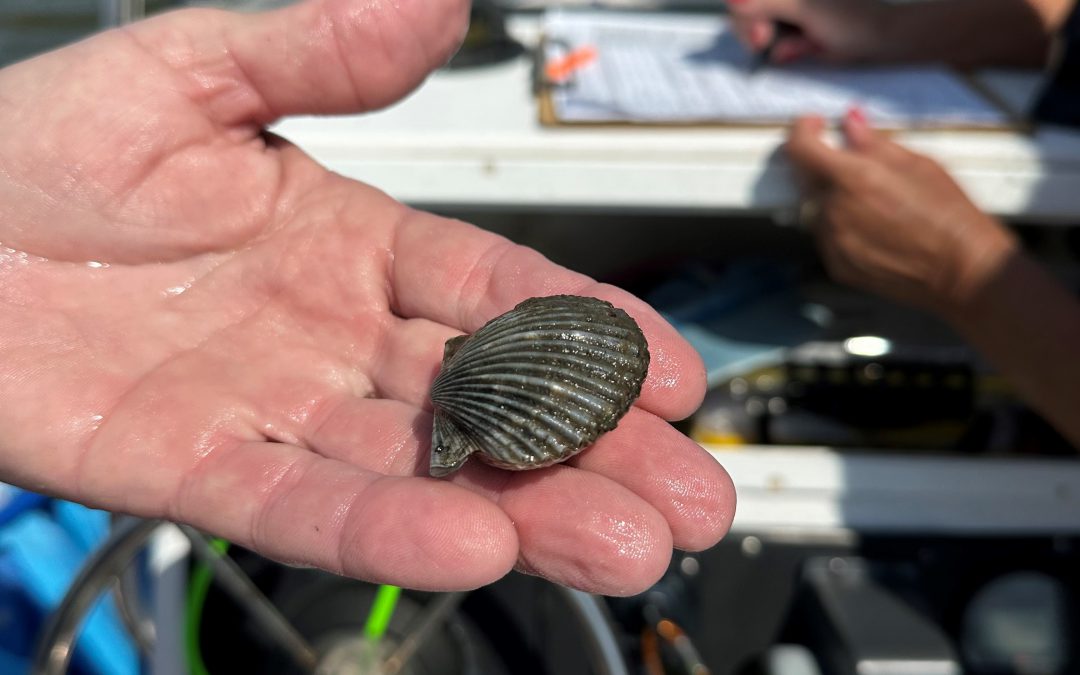
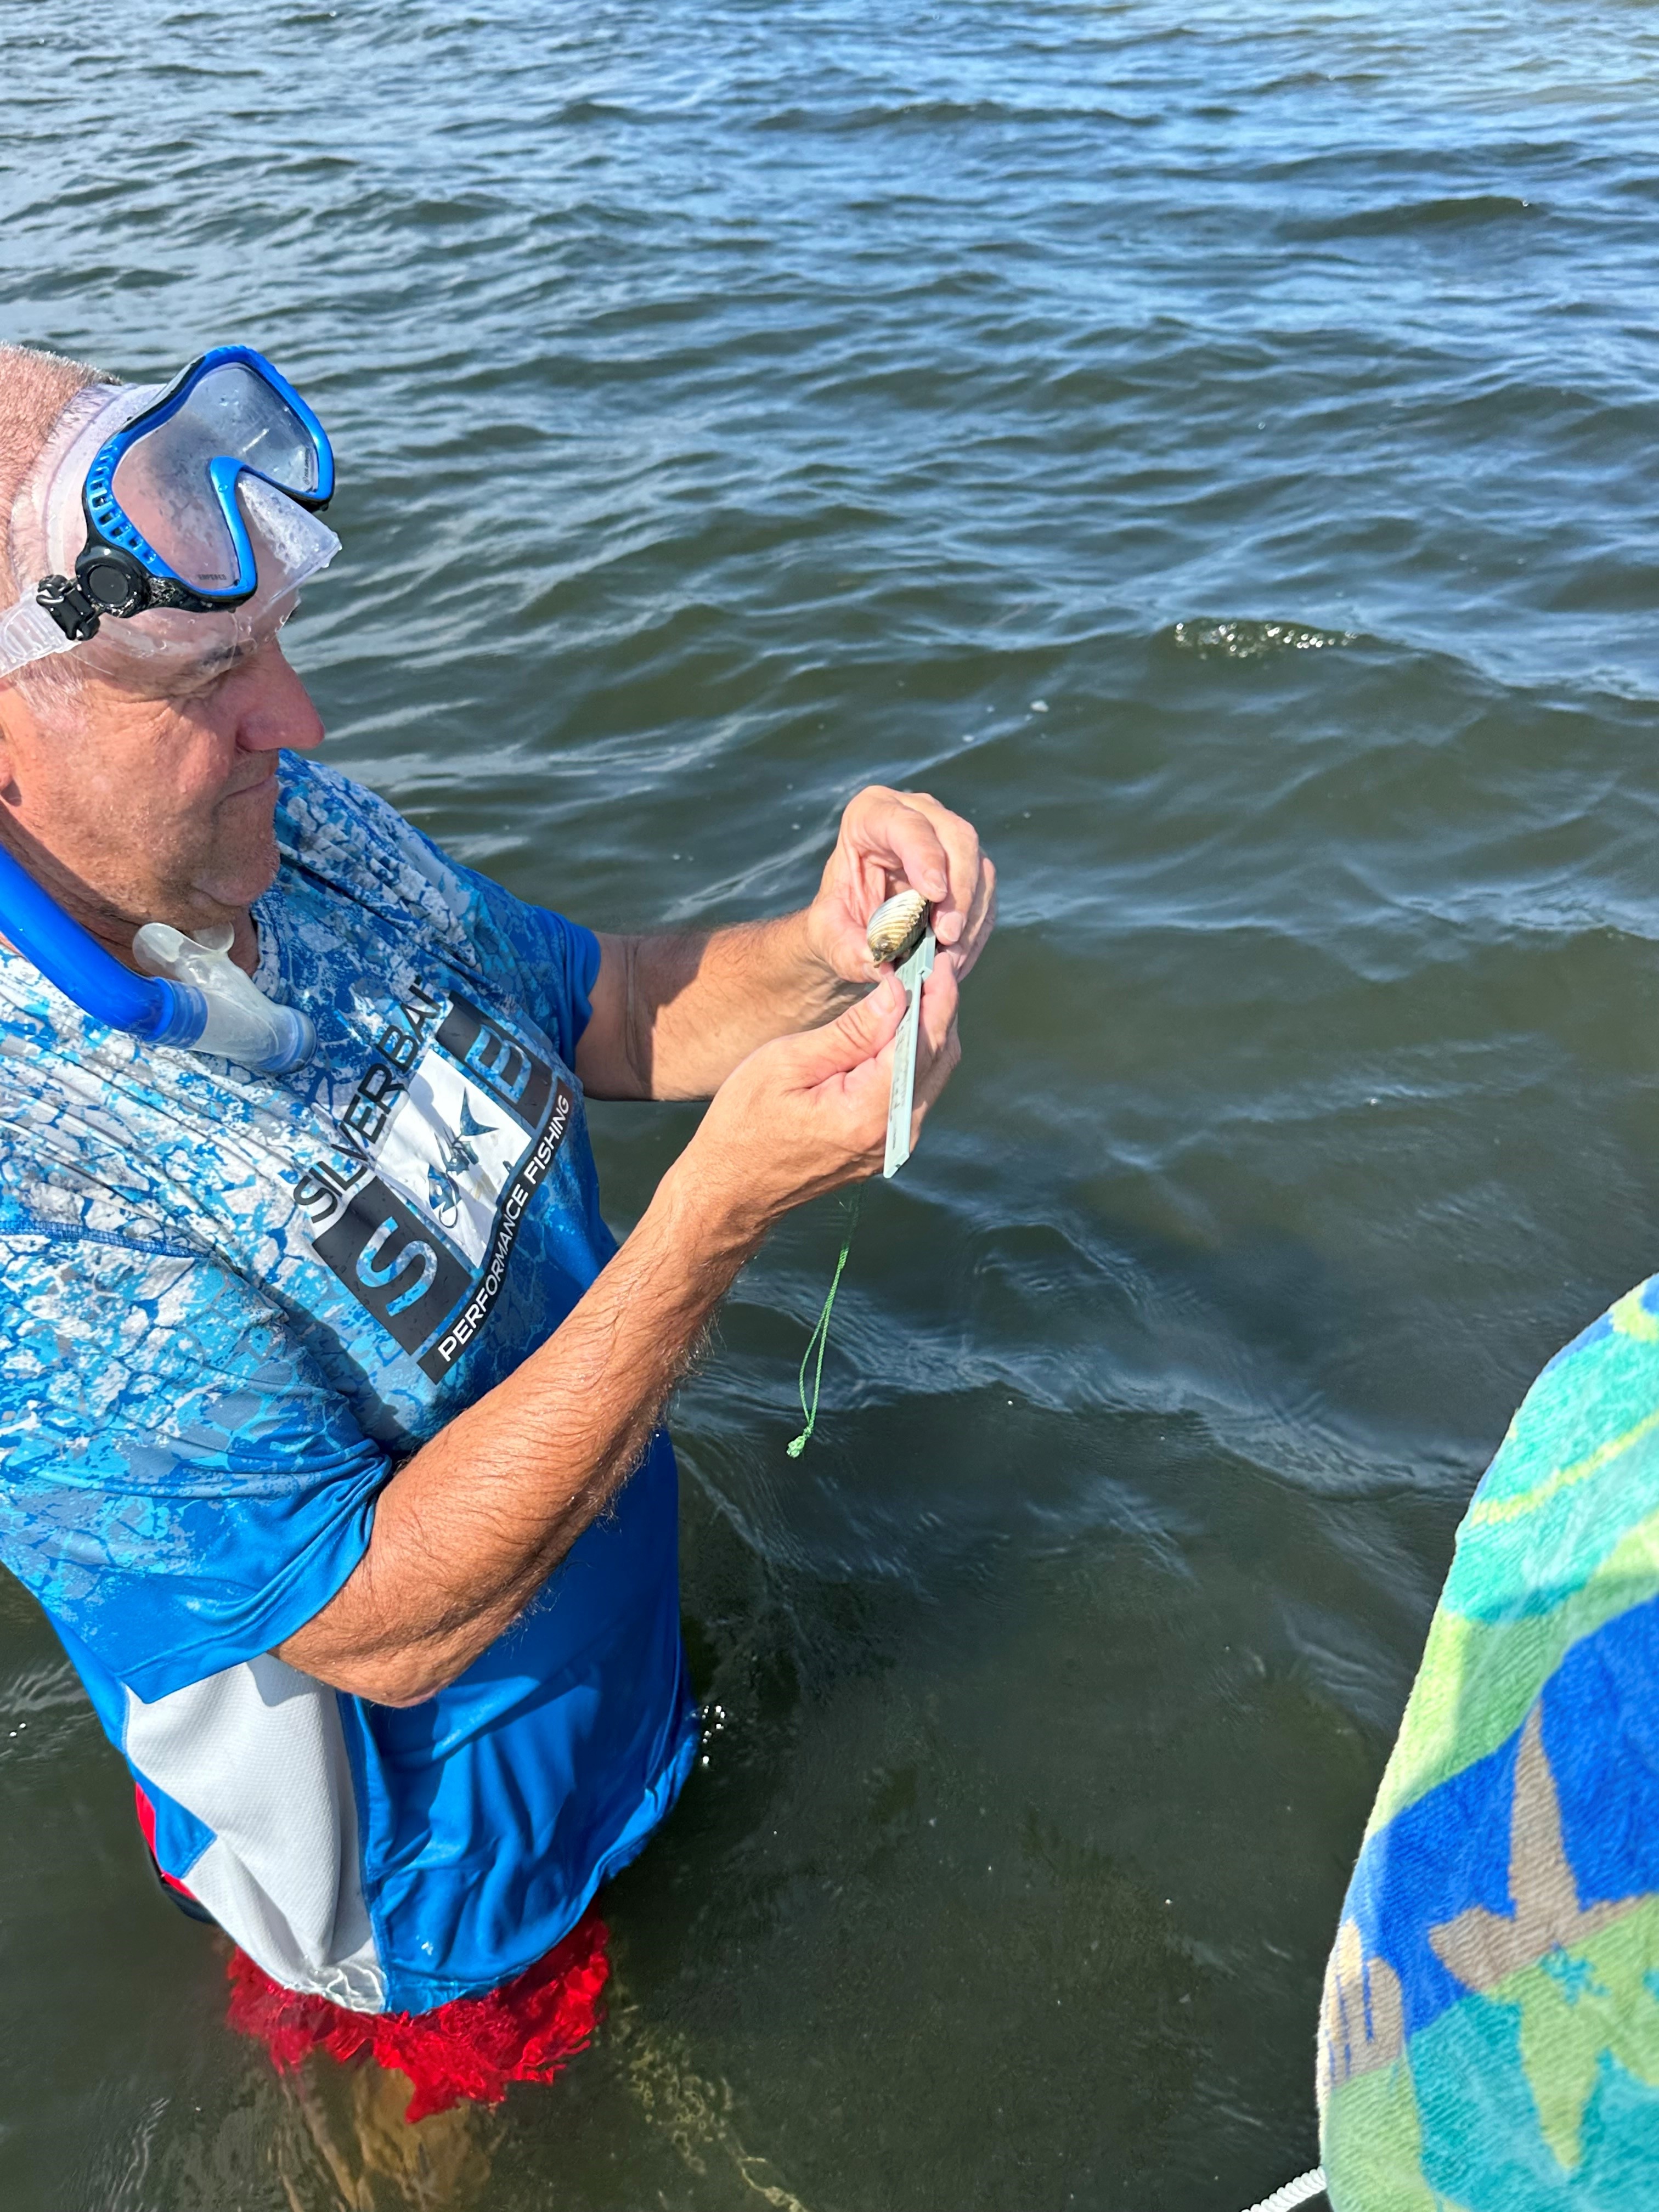
Volunteers select and survey one of 11 grids in Big Lagoon, or one of 55 grids in Santa Rosa Sound. Once on site, the volunteers anchor and record preliminary information on the data sheet provided. Two snorkelers enter the water and swim on opposite sides of a 50-meter transect line searching for live scallops. Any live scallop found is measured and returned. The species and density of the seagrass is recorded as well as the presence/absence of macroalgae on that seagrass. Four such transects are surveyed in each grid.
2023 Results
2023
SRS
BL
Total
Other
# of volunteers
72
No significant difference between 2022 and 2023
# of grids surveyed
8
8
16
Slight decrease from 2022. 16 of the 66 grids (24%) were surveyed.
# of transects surveyed
26
51
77
A decrease from 2022. More surveys were conducted in Big Lagoon than Santa Rosa Sound.
Area surveyed (m2)
2600
5100
7700
1.9 acres
# of scallop found
2
2
4
Four live scallops are a record for this project. It equals the sum of all other live scallops since the project began.
Scallop Size (cm)
4.5, 5.0
4.0, 4.5
Surveys with Seagrass
Halodule
5
12
17
17/21 surveys – 81%
Thalassia
8
11
19
19/21 surveys – 90%
Syringodium
0
2
2
2/21 surveys – 10%
Grass Density
100% grass
3
9
12
12/21 surveys (57%) were 100% grass
90%
1
0
1
Note: Volunteers typically select area for transects
75%
3
1
4
with a lot of grass.
70%
1
0
1
50%
3
9
12
5%
1
0
1
Macroalgae
Present
4
4
8
Absent
2
10
12
12/21 surveys (57%) had no macroalgae.
Abundant
2
2
4
Sediment Type
Mud
0
1
1
Sand
7
8
15
15/21 surveys (71%) were sandy.
Mixed
1
4
5
21 surveys were conducted covering 16 grids. 8 grids were surveyed in each body of water.
A total of 77 transects were conducted covering 7,700 m2 and four live scallops were found.
Two of the scallops were found in Big Lagoon and two in Santa Rosa Sound.
All scallops measured between 4-5cm (1.6-2”).
The number of live scallops found this year equaled the total number found over the last eight years.
Most of the transects included a mix of Halodule and Thalassia seagrass ranging from 100% coverage to 5%. The majority of the transects were between 50-100% grass. Four transects had 100% Thalassia. Three of those were in Santa Rosa Sound, one was in Big Lagoon. The diving depth of the volunteers ranged from 0 meters (0 feet) to 2.4 meters (8 feet). Macroalgae was present in 8 of the 21 surveys (38%) but was not abundant in most.
Volunteer measuring one of the four collected bay scallops in 2023 from Pensacola Bay.
Photo: Gina Hertz.
Summary of Project
Year
Volunteer
Grids Surveyed
Transects Surveyed
Live Scallops Found
2015
87
28
101
0
2016
96
31
111
1
2017
5
4
16
0
2018
20
7
32
0
2019
13
6
20
0
2020
5
2
16
1
2021
17
6
24
0
2022
74
22
87
2
2023
72
16
77
4
TOTAL
317
407
8
MEAN
35
14
45
0.4
To date we are averaging 35 volunteers each event, surveying 14 of the 55 possible grids (25%). We are averaging 45 transects each year (4500 m2), have logged 407 transects (40,700 m2) and have recorded 8 live scallops (< than one a year).
Discussion
Based on the results since 2016 this year was a record year for live scallops. Whether they are coming back on their own is still to be seen. Being mass spawners, bay scallop need high densities in order to reproduce successfully, and these numbers do not support that. The data, and comments from volunteers, suggest that the grasses look good and dense. Thalassia, a favorite of the bay scallop, appear to be becoming more abundant. This is a good sign.
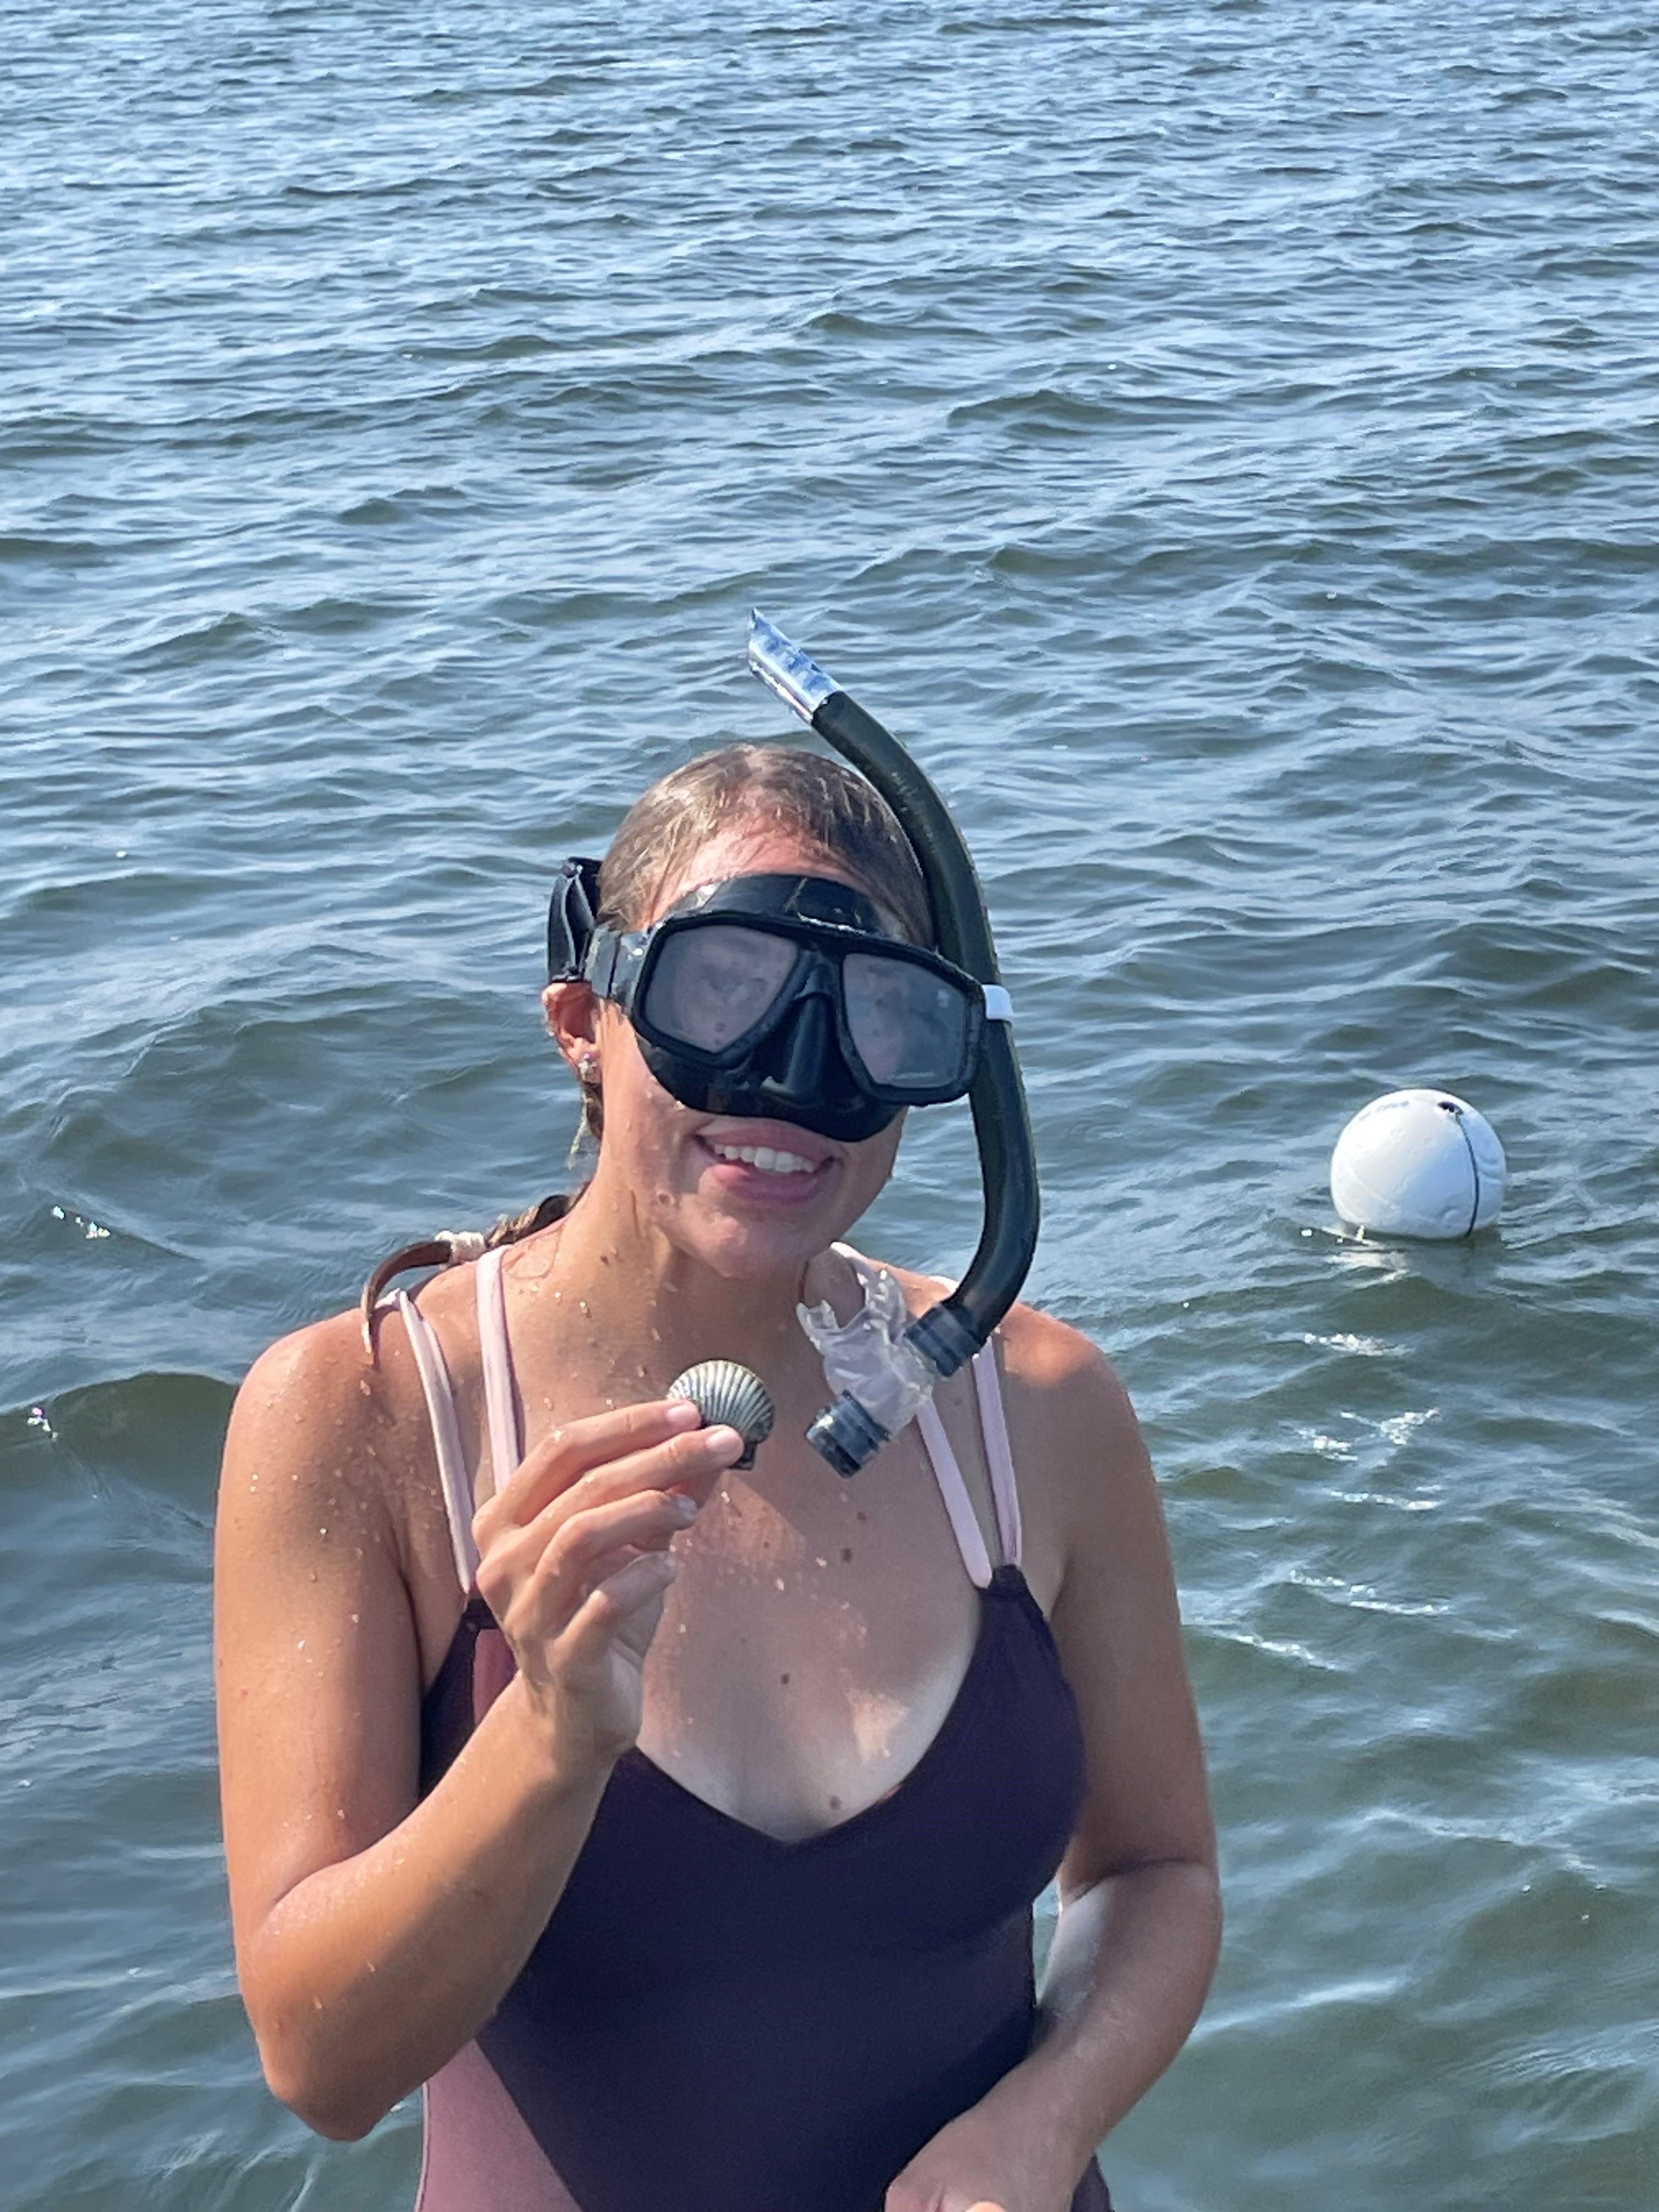
Though small and few, bay scallops are trying to hold on in Pensacola Bay.
Photo: Gina Hertz
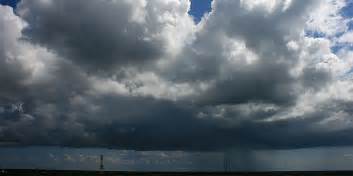
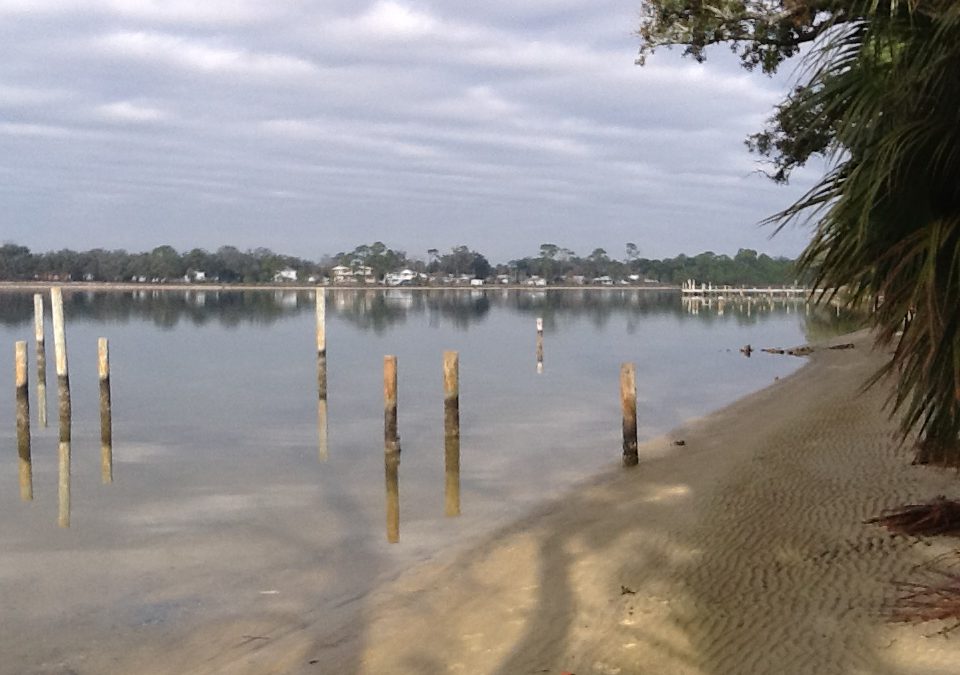
Historically the average rainfall in the Pensacola Bay is around 60 inches per year. However, over the past 10 years that has increased to slightly more than 75 inches per year (see Table 1). The frequency of those levels over the past decade shows that most are between 60 – 80 inches but there have been two years with over 90 inches reported. In the last decade, nine of the 10 years had total rainfall above the historic mean for the area.
Along with the increase in rainfall has come an increase in development. This increase reduces the amount of the excess rainfall to percolate into the ground and recharge our aquifer. Instead, it is directed into stormwater projects to reduce flooding in the community. Some of this stormwater will eventually find its way to the estuary or the tributaries that feed the estuary. The question is whether this increase in freshwater run-off is enough to decrease the salinity of the bay system.
There are several restoration projects ongoing within the bay. Two of them Sea Grant has been involved in. One is monitoring the status of seagrass and the other is status of bay scallops. The species of seagrass in lower bay, such as turtle grass (Thalassia testudnium) and shoal grass (Halodule wrightii) require salinities to be at, or above, 20 parts per thousand. Bay scallops depend on turtle grass for their life cycle and also require the salinity at, or above, 20 ppt.
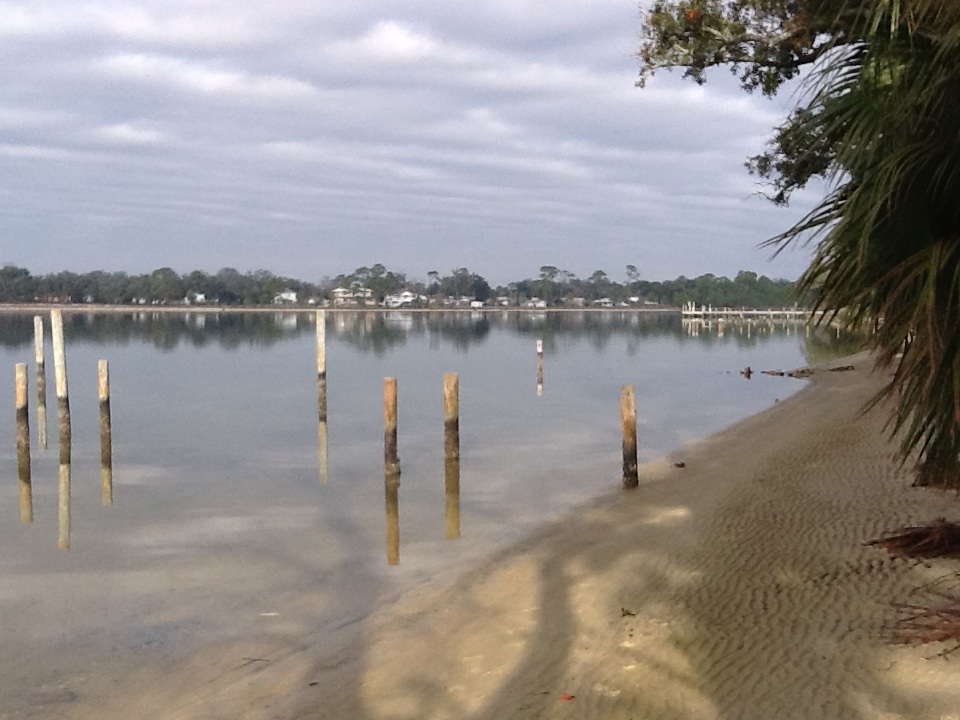
Citizen volunteers are assisting Florida Sea Grant by monitoring the salinity of the bay on a weekly basis.
Volunteers are trained to use a refractometer and asked to monitor their assigned beach once a week, reporting their results to Sea Grant and calibrating their instrument once a month.
We are asking our volunteers to continue to monitor until they have logged 100 readings.
Currently 21 locations around the bay are being monitored. Nine are in the Big Lagoon area, eight near downtown Pensacola, and four near Pensacola Beach.
12 of these sites are actively being monitored at this time, 3 have reached the 100-reading mark, and 6 have not been monitored in some time.
Note:
Our volunteers are monitoring the water at the surface near the beach due to ease of access. The seagrass and scallops we are interested in grow at the bottom and at depth. However, saline water is more dense than fresh, and it is assumed that the water on the bottom at depth is saltier than the data being found at the surface near the beach.
There are other agencies who are monitoring salinity at depth.
Data for Each Site as of the end of 2022
Table 3 – Salinity Mean, Median, and Mode from Around the Pensacola Bay Area
Water Body
No. of samples logged
Mean
Median
Mode
Bayou Chico
7
10
5
5
Bayou Grande
29
20
21
21
Bayou Texar
10
8
7
ND
Big Lagoon
15
23
20
20
Big Lagoon SP
51
16
15
14
Big Sabine
64
22
22
22
Bruce Beach
1
18
18
ND
Ft. McRee
4
21
21
19
Galvez Landing
65
22
23
22
Hawkshaw
24
16
15
15
Kees Bayou
100
20
21
14
Little Sabine
100
23
23
25
Lower Perdido Bay
100
16
15
20
Navy Point SE
21
17
17
20
Navy Point SW
22
16
17
10
Old River
36
23
23
25
Oriole Beach
51
25
25
25
Perdido Key SP
33
21
20
15
Sanders Beach
70
18
18
18
Siguenza Cove
11
22
21
21
Shoreline Park
10
25
25
25
TOTAL
824
19
19
19
Table 4 – Salinity Mean, Median, and Mode from the Big Lagoon Area
Water Body
No. of samples logged
Mean
Median
Mode
Big Lagoon
15
23
20
20
Big Lagoon SP
51
16
15
14
Ft. McRee
4
21
21
19
Galvez Landing
65
22
23
22
Kees Bayou
100
20
21
14
Lower Perdido Bay
100
16
15
20
Old River
36
23
23
25
Perdido Key SP
33
21
20
15
Siguenza Cove
11
22
21
21
TOTAL
415
20
20
19
Table 5 – Salinity Mean, Median, and Mode for the Downtown Pensacola Area
Water Body
No. of samples logged
Mean
Median
Mode
Bayou Chico
7
10
5
5
Bayou Grande
29
20
21
21
Bayou Texar
10
8
7
ND
Bruce Beach
1
18
18
ND
Hawkshaw
24
16
15
15
Navy Point SE
21
17
17
20
Navy Point SW
22
16
17
10
Sanders Beach
70
18
18
18
TOTAL
184
15
15
15
Table 6 – Salinity Mean, Median, Mode for the Pensacola Beach Area
Water Body
No. of samples logged
Mean
Median
Mode
Big Sabine
64
22
22
22
Little Sabine
100
23
23
25
Oriole Beach
51
25
25
25
Shoreline Park
10
25
25
25
TOTAL
225
24
24
24
Discussion
A glance at Table 3 will show all 21 bodies of water that have been involved in this project. Three of those, Lower Perdido Bay, Kees Bayou, and Little Sabine have reached the 100-reading mark.
For Lower Perdido Bay the mean salinity was 16 ppt ±5. The highest reading was 24 ppt and the lowest was 6 ppt. The median was 15 ppt and the mode was 20. These data suggest that this body of water would not support turtle grass or bay scallops, but it is not believed that historically lower Perdido Bay did. We would like to thank Bob Jackson for his effort on collecting these data.
For Kees Bayou the mean salinity was 20 ppt ±6. The highest reading was 31 ppt and the lowest was 5 ppt. The median was 21 ppt and the mode was 14 ppt. These data suggest that turtle grass and bay scallops could survive here. It is noted that Kees Bayou is a shallow basin located next to a highway and during intense rainfall the salinities could drop drastically to cause a decline of both target species. We would like to thank Marty Goodman for his effort on collecting these data.
For Little Sabine the mean salinity was 23 ppt ±4. The highest reading was 30 ppt and the lowest was 12 ppt. The median was 23 ppt and the mode was 25 ppt. These data also suggest that both turtle grass and scallops could survive in Little Sabine, and there are records that scallops were once there. Turtle grass exist there now. We would like to thank Betsy Walker and Liz Hewson for their efforts on collecting these data.
The Big Lagoon Area
These data suggest that most of the sampled areas could, in fact, support both turtle grass and scallops, and there are records that they have supported both in relatively recent years. One note of interest is the lower salinities near Big Lagoon State Park. Most of the sites have data at 20 ppt or higher – except Lower Perdido Bay (understandable) but we are not sure why the numbers are below 20 ppt. at the state park. We would like to thank our active volunteers in the Big Lagoon area Jessica Bickell, Glenn Conrad, John Williams, and Emogene Johnson for their effort in collecting these data.
The Downtown Pensacola Area
These data suggest that this area of the bay would not support turtle grass nor bay scallops. But historically they did not. Seagrass does exist in these bodies of water but much of it is widgeon grass (Ruppia maritima) which can tolerate lower salinities. We would like to thank our active volunteers for the downtown area Tim Richardson and Glenn Conrad for their efforts in collecting these data.
The Pensacola Beach Area
These data suggest that Santa Rosa Sound could support, and do support, populations of turtle grass and scallops. During our scallop searches conducted in July we have found one live scallop in Big Lagoon and two in Santa Rosa Sound over the last six years. Again, these data suggests that all of these locations could do so with the highest salinities in the bay area based on these data. We would like to thank our active volunteers in the Pensacola Beach area Ann Livingston, Gina and Ingo Hertz, and Holly Forrester for their efforts in collecting these data.
Though we have not reached the targeted 100-readings for most of our sites, these early results suggest the rainfall may not be lowering the salinity. We will continue to monitor until we do reach the 100-reading for each and have a better idea.
We are seeking new volunteers. The water bodies needing help are Bayou Chico, Bayou Texar, Big Lagoon, Bruce Beach, and Sanders Beach. If you are interested contact me at roc1@ufl.edu
When I joined Florida Sea Grant in 2012 my advisory committee told me water quality was one of their major concerns. Makes sense really. Some members were from the tourism and boating industry. Some were from commercial and recreational fishing. Others were homeowners. ALL had concerns. ALL depended on clean water for the success of their business and for the quality of their own lives. It is a big concern.
Since that time, we have been training volunteers to monitor nutrients and salinity. We just recently added harmful algae monitoring and we report fecal bacteria data collect by the Department of Health. All to (a) get people out there so they can see what is happening themselves, and (b) provide information we share with the members of the community.
Local bayous in the Pensacola Bay area have experienced fish kills due excessive nutrients in the past. The Lakewatch Program trains volunteers to monitor nutrients in these waterways today.
Photo: Rick O’Connor
Lakewatch is a program where volunteers use their boats to monitor nutrients at three locations in a particular waterway within the bay system. Excessive nitrogen and phosphorus can lead to agal blooms, which in themselves can be a problem, just ask the folks in south Florida. But when these organisms die, they form dense mats of organic matter that sink and decay. The decaying process is oxygen demanding and the dissolved oxygen in the system decreases to levels where fish kills can happen. Many may remember the large fish kills our bayous experienced in the 1960s and 1970s.
Their samples are analyzed by the Lakewatch lab in Gainesville for total nitrogen, total phosphorus, and total chlorophyll a (which is a proxy for phytoplankton in the water column – algae). The volunteers also measure the water clarity using a secchi disk. Water clarity decreases with increase algal blooms and this can be a problem for submerged seagrasses. The lab provides us with the salinity when they analyze the samples.
Below is a table of data since sampling began in 2007. However, some locations are JUST getting started.
Table 1. Nutrients in the Pensacola Bay Area
All values are the geometric means.
Body of Water
Total Phosphorus (µg/L)
Total Nitrogen (µg/L)
Total Chlorophyll a(µg/L)
Water Clarity (Feet)
Salinity (parts per thousand)
Pensacola Bay
Station 1
Station 2
15
275
5
7.3
Station 3
Bayou Texar
Station 1
17
803
6
3.5
8
Station 2
18
673
8
3.8
10
Station 3
17
592
8
3.8
10
Bayou Chico
Station 1
29
533
16
3.2
7
Station 2
27
548
13
1.0
7
Station 3
22
353
8
4.1
7
Bayou Grande
Station 1
15
311
4
4.5
14
Station 2
15
290
4
5.5
15
Station 3
17
312
5
5.4
16
Big Lagoon
Station 1
13
252
3
8.9
18
Station 2
Station 3
12
213
2
10.0
8
Lower Perdido Bay
Station 1
15
327
5
6.4
15
Station 2
15
324
5
5.4
15
Station 3
15
328
5
5.8
15
Pensacola Bay was only sampled for one year (2019-2020). These three stations extend from the near the mouth of Bayou Texar, along the east side of the 3-Mile Bridge to the middle where the “hill” is in the bridge. This site is open and in need a volunteer. If interested, contact me. You will notice as you glance at the data table there is very little information on this location. The data provided in this table is the geometric means over the period of monitoring. Only data from station #2 was enough to report on and the values for nutrients are on the lower side. The water clarity is one of the better locations at 7.3 feet and there is insufficient data to report on the salinity.
Again, this site was not monitored for long and there is not enough to see short- or long-term trends here. But based on the little information provided, there does not appear to be nutrient issue here.
Bayou Texar has been monitored the longest in this Lakewatch program. One volunteer monitored from 2000-2002 before stopping. A second volunteer began in 2007 and monitored until 2013 when a third volunteer took on these sites. There is a current need for a new volunteer to continue monitoring this location beginning in 2023 – contact me if interested. The Lakewatch data is provided in two sections, one covering the 2000-2002 monitoring period, and the other the 2007-present. The data provided in this report are those collected between 2007-present. The sample stations run north to south with #3 being closest to the mouth near Cervantes Bridge.
A quick glance at the data shows significantly high nitrogen values, particularly at station #1 (near the 12th Avenue Bridge). Most bodies of water monitored in this project have nitrogen values running between 200-400 µg/L (Bayou Chico being an exception – more on that next). The total nitrogen in Bayou Texar runs between 600-800 µg/L – MUCH higher than the others. Though the total nitrogen is higher, the total phosphorus and chlorophyll numbers are not much above other locations (again, Bayou Chico is an exception). Water clarity, between 3-4 feet, is low for most locations. The salinity is also lower than most.
Since 2007 there have been significant improvements in total phosphorus at stations #2 and #3 – meaning improvements as you go from the 12th Avenue Bridge to the Cervantes Street Bridge. Water clarity has significantly improved at all locations. This is all good news. However, the total nitrogen numbers have not changed significantly over that time and are much higher than other bodies of water sampled. When you look at the number of health advisories issued for Bayou Texar it tends to be around 30% of the samples collected. Much better than Bayou Chico but higher than other bodies of water monitored by the Health Department.
Bayou Texar does have a total nitrogen problem and the closer you get to the 12th Avenue Bridge, the worse it becomes. Sources of nitrogen can come from leaf litter, fertilizers, animal waste, and leaky septic tanks, or sanitary sewage overflows. Identifing which source is the problem will be difficult. Some suggest the issues may be coming further upstream in Carpenters Creek. It is recommended that local residents and businesses along the creek and bayou use some of the management practices listed at the end of this report to help reduce this problem. There is a large effort currently to try and improve conditions in and around Carpenters Creek. Many of the properties along the bayou might consider the BMPs listed at the end of the report. Based on the chlorophyll data, Bayou Texar is border lined eutrophic (excessive nutrients). Reduction of nitrogen would help.
There are records of seagrass growing in Bayou Texar as well as active ospreys, dolphins, and even manatee sightings.
Bayou Chico has been sampled since 2014. The stations run from west to east with station 3 being the closest to the mouth of the bayou (near the bridge). As you glance across the numbers you will notice the nutrient data is slightly higher than the other bodies of water. The other bodies of water have total phosphorus between 10-20 µg/L. However, Bayou Chico has the highest values running between 20-30 µg/L. Other than Bayou Texar, the total nitrogen values are between 200-400 µg/L. Though lower than Bayou Texar, Bayou Chico is high running between 300-600 µg/L. The same is true for the third nutrient parameter chlorophyll. At most locations, excluding again Bayou Texar, the chlorophyll values are less than 5 µg/L. Bayou Chico has the highest values running between 8-16 µg/L. Along with Bayou Texar it has the lowest water clarity between 3-4 feet and has the freshest water in our sample locations with salinities running at 7 ppt.
Though most parameters have improved slightly since 2014, there have been no significant changes in water quality. There has been a slight increase in nitrogen at two stations – but again, not significant.
These values do classify Bayou Chico as eutrophic (nutrient excessive). The lower water clarity and salinity suggest more freshwater input – possibly from stormwater runoff. The low water clarity could be from small algal blooms but could also be attributed to shore-based sediments entering the system via stormwater runoff. These excessive nutrients could be linked to the excessive health advisories issued here due to fecal bacteria entering the waters. Based on data from the Department of Health, over the years Bayou Chico has required a health advisory be issued 50-60% of the time they sampled – significantly more than the other bodies of water monitored. Since 2010, this is the only body of water currently being monitored that has experienced a large fish kill – though this fish kill was attributed excessive warm water (which, like algal blooms, is oxygen demanding). It is a body of water that has seen problems for decades and is the only body of water in our area that requires a state Basin Area Management Plan (BMAP).
There are records of seagrass growing in Bayou Chico – and this is good news. There are also reports of ospreys, dolphins, and manatee sightings here as well. The state has deployed oyster reefs to help remove nutrients. There is an invasive species present (giant salvinia – Salvinia molesta) that is of concern. The state is currently managing this plant. It prefers high nutrient, low energy (calm) freshwater water. The salinities of the other bayous may be too high for this plant, but we are trying to education residents about the situation and help monitor/remove it if it appears. You can contact the county extension office for more information on this plant if interested.
Bayou Grande has been monitored since 2012. The stations also run west to east with station #3 closest to the mouth near NAS main side bridge. As you glance across the numbers you will notice values at, or below, average for the areas sampled. Total phosphorus runs close to 15 µg/L. Total nitrogen values run close to 300 µg/L. Total chlorophylls are some of the lowest running close to 4 µg/L. Water clarity is the clearest of all three of the bayous running between 4.5-6 feet and is also the saltiest with salinities running around 15 ppt.
All though all parameters have shown improvement in water quality since 2012, most are not significant improvements. The one exception is water clarity at station #1 – it has shown significant improvement during this time.
In general Bayou Grande is in the best shape of the three bayous and compares well with the open bay stations being monitored. It is classified as mesotrophic – meaning nutrients are middle range (where you expect an estuary to be). The health advisory reports are usually between 20-30% of the samples taken and fish kills have not occurred here since we began monitoring. There have been improvements on septic to sewage conversions in these communities, as well as efforts to build living shorelines (which can help reduce nutrient runoff to the bayou coming directly from properties in lieu of storm drainpipes). It is also a larger bayou (hence its name) with less development along the southern shoreline. There are more efforts planned to try and improve sewage issues and in planting living shorelines using filter feeding oysters. Residents along Bayou Grande could also incorporate Florida Friendly Landscaping principals to help reduce nutrients further as well as incorporate clean boating practices. Information on these programs can be found at your county extension office.
Big Lagoon has only been monitored since 2020. Thus, there are gaps in the data table where there are insufficient data to calculate a geometric mean. The sample stations run from east to west with #1 being closest to Ft. McRee and the mouth of the Pensacola Bay system itself. Glancing at the data where a geometric mean was able to be determined you will see that nutrient values are some of the lowest in the bay area. The total phosphorus runs between 12-13 µg/L, total nitrogen between 200-250 µg/L, and the total chlorophyll between 2-3 µg/L. The water clarity data are the clearest in the bay area, running from 9-10 feet. The salinity is interesting. At station #1 (near Ft. McRee) the geometric mean for salinity is 18 ppt, but at station #3 (near Big Lagoon State Park) it is only 8 ppt.
Since sampling only began two years ago, it has not been long enough to determine any long-term trends.
The chlorophyll numbers are actually low enough to classify Big Lagoon as oligotrophic (nutrient poor). This is unusual for an estuary, which are typically bodies of water with moderate amounts of nutrients due to natural runoff. But remember (a) Big Lagoon does not have a lot of natural runoff and (b) we have only been collecting samples there for two years.
The interesting thing about the salinity is how low it is. Station #3 (near Ft. McRee) is 18 ppt and being so close to the mouth of Pensacola Bay, and the Gulf of Mexico, you would expect this to be higher – maybe between 25-30 ppt. The fact that there are thick beds of turtle grass (Thalassia testdidnium) suggest that the actual mean is probably higher than the 18 ppt reported here. The opposite side of Big Lagoon is interesting as well. Station #3 reports a geometric mean of 8 ppt. This is equivalent to the upper end of Bayou Texar (near the 12th Avenue Bridge) and most of Bayou Chico. This too seems very low for this body of water. The Department of Health samples for fecal bacteria near Big Lagoon State Park and it does, at times, get high enough (> 70 colonies/100ml) for a high bacteria reading. DOH usually takes a second sample to confirm the reading and most often the second reading is lower, and a moderate classification is given for that week. That said health advisories have been given in this region, albeit less than 10% of the samples taken. All of this suggest that there may be some runoff issues at the west end of the Lagoon. Obviously more sampling is needed.
This body of water does support plenty of seagrass, ospreys, dolphins, and an increase in manatee reports. There are diamondback terrapins and horseshoe crabs both reported here as well. But it was also a location where bay scallops once thrived and no longer do. Scallop searches have been ongoing here for six years and only one live animal has been found. There are several possible reasons for their decline, decrease in salinity maybe one of them. Monitoring will continue. It is also a location where the state has measured a decline in seagrass – also concerning. Sea Grant is currently partnering with the University of West Florida to monitor both seagrass abundance and water quality within Big Lagoon.
Lower Perdido Bay has been monitored since 2014. The three stations run from south to north. Station #1 is near Innerarity Point and station #3 is near Tarkiln Bayou. Glancing across the numbers of the lower Perdido you will see that they are similar to most of the other bodies of water being monitored. The total phosphorus is 15 µg/L. The total nitrogen is between 320-330 µg/L. And the total chlorophyll is 5 µg/L classifying this area of Perdido Bay as mesotrophic. Being an open bay, the water clarity is higher, running between 5-6 feet, and the salinity is reported at 15 ppt. As with Big Lagoon, the salinity seems lower than one would expect but historic records suggest that Perdido Bay in general may have been lower than most other open bays. Historically the mouth of the bayou open and closed frequently giving the Spanish the reason to name it Perdido (“Lost Bay”). This closer may have made it more of a freshwater system – similar to the dune lakes of Walton County and the historic Choctawhatchee Bay – and may play a role in the lower salinity of Big Lagoon.
The trends over time show that most parameters have improved but not significantly. The one exception is total nitrogen. The total nitrogen in lower Perdido Bay has significantly decreased over the period Lakewatch has been monitoring – and this is good news.
Perdido Bay has had a history of poor water quality, but this is due more to industrial compounds being released through the tributary creeks. These compounds did cause other problems, including some species of fish altering sex, and whether these are still an issue cannot be determined by these data – this project is monitoring for nutrients. The nutrient driven algal blooms and fish kills found in the bayous 50 years ago were not as common in this body of water and these data suggest that the system is mesotrophic as most estuaries are. As with most of the other bodies of water, ospreys, dolphins, and manatees have all been recorded here. Seagrasses are present but being a less saline system than Big Lagoon and Santa Rosa Sound, the species composition is different and abundance is less. There have been efforts to survey for bay scallops in the lower portions of Pensacola Bay, but no efforts have been made in the lower Perdido due to salinities currently, and historically, not being high enough. Again, the lower salinity is thought to be more natural than from heavy development and urban runoff.
Summary
In summary, these data suggest that the nutrient problems area waterways experienced in 1960s and 1970s have improved. Algal blooms and fish kills are no longer common. But there still could be dissolved oxygen (DO) issues at the bottom of our bays and bayous that reduce biodiversity. This is not monitored by Lakewatch and we are not aware of any long term monitoring of DO to know how things have changed in the last 50 years.
Anecdotal reports suggest the coverage of seagrasses in these systems are improving. Though there are seagrasses in Big Lagoon, some reports suggest there has been a decline in recent decades. There is a current citizen science project entitled Eyes on Seagrass where Sea Grant and the University of West Florida train volunteers to monitor both coverage and species composition. Data from this project will presented in a separate report later in the year. There are also separate citizen science efforts monitoring the presence of bay scallops, horseshoe crabs, and diamondback terrapins in the bay area. Horseshoe crabs are being encountered more often, as are terrapins, but bay scallops seem to still be missing. As with the seagrass monitoring, these reports will be coming later this year.
There are still concerns with both Bayou Chico and Bayou Texar – these being the only two nutrient eutrophic systems in this monitoring project (based on chlorophyll data). Efforts to better understand the sources of nutrients, and enact better management practices, should be considered for these waterways. Things such as reducing fertilizer use, mitigating fertilizer runoff with living shorelines, converting from septic to sewers, better maintenance of septic systems, and reduction of sanitary sewage overflows are all actions that citizens can take now to help improve these waterways. For information on how to do these, contact your county extension office and we will be glad to assist.
Lakewatch is a citizen science volunteer supported by the University of Florida IFAS
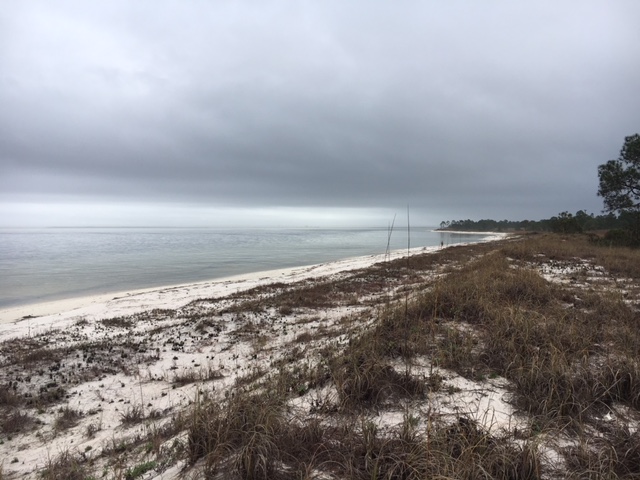
Our bodies come in contact, and produce, toxins every day. The production of toxins can result during simple metabolism of food. However, our bodies are designed with a system to rid us of these toxins. Toxins are processed by our immune system and removed via our kidneys. Some chemical compounds are structured in a way that they are not as easily removed, thus they accumulate in our bodies over time, often in fatty tissues, and sometimes they are toxic – this is bioaccumulation.
A view of Pensacola Bay from Santa Rosa Island. Photo: Rick O’Connor
Biomagnification takes it a step further. In many cases, the concentrations of bioaccumulating toxic substances in the water may be in low enough concentrations to have little effect on human health. They are ingested by small organisms in the environment, such as plankton or juvenile marine fish, and – again are at low concentrations. However, they are accumulated in their tissues and as the next level of the food chain begin to consume them – they too accumulate the toxic compounds in their tissues. Small fish consume large amounts of plankton and thus, large amounts of the toxins they have accumulated – increasing the concentration within their own tissues. This continues up the food chain to a point where, in the larger predators, the concentrations of these toxins have increased enough that they now pose a threat to human health – this is biomagnification.
The presence, and amount, of any one bioaccumulating compound varies with species, their size, their age, their gender, their life stage, whether they are mobile or not, their diet, and whether the sample included the skin (which is lipid heavy and a common location for accumulated toxins). In the Pensacola Bay System, about 30 species of marine plants and animals have been analyzed for the presence of these accumulating compounds.
Species collected from Pensacola Bay that were analyzed for contaminants
Plants
3 species of seagrass
1 species of seaweed
Colonized algal periphyton
Invertebrates
4 species of freshwater mussels
Eastern oyster
1 species of brackish water clams
1 species of barnacle
Several species of shrimp
Blue crab
Oyster drill (snail)
Vertebrates
2 species of catfish
5 species of scaienids (drums, croakers, trout)
Bluegill
Bluefish
Several species of flounder
2 species of jacks
Largemouth bass
Sheepshead
Striped mullet
Trace Metal Accumulation
Much of what has been studied in terms of metal accumulation has come from shellfish – particularly eastern oysters. Ten different metals have been found in oysters with zinc being in the highest concentration and lead the lowest. A 2005 study found that levels of arsenic, lead, and nickel collected from mussels collected at selected locations in the PBS were regionally high (meaning higher than other estuaries in the region). Another study (2003) found that levels of 16 different metals in shellfish were three times higher in Bayou Chico than samples from East Bay. A 1993 study found that organisms attached to pieces of treated wood in Santa Rosa Sound had elevated levels of metals. However, another study (2008) found low concentrations of metals in five species of fish collected in Escambia Bay near the I-10 Bridge.
The bioaccumulation potential within plants is less understood than animals. That said – concentrations within seagrass were relatively low when compared to the sediments they were growing in and periphytic algae attached to them.
Total Mercury Concentrations (ng/g – dry weight) for Local Marine Organisms
Lewis and Chaney (2008)
Range (ng/g)
Species
0-200
Sediments, seagrass, oysters
200 – 400
Periphytic algae
400 – 600
Mussels
600 – 800
Brackish clams, blue crabs
800 and higher
Fish
The above table shows biomagnification.
Comparing trace metal concentrations between Pensacola Bay and other Regional Estuaries
(USEPA unpublished data)
Pensacola Bay, Escambia Bay, Escambia River, Bayou Texar, Bayou Chico, Bayou Grande, Santa Rosa Sound
Grand Lagoon (Bay Co.), Mississippi Sound, Old River, Suwannee River, Withlacoochee River, Bay La Launch
Cadmium
Higher in PBS; highest in Bayou’s Grande and Texar
Chromium
Similar to other estuaries
Copper
Slightly elevated in Bayou Chico and Escambia River; highest in Withlacoochee
Total Mercury
Much higher in PBS; particularly in the bayous
Nickel
Lower in PBS
Lead
Higher in PBS; particularly in the bayous
Zinc
Higher in PBS; particularly in the bayous
There are higher concentrations of trace metals in PBS and particularly in the bayous.
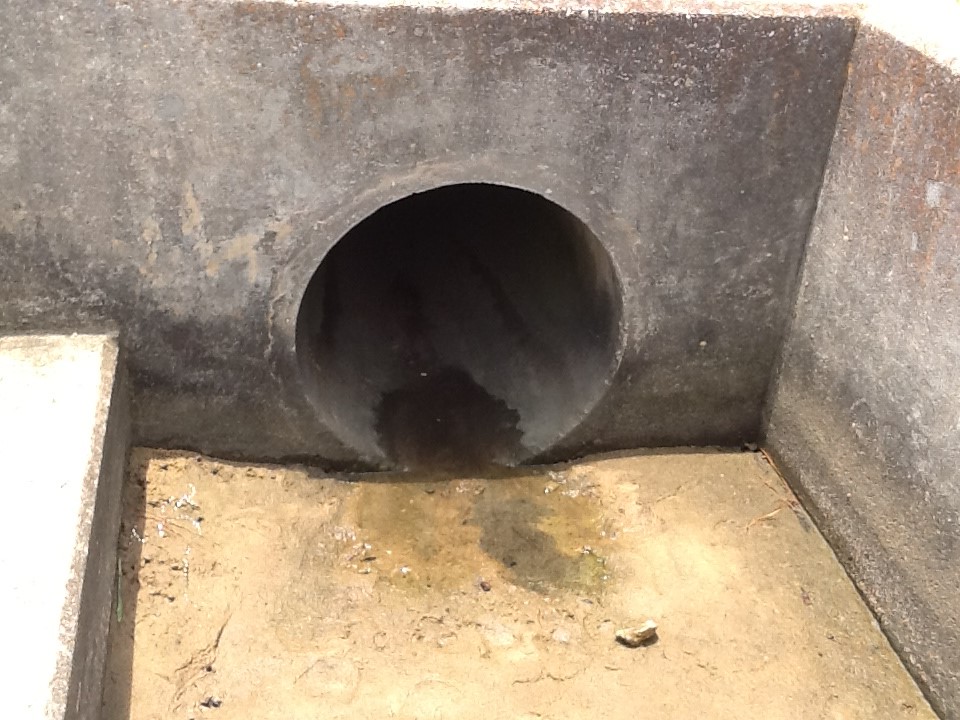
One of 39 stormwater drains into Bayou Texar. Photo: Rick O’Connor
Non-Nutrient Organic Chemicals
These are compounds such as PCBs, DDT, and PAHs; many are actually families of multiple forms of compounds. Information on the bioaccumulation of these compounds in PBS is less common than those of trace metals. However, this information is important since they have long half-lives and magnify within the food web.
That said – there are studies on these compounds that go back to the 1970’s. They looked at DDT, pesticides, and PAHs in oysters and croakers. One study (1986-96) found DDT concentrations in oysters at 60 ppb or less. A follow up study (2004-05) at those same locations found concentrations between 8-20 ppb. One study (2008) found the order of accumulating non-nutrient organic compounds with PAHs as the highest and dieldrin at the lowest. Downward trends were reported (2004-05) for many of these compounds including PAHs and PCBs.
Some of these compounds have entered the PBS via unlined ponds associated with on-land Superfund sites. Creosote and pentachlorophenol were stored for years in such ponds and have leached into area waters such as Bayou Chico and portions of upper Pensacola Bay. A study (1987-88) found oyster drills sampled in these areas had concentrations 10x higher than reference sites in other parts of the PBS.
So what can we do about this?
The compounds that are there – are there. Many of these trace metals are heavy and sink into the sediments. There occurrence within the food web has decreased over time and some have suggested the safest thing to do is to leave them where they are. No doubt, any project requiring sediment movement requires much review and permitting.
To try to remove these compounds would be extremely expensive – hence the Superfund Program. So if we cannot clean the sediments without a lot of labor and money, can we reduce the amount that enters the bay today?
Many of these compounds come from industrial processing of products we really want or need. Reduction of the production of some will be difficult, but there is much industry can do to reduce the chance of those compounds reaching our estuaries – and they are doing this. Point source pollution (direct discharge from an industry) has reduced significantly since the 1970’s. Non-point sources (indirect discharge from you and I) is still a problem. We can choose products that contain less (or none) of the compounds we discussed. Following an IPM program for dealing with household and lawn pests (see article on Florida Friendly Yards – https://blogs.ifas.ufl.edu/escambiaco/2018/06/08/restoring-the-health-of-pensacola-bay-what-can-you-do-to-help-a-florida-friendly-yard/) can help a lot. As can practices that reduce the amount of run-off reaching our bays. Reducing your use of lawn watering, using rain barrels, or rain gardens, and planting living shorelines (all mentioned in the FFY article) can certainly help.
Reference
Lewis, M.J., J.T. Kirschenfeld, T. Goodhart. 2016. Environmental Quality of the Pensacola Bay System: Retrospective Review for Future Resource Management and Rehabilitation. U.S. Environmental Protection Agency. Gulf Breeze FL. EPA/600/R-16/169.