by Rick O'Connor | Jan 12, 2026
Breeding is a major part of all animal life cycles, and this is no different for rattlesnakes. Like other reptiles there are separate sexes, and internal fertilization is the rule. For this to happen, during breeding season males must find the females and often must compete with other males for the right to breed.

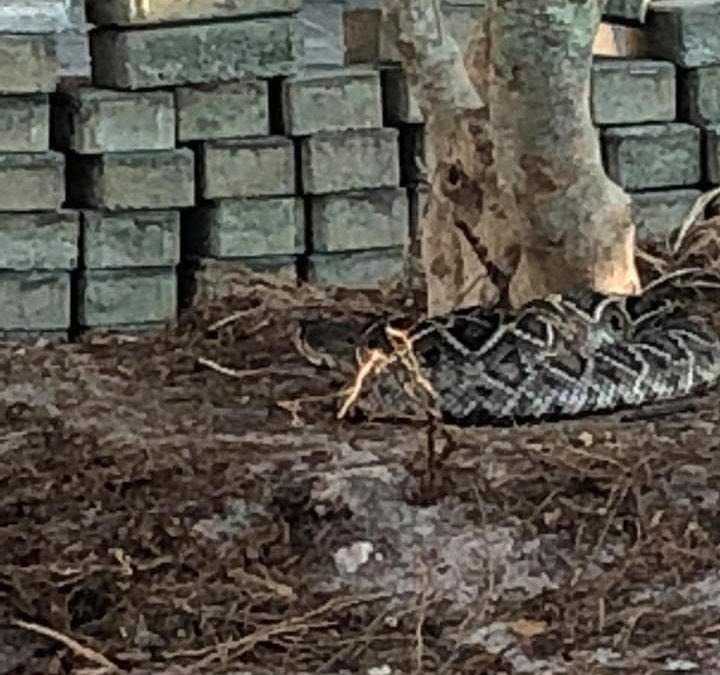
Diamondback rattlesnake near condominium construction site Pensacola Beach.
Photo: Sawyer Asmar
Breeding typically occurs in the spring shortly after emerging from hibernation. The females are hungry from hibernating, but they must gain fat to help feed the developing young. In reptiles’ embryonic development usually occurs within an egg. Within this egg the developing embryo is connected to a yolk sac from which they feed. There is another attached sac called the allantois which is where they go to the bathroom. When the yolk sac is gone and the allantois is full, it is time to hatch. It is the mother’s job to produce this egg and place it somewhere where it will remain warm and protected. But here the rattlesnakes are a bit different.
They differ in that though they produce eggs, they do not lay them in a nest. Rather she keeps the eggs within her body for warmth and protection. The covering of their eggs is more of a membrane rather than a shell. During this gestation period, the females will find a hiding place where she can still access sunlight. She will position herself so that her body remains warm for her offspring and then lie for 2-3 months until they are born. Though she may drink, she usually does not eat during the period.
The mother typically produces about dozen such eggs and they emerge in early fall. The young are venomous and innately understand how to survive. However, the mother often stays with them until they shed their first skin, at which time she will leave them on their own. She will then binge feed preparing for the upcoming hibernation period.
Some females will breed again in the fall. These will store the sperm during hibernation and fertilize their eggs in the spring. During both the spring and fall breeding periods the males will venture far and wide to find females. It is during these periods when many come into contact with people in strange places. The drive to find females will have them move into neighborhoods and human habitats that they would otherwise avoid.
Rattlesnakes live around 25 years. They become sexually mature in 6-7 years but do not breed every year. It has been estimated that only one of the 12 or so newborns will make it to the age of three. With the infrequent breeding of adults and low success rate of the offspring, rattlesnakes are susceptible to population declines when adults are removed. The loss of habitat, road kills, decline in prey, natural predation, and indiscriminate killing by human’s rattlesnake populations can suffer, and many are considered species of concern.
Next, we will look at predator/prey interactions with rattlesnakes.
References
Rubio, M. 2010. Rattlesnakes of the United States and Canada. ECO Herpetological Publishing & Distribution. Rodeo, New Mexico. pp. 307.
Gibbons, W., Dorcas, M. 2005. Snakes of the Southeast. The University of Georgia Press. Athens, Georgia. pp. 253.
Graham, S.P. 2018. American Snakes. John’s Hopkins University Press. Baltimore, Maryland. pp. 293.
by Rick O'Connor | Dec 29, 2025
All animals have a thermal range within which they can survive. For some it is very small range, for others it is amazingly large. Whatever their range is, they function best near the upper portion of it. “Warm blooded” animals (endotherms) have high metabolisms and generate warmth internally. Most have covering over their skin, fur or feathers, that assist with insulating them. “Cold blooded” animals (ectotherms) are the opposite. They have lower metabolisms, generate less internal heat, and most have covering over their skin (scales) that do not provide sufficient insulation. Thus, ectotherms must bask in the sun to get their body temperatures up to peak functioning levels. They will also hide in the shade or water to cool down. Rattlesnakes are ectotherms.
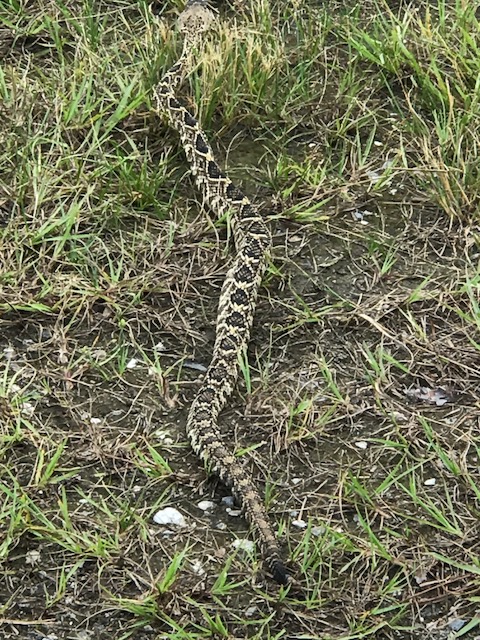
Eastern diamondback rattlesnake crawling near Ft. Pickens Campground.
Photo: Shelley Johnson
Generally, the coldest part of the day is just before dawn. If a snake was hunting at night, and many species do, they will venture out in the morning to find a sunny spot to warm up so they can complete the digestive process. They do need sun, but they need to avoid open spaces where predators can find them. Often, they will select spots near the edge of a wooded area, or edge of rocky outcrop, so they can dash in if trouble arrives. Snakes have been known to stretch out on roads where the pavement has been heated during the day. Unfortunately, many are hit by vehicles while doing this. As the day warms up, they will move into cooler spaces to avoid overheating. Rattlesnakes are more active, and prefer to hunt during the daylight hours, though evening movements do occur.
There are seasonal behavior changes to deal with thermoregulation. During winter, in regions where it gets cold (maybe even snows), rattlesnakes will hibernate. Hibernation involves gorging on food in the fall to store fat to feed off during the hibernation period. Next, they will find a good hiding spot – a rocky den, a cave, gopher tortoise burrow, hole beneath a tree stump – where they will be safe from predation until spring. Once in this hibernaculum, they will lower their breathing and heart rate and allow their body temperature to drop. They go into a state of torpor where they are basically shut down. Many rattlesnakes use the same hibernacula each year, finding it by their sense of smell. Some species will share this space with several others – literally a den of snakes.
In the spring, when the air temperatures reach 70°F, they will emerge and immediately seek food. In some locations the summers will become very hot and so feeding and reproduction are on their minds before it becomes too hot, and they have to hide again. It is during these feeding/mating forays that many people encounter them. During this period they may move during periods of the day, and into locations they might avoid otherwise.
If they live in locations where summer can be very hot, they will repeat this behavior to avoid overheating – this is called aestivation. Another problem with hot summers is dehydration. Aestivation is more spontaneous than hibernation.
The eastern diamondback rattlesnake, the one often found on our barrier islands, lives only in the warmer parts of the southeastern U.S. It does get cold in some parts of their range, but they are not common where it snows. However, it does get very hot where they live and so even though hibernation is part of their life cycle, aestivation is common.
Next, we will look at reproduction.
References
Rubio, M. 2010. Rattlesnakes of the United States and Canada. ECO Herpetological Publishing & Distribution. Rodeo, New Mexico. pp. 307.
Gibbons, W., Dorcas, M. 2005. Snakes of the Southeast. The University of Georgia Press. Athens, Georgia. pp. 253.
Graham, S.P. 2018. American Snakes. John’s Hopkins University Press. Baltimore, Maryland. pp. 293.
by Rick O'Connor | Dec 22, 2025
Though encounters with Eastern Diamondback Rattlesnakes are rare, bites from them are even more rare, and deaths from those bites almost nonexistent, it is worth discussing the issues and remedies of a bite.

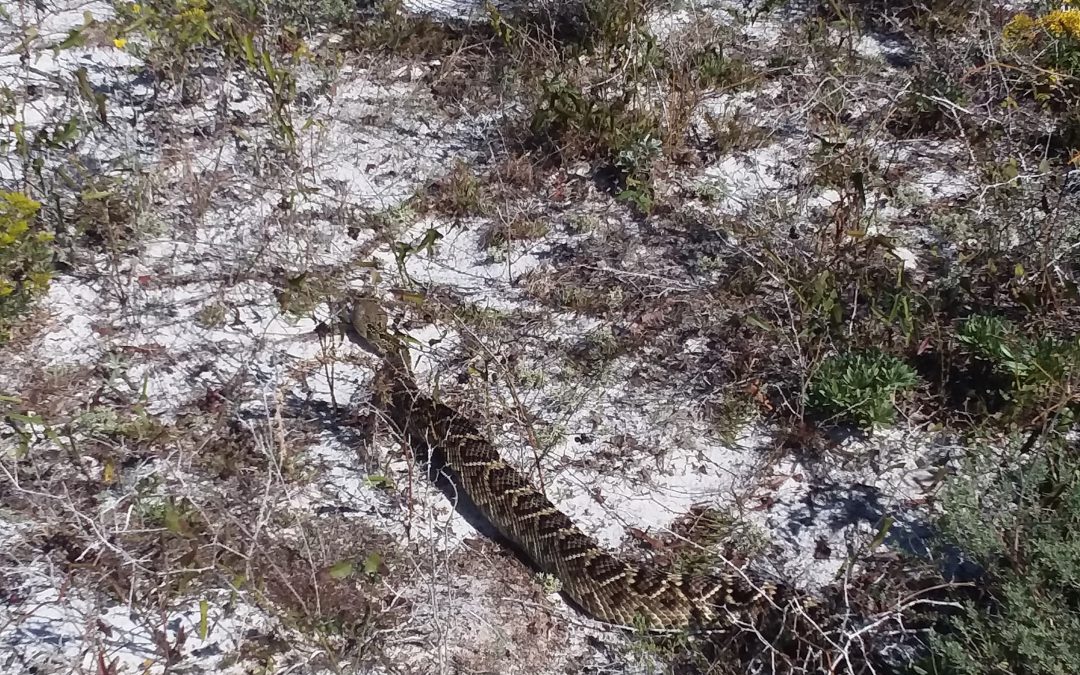
The eastern diamondback rattlesnake is a classic serpent found in xeric habitats like barrier islands and deserts. They can be found in all habitats on barrier islands.
Photo: Bob Pitts
About 8000 people are bitten by snakes each year in the U.S. and Canada. Most are on the hands of men who were engaging the snake. 95% of those bitten are trying to either catch or kill them. Annually less than 12 people die from some species of rattlesnake bite. Many are young or old, with a suppressed immune system or pre-existing medical condition. Many who die, for whatever reason, refused medical treatment.
Most lethal bites are those that reach the heart or brain. However most bites are on the extremities where tissue and nerve damage can occur, but death is less likely. One reason some may refuse medical treatment is cost. Antivenin treatments are expensive. Typical bites may require 4-6 vials and costs were between $1500-$3500/vial in 2010. Add to this the cost of hospital stays, and you can see how expensive it can be.
Another reason given as to why medical attention was not sought is the fact that many venomous snakes will give what is called a “dry bite”. As mentioned in earlier articles, snake venom is “expensive” for snakes to produce, and it is intended for prey – not predators. Rattlesnakes will often give what is called a “bluff bite” – striking with their head but not even opening their mouths. The injection of venom is a voluntary action by the snake, and they may choose to inject very little, if any, venom even if the fangs penetrate. It is believed that about 50% of the rattlesnakes are dry bites. That said, you should never gamble on whether you received venom or not, you should go to the hospital.
The venom itself is a cocktail of proteins, polypeptides, digestive enzymes, and other compounds. It is basically modified salvia – which already includes some digestive enzymes. Myotoxins are a large component of rattlesnake venom. Myotoxins attack muscle tissue, cause pain, discoloration, minor bleeding, and swelling. This can be accompanied by chills, sweats, dizziness, disorientation, tingling and numbness of mouth and tongue, metallic taste, vomiting, diarrhea, bloody stools, alternating blood pressure and heart rates, blurred vision, muscle spasms, and neurotoxins can paralyze diaphragm leading to asphyxiation.
To avoid envenomation problems wear closed-toed shoes when hiking in rattlesnake territory. Do not extend your hand into brushy/grassy areas – use your hiking stick instead. Watch stepping over, or sitting on, logs and stumps without close surveying. Do not touch dead rattlesnakes, if not dead long, they can still bite. Carry a cell phone.
What to do if bitten…
Call 911.
Call poison control if you have their number.
Get to a hospital.
Remove rings, watches, etc. – swelling will occur.
Keep bite at, or below, heart level.
Remain calm.
What NOT to do if bitten…
Do not cut the wound.
Do not suck venom out.
Do not apply a tourniquet.
Do not apply ice.
Do not drink alcohol.
Do not use electroshock treatment.
Envenomation from an eastern diamondback rattlesnake is a scary thing. However, there are many ways to avoid this problem, and there is basic treatment if you are. Remember few people are bitten, and very few die. Get medical attention as soon as you can.
References
Rubio, M. 2010. Rattlesnakes of the United States and Canada. ECO Herpetological Publishing & Distribution. Rodeo, New Mexico. pp. 307.
Gibbons, W., Dorcas, M. 2005. Snakes of the Southeast. The University of Georgia Press. Athens, Georgia. pp. 253.
Graham, S.P. 2018. American Snakes. John’s Hopkins University Press. Baltimore, Maryland. pp. 293.
by Rick O'Connor | Dec 15, 2025
Almost everyone has heard of red tides and know they periodically occur off the coast of Florida. The more frequent events occur off southwest Florida between Tampa and the Keys, but they have occurred in other parts of the state.
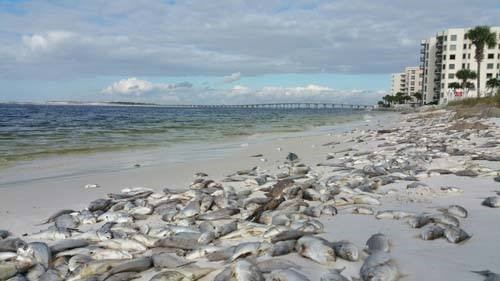
Dead fish line the beaches of Panama City during a red tide event in the past.
Photo: Randy Robinson
When they do occur in the panhandle, they seem to be more common on the east side – Bay, Gulf, and Franklin counties. This year there has been a rather large red tide event that has lingered several weeks now in this area. There have been multiple samples that have been reported as HIGH (1,000,000 cells or more / liter). Cells in this case is referring to the organism that causes red tide – Karenia brevis.

The dinoflagellate Karenia brevis.
Photo: Smithsonian Marine Station-Ft. Pierce FL
K. brevis is a microscopic plant that belongs to the dinoflagellate group. They occur naturally in Florida waters and when conditions are good – will begin to multiple and create a bloom. These blooms can be large enough to discolor the water – often making it a rusty/reddish color… hence the red tide. Good conditions would be those you would think plants like – plenty of sunlight, warm temperatures, plenty of nutrients. When the wind is lower the water moves less allowing them to concentrate into large patches producing “the tide”. These small plants can release a toxin, known as brevotoxin. Brevotoxins are neurotoxins that affect the transmission of nerve signals, which can lead to several internal complications and possibly death for marine life.
Humans and animals typically ingest or inhale brevotoxins during a large red tide event. Fish kills are a common phenomenon during large events, but marine mammals and sea turtles have also been killed. During the recent red tide event in the St. Joe area fish kills have been reported, as well as respiratory problems with humans. We now also can include diamondback terrapins as a victim.
Terrapins are smaller brackish water turtles found along the coast of Florida. At the time of this article, scientists with the US Geological Survey had logged 66 dead terrapins from the St. Joe area, all were females, and most were large females.
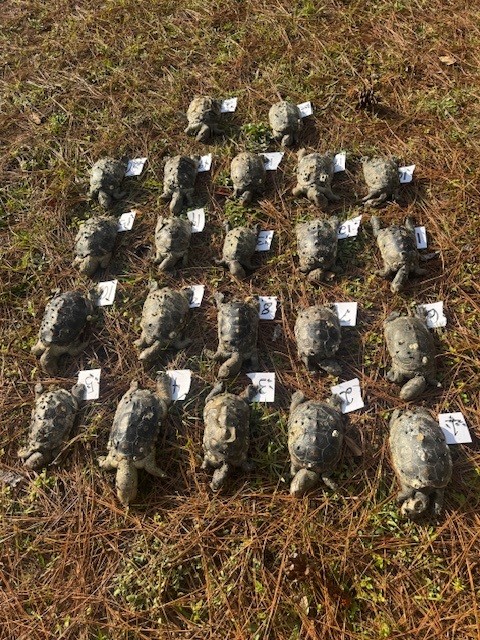
Diamondback terrapins lost during the recent red tide in St. Joe Bay.
Photo: Dan Catizone
At the time of this writing the tide in this area continues. High concentrations have been reported from Gulf, Bay, and Franklin counties. The most recent FWC report at the time of this article (December 5) red tide had been detected in 20 samples from the panhandle. Cell concentrations of >100,000/liter (medium-high) were reported from five of those. Background to medium concentrations were reported from Bay County. Background to low in Gulf and Franklin counties. Fish kills suspected to be related to the red tide occurred in Bay County but there were no reports of respiratory problems anywhere at that time.
Red tides seem to be more common in late summer and fall. NOAA believes the same climate pattern that has caused the drought, and no named tropical storms to hit Florida, may be the cause of the current patterns holding the red tide near the St. Joe area. Concentrations SEEM to be declining. Hopefully this one will not last much longer.
by Rick O'Connor | Dec 15, 2025
As many of you know, Escambia County Extension logs snakes people encounter when out and about during their day. We do not send people out to look for them but rather log those that people encounter when doing their normal activity. The objective of this project is to educate the public about which snakes people typically encounter, when they encounter them, and where.
The number of reports was down in 2025. We are not sure whether this was due to fewer people reporting, or whether there were fewer snakes encountered. Some who regularly report have told me they have not seen as many snakes this year. If this is the case it could be due to the snow event we had in the winter, the intense heat of this past summer, and the drought we have witnessed this summer/fall. We are not sure.
Of the 40 known species that inhabit the Pensacola Bay area – 19 were encountered this year. This compares to other years as follows –
| Year |
No. of Species Encountered |
| 2022 |
21 |
| 2023 |
24 |
| 2024 |
21 |
| 2025 |
19 |
Based on this people typically encounter about 50% of the species that live here. This year we were slightly below that at 47%.
Broken down by size classes we have the following for 2025…
| Size class |
No. of species known |
No. of species encountered |
Most common |
| Small (<12”) |
7 |
3 |
Florida Red-bellied Pine woods snake |
| Medium (12-24”) |
8 |
5 |
Eastern ribbon snake |
| Large (>24”) |
7 |
5 |
Southern black racer |
| Water Snakes |
13 |
2 |
Banded water snake |
| Venomous |
4 |
3 |
Cottonmouth |
| Non-native |
1 |
1 |
Brahminy blind snake |
| TOTAL |
40 |
19 |
Ribbon snake Southern black racer |
Small Snakes
First, small snakes are small; thus, more difficult to see. Most are encountered in gardens and landscaping. They are mostly nocturnal. This year the most common were both the Florida red-bellied snake and the Pine woods snake (both had 3 encounters). When compared to previous years…
| Year |
Most common small snake encountered |
| 2022 |
Southern ring-necked snake (3) |
| 2023 |
Rough earth snake (2) |
| 2024 |
Southern ring-necked snake (5) |
| 2025 |
Pine woods snake, Florida red-bellied snake (3) |
Medium Snakes
Some species in this group are the most frequently encountered snakes by residents. Like small snakes, most are encountered in gardens and landscaping. This year the Eastern ribbon snake. Not only was it the most encountered medium sized snake, but it also tied for the most common snake encountered all year. As you can see from the numbers below, this snake was encountered more frequently this year than others in the past.
| Year |
Most common medium snake encountered |
| 2022 |
Eastern ribbon snake (13) |
| 2023 |
Eastern garter snake (17) |
| 2024 |
Eastern garter snake (15) |
| 2025 |
Eastern ribbon snake (23) |
Large Snakes
There are 7 species of large snakes in the bay area and between 5-6 are encountered every year. Most likely this is because they are large, and easier to see. This year, like most years, the most encountered species is the Southern black racer. This snake does not mind humans and is often found in our neighborhoods and common in public areas as well. As you can see below, this is by far the most commonly encountered large snake and is one of the top three most common snakes encountered each year. This is a very common snake.
| Year |
Most common large snake encountered |
| 2022 |
Southern black racer (21) |
| 2023 |
Southern black racer (35) |
| 2024 |
Southern black racer (28) |
| 2025 |
Southern black racer (23) |
Water Snakes
There are more species of water snakes (13) than any other group. But they are some of the most infrequent snakes encountered in our area. This is most likely because several species only inhabit wetland/riverine systems where few residents venture. Other than the banded water snake, most other encounters have been reported by fishermen fishing on our rivers. This year, as every year, the Banded water snake was the most frequently encountered water snake. This is one of the top three most frequently encountered snakes each year. This is a very common snake here.
| Year |
Most common water snake encountered |
| 2022 |
Banded water snake (3) |
| 2023 |
Banded water snake (26) |
| 2024 |
Banded water snake (22) |
| 2025 |
Banded water snake (18) |
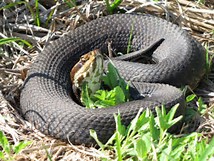
Venomous Snakes
There are only six venomous snakes reported in all of Florida. That is six out of a possible 46-48 species/subspecies (depending on which guidebook you use). All six have been reported in the Florida panhandle. Two of them only in the Florida panhandle – and they are both rare here; those being the copperhead and the timber rattlesnake. So actually, only four of the six venomous snakes have a good chance of being encountered: those being the cottonmouth, eastern diamondback rattlesnake, pygmy rattlesnake, and the eastern coral snake. Each year at least three of these are encountered. In 2023 all four were. Though each species has been encountered, other than the cottonmouth, the others are not encountered frequently. Encounters with the eastern coral snakes are particularly rare. That is not to say they are not common here, they are just not encountered very often, and that is fine with most people. Like the previous years, the most frequently encountered venomous snake is the Cottonmouth. Not only is the most frequent venomous snake, but it is also one of the top three most frequently encountered snakes overall. Cottonmouths are quite common here. The reason we may encounter it more often is because of its love of water – and most of us live near some source of water. The rattlesnakes prefer high dry semi-opened woodlands away from people. Coral snakes like more dense wooded areas; and almost every encounter of this snake has been in the Gulf Breeze area. However, they are found throughout the bay area.
| Year |
Most common venomous snake encountered |
| 2022 |
Cottonmouth (15) |
| 2023 |
Cottonmouth (52) |
| 2024 |
Cottonmouth (38) |
| 2025 |
Cottonmouth (21) |
Non-native Snakes
There is only one reported non-native snake in the Pensacola Bay area; the Brahminy blind snake – also known as the “flowerpot snake”. This Asian snake is about the length and diameter of a toothpick. It is blue to gray in color, and the tiny black eyes are barely visible. It is, for the most part, blind, and does not seem to be invasive. Most who encounter this snake are gardening or working in landscaping. I have them in my yard, and they are pretty common. Most who first see it will confuse it with a worm, until you notice the scaled body – then you know you are not dealing with a worm.
| Year |
# of Brahminy blind snakes encountered |
| 2022 |
0 |
| 2023 |
5 |
| 2024 |
2 |
| 2025 |
2 |
Number of Encounters by Species by Year
| Species |
2022 |
2023 |
2024 |
2025 |
TOTAL |
| Rough earth snake |
|
2 |
2 |
|
4 |
| Smooth earth snake |
|
|
|
1 |
1 |
| Marsh brown snake |
|
|
|
|
|
| Florida red-bellied snake |
1 |
5 |
4 |
3 |
13 |
| Southeastern crowned snake |
|
1 |
1 |
|
2 |
| Pine woods snake |
2 |
2 |
|
3 |
7 |
| Southern ring-necked snake |
3 |
5 |
1 |
|
9 |
| Scarlet snake |
|
3 |
1 |
1 |
5 |
| Rough green snake |
1 |
1 |
3 |
2 |
7 |
| Eastern ribbon snake |
13 |
10 |
9 |
23 |
55 |
| Eastern garter snake |
3 |
17 |
15 |
5 |
40 |
| Eastern hognose |
1 |
2 |
|
1 |
4 |
| Southern hognose snake |
|
|
|
|
|
| Mole kingsnake |
|
|
|
|
|
| Scarlet kingsnake |
|
|
1 |
|
1 |
| Eastern kingsnake |
1 |
1 |
2 |
2 |
6 |
| Florida pine snake |
|
2 |
|
|
2 |
| Gray rat snake |
3 |
9 |
11 |
7 |
30 |
| Corn snake |
3 |
7 |
5 |
6 |
21 |
| Southern black racer |
21 |
35 |
28 |
23 |
107 |
| Eastern coachwhip |
5 |
12 |
17 |
4 |
38 |
| Eastern indigo snake |
|
|
|
|
|
| Black swamp snake |
1 |
|
|
|
1 |
| Glossy crayfish snake |
1 |
|
|
|
1 |
| Queen snake |
|
|
|
|
|
| Midland water snake |
1 |
|
|
|
1 |
| Banded water snake |
3 |
26 |
22 |
18 |
69 |
| Gulf salt marsh snake |
|
3 |
2 |
|
5 |
| Yellow bellied water snake |
|
|
|
|
|
| Diamondback water snake |
|
|
|
1 |
1 |
| Brown water snake |
2 |
4 |
|
|
6 |
| Eastern green water snake |
|
3 |
1 |
|
4 |
| Western green water snake |
1 |
|
|
|
1 |
| Eastern/Western mud snake |
|
|
|
|
|
| Rainbow snake |
|
|
|
|
|
| Copperhead |
|
|
|
|
|
| Cottonmouth |
15 |
52 |
38 |
21 |
126 |
| Timber rattlesnake |
|
|
|
|
|
| Eastern diamondback rattlesnake |
5 |
8 |
11 |
8 |
32 |
| Pygmy rattlesnake |
5 |
6 |
1 |
|
12 |
| Eastern coral snake |
|
1 |
|
2 |
3 |
| Brahminy blind snake |
|
5 |
1 |
2 |
8 |
| TOTAL |
91 |
222 |
176 |
133 |
622 |
Discussion
The first statement is that 30 of the 40 known species found in the area have been encountered at least once. That is 75%. Most are medium sized to large sized snakes. There are only two species that have been encountered 100+ times over the last four years; those are Cottonmouth (126) and the Southern black racer (107). These are followed by two snakes that have been encountered between 50-100 times; those are the Banded water snake (69) and Eastern ribbon snake (55).
Those encountered between 25-50 times include:
Eastern garter snake (40)
Eastern coachwhip (38)
Eastern diamondback rattlesnake (32)
Gray rat snake (30)
Those encountered between 10-25 times include:
Corn snake (20)
Florida red-bellied snake (13)
Pygmy rattlesnake (12)
Those encountered between 2-10 times include:
Southern ring-necked snake (9)
Brahminy blind snake (8)
Pine woods snake (7)
Rough green snake (7)
Eastern kingsnake (6)
Brown water snake (6)
Gulf salt marsh snake (5)
Scarlet snake (5)
Rough earth snake (4)
Eastern hognose (4)
Eastern green water snake (4)
Eastern coral snake (3)
Southeastern crowned snake (2)
Florida pine snake (2)
Some of these species have populations of concern, and it is good they have been seen.
Those only seen ONCE in four years include:
Smooth earth snake (1) question identification – could have been rough earth snake
Scarlet kingsnake (1)
Black swamp snake (1)
Glossy crayfish snake (1)
Midland water snake (1)
Diamondback water snake (1)
Western green water snake (1)
Most of these are water snakes that live in habitats which few people visit. Others are smaller and harder to find.
AND THEN THOSE SPECIES THAT HAVE YET TO BE ENCOUNTERED IN FOUR YEARS.
Marsh brown snake
Southern hognose snake1
Mole kingsnake
Eastern indigo snake1
Queen water snake
Yellow bellied water snake
Eastern/Western mud snake
Rainbow snake2
Copperhead3
Timber rattlesnake3
1 species that are currently listed, or species of concern, and are rare in general.
2 species considered rare and under consideration of listing.
3 species that are common further north, but not as much in Florida.
We would like to thank all of you who have reported encounters in the Pensacola Bay area to myself. If you would like to participate, or have any questions, please contact me at Rick O’Connor – roc1@ufl.edu.
