by Rick O'Connor | Jan 31, 2025
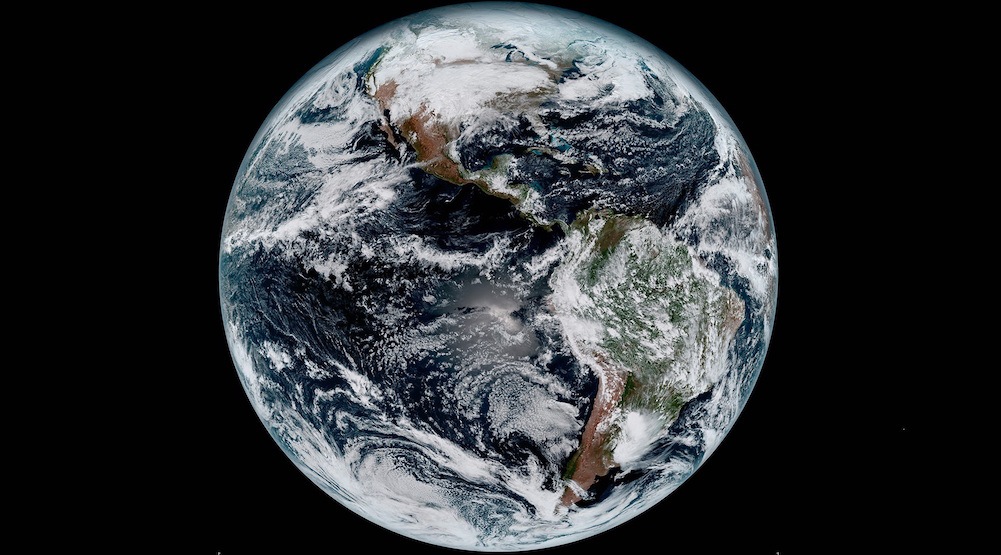
Each year I survey the public to determine what their needs are – what they are most concerned about – and where Extension might help. One of the primary functions of Extension is to provide local clientele with solutions to their needs – our mantra at UF IFAS Extension has been “Solutions for Your Life”. Most years the primary concern for Sea Grant locally has been water quality. Habitat restoration and invasive species also score high. These are all important issues. We want to maintain a high quality of life and addressing these concerns will help do that. And as important as these are, and they are, if someone were to ask me about my highest concern, it would be climate change. The issues above can be connected directly, or indirectly, to climate change.
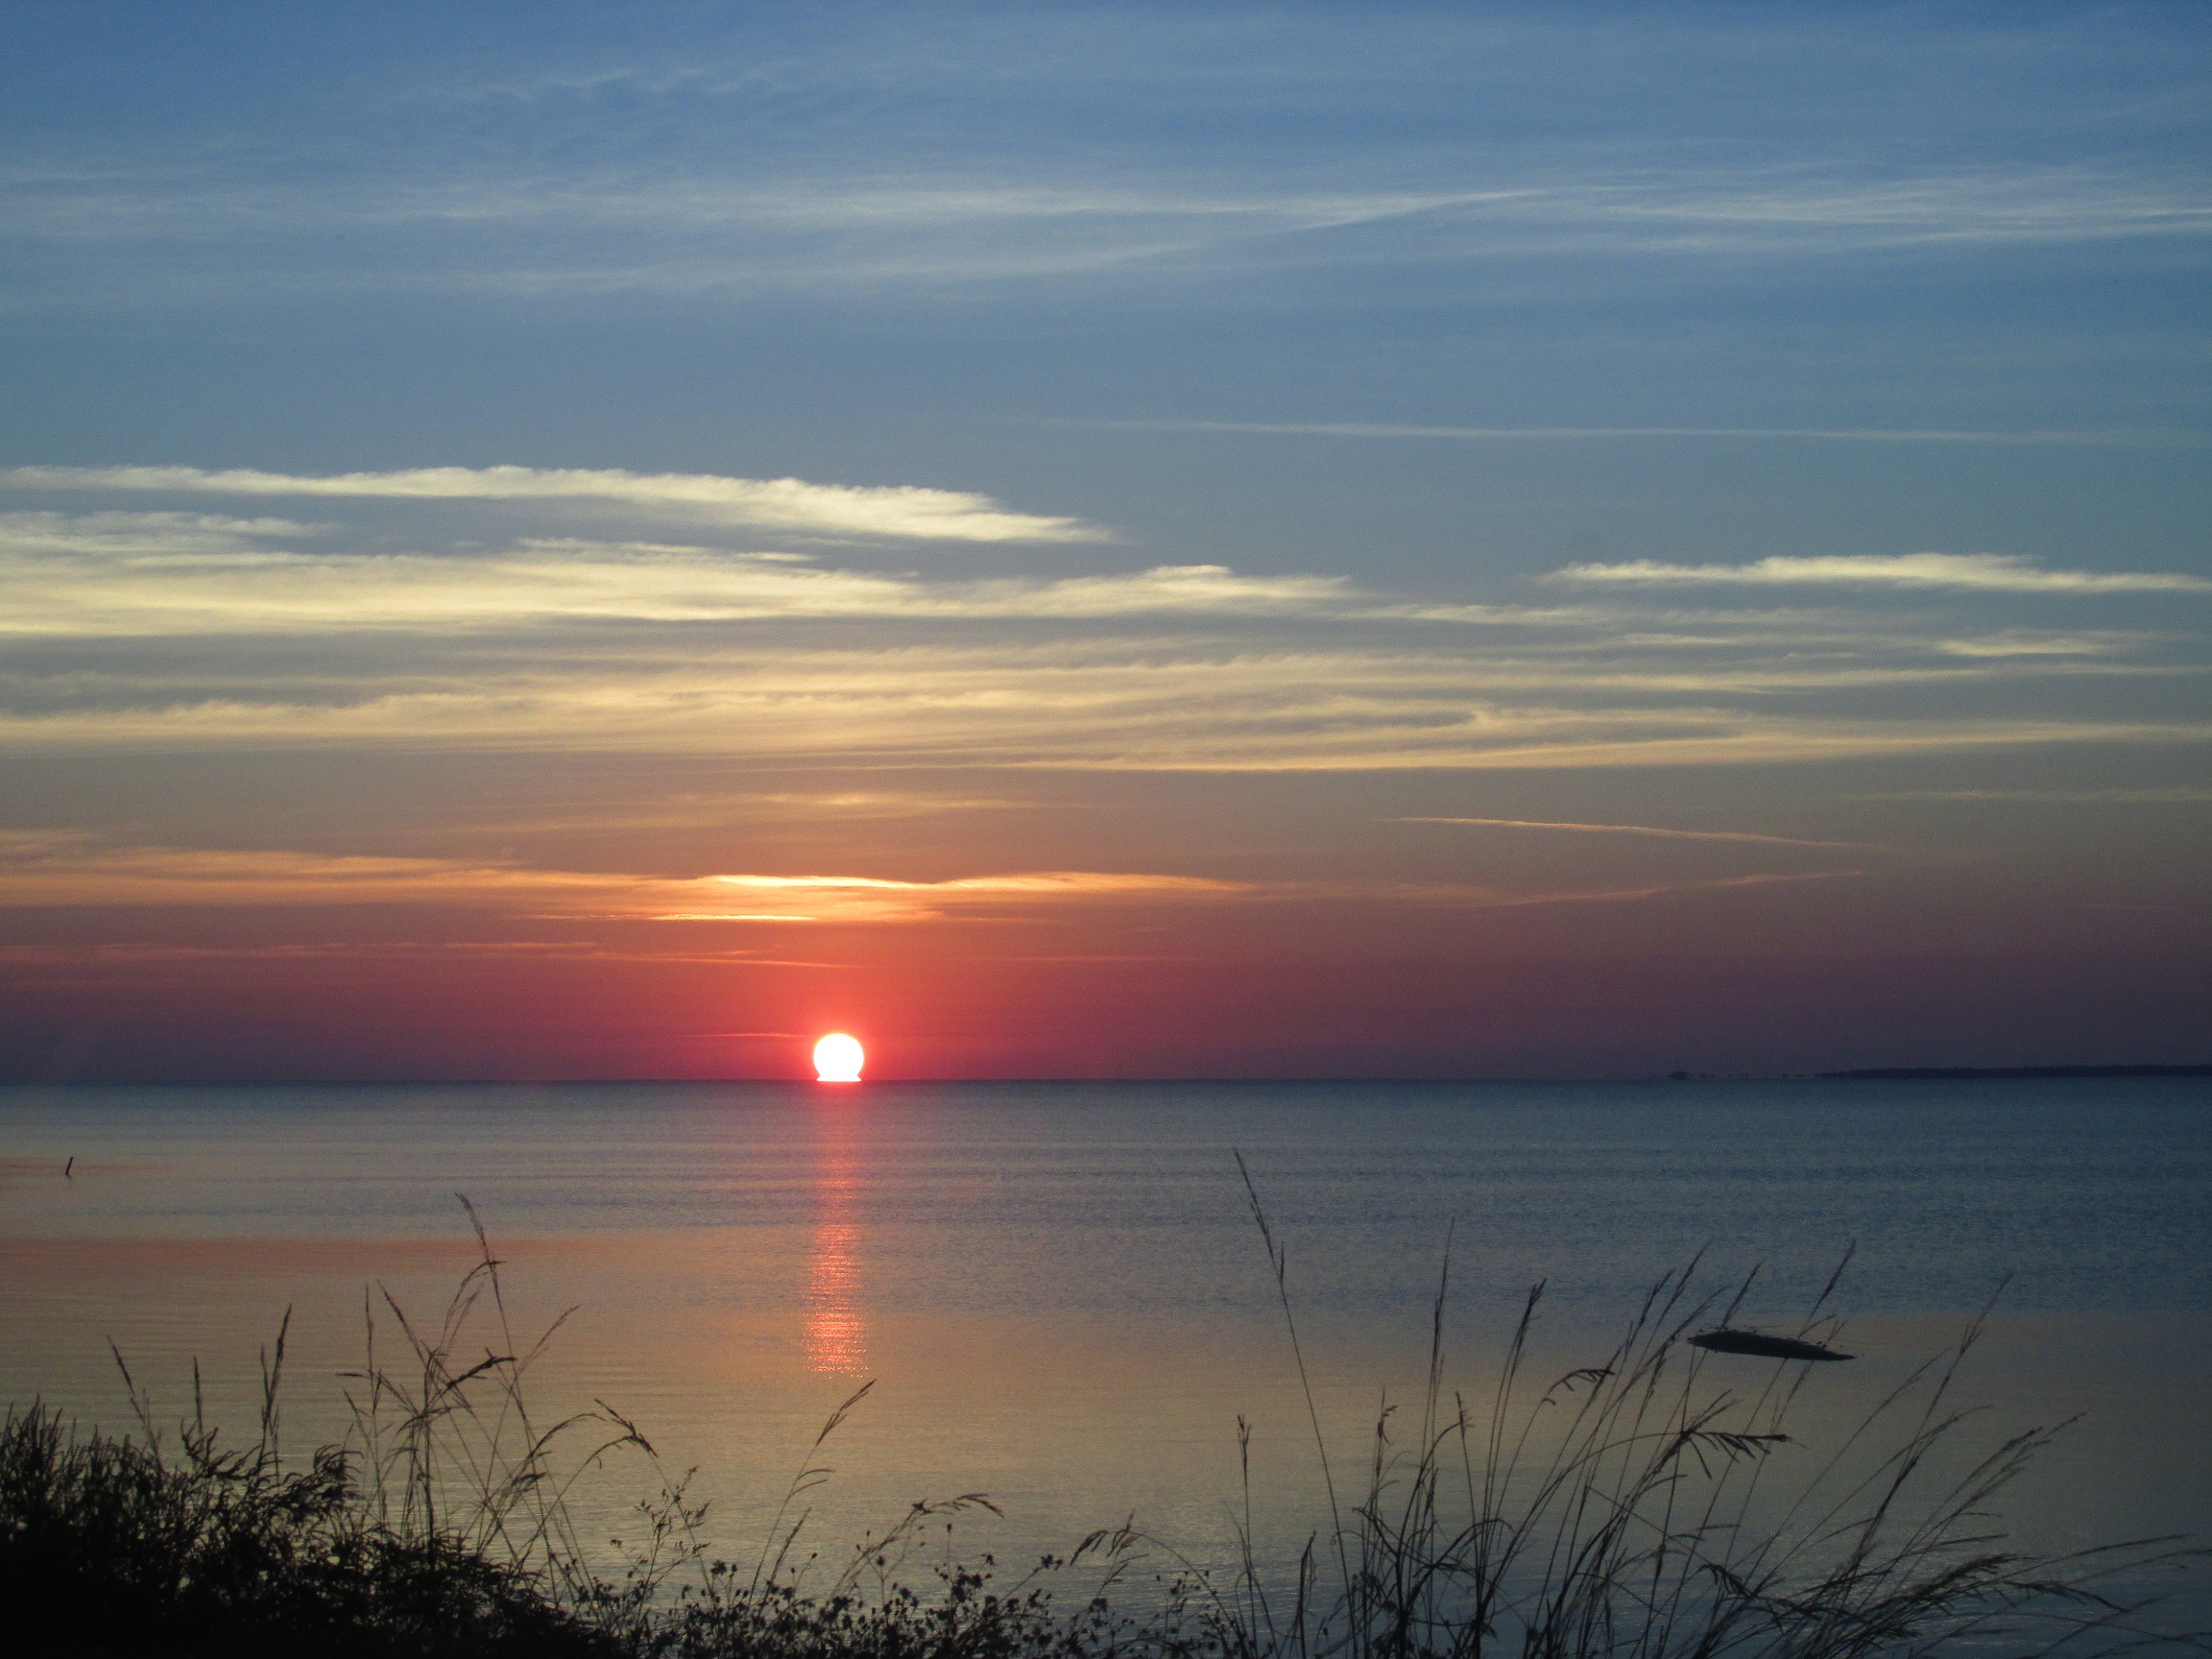
Sunrise over Apalachicola Bay in Northwest Florida
Scientists have predicted, and witnessed, the negative impacts of climate change for several decades now. Nonscientists have begun to notice as well. Increased number of hurricanes, increased intensity of some of these hurricanes, excessive and extended heat waves in the summer, drought conditions in some areas of the country, flooding issues in others, and wildfires out west. These things have all happened before but in recent decades they are becoming more common.
In 2024 I wrote four articles about our changing climate in response to the devasting hurricane season we had. The reason was my concern about climate change and that we all need to pay more attention to the issue. I wrote a total of 41 articles over the course of the year – including these four on climate. The articles on climate were the least read articles of the group. There could be a couple of reasons for this. It could be that most do not consider it a high priority concern – and I understand that. Again, water quality and habitat loss are real concerns and climate maybe less so for many people. It could be that people understand the concern about climate but what can you do? It is too big of an issue for me to deal with and so, I will focus on what I can do something about. It may be because the topic is so negative – and I get this also. I taught environmental science at Pensacola State College for 15 years. Despite there being many positive lessons in the course, many students were so depressed by the final exam they would add notes such as “I will never have children” and others similar to this. Discussing the state of our environment can be a “downer”, and they just do not want to deal with it. And it could be that they deny climate change is even happening. There are many who do feel this way. In their minds, there is no issue, nothing to discuss, nothing to read about – move on.
I posted my four articles and let it ride (links to them are posted below). However, with the tragedy of the fires in Los Angeles recently, I felt it needed to be brought back up. I watched a program about the fires and a science writer, who recently published a book about climate, made a statement to the effect that “nature is letting us know that something serious is going on… nature is letting man know that we are in this together and we need to make some changes”. I agree. Though the topics of water quality and habitat loss are concerning – and Extension will provide articles and programs during the year to help the community solve those problems – I also believe that the community needs to pay more attention to climate change and enact behavior changes to solve this very serious problem.
I have decided to post articles throughout 2025 mimicking the environmental science course I used to teach. I am obviously going to shorten the subjects – and may write more in-depth articles about some of them down the road – but the outline will follow that of the course. We will begin with how the planet works. This will be followed by the introduction of humans and how we have spread across the planet. There will be articles about how we have impacted our natural resources and the climate. And we will end with some suggested methods for solving some of the problems. I am not expecting a lot of people to follow this – but I hope you will. And I hope some positive change will come from it. Let’s begin…
Climate articles from 2024
Another Look at Climate Change – Part 1 Introduction
https://blogs.ifas.ufl.edu/escambiaco/2024/06/20/another-look-at-climate-change-part-1-introduction/.
Another Look at Climate Change – Part 2 How Might the Earth’s Temperature and Climate Change in the Future?
https://blogs.ifas.ufl.edu/escambiaco/2024/06/25/another-look-at-climate-change-part-2-how-might-the-earths-temperature-and-climate-change-in-the-future/.
Another Look at Climate Change – Part 3 What are Some Possible Effects of a Warmer Atmosphere?
https://blogs.ifas.ufl.edu/escambiaco/2024/07/03/another-look-at-climate-change-part-3-what-are-some-possible-effects-of-a-warmer-atmosphere/.
Another Look at Climate Change – Part 4 What Can Be Done?
https://blogs.ifas.ufl.edu/escambiaco/2024/07/08/another-look-at-climate-change-part-4-what-can-be-done/.
by Rick O'Connor | Jan 24, 2025
What are meroplankton? How do they differ from regular plankton?
In the plankton world there are those that are plankton (drifters) their whole lives – holoplankton – and those who are plankton for only part of their lives – meroplankton. Most know the meroplankton as larva – the early stages of large creatures like fish, crabs, and shrimp. When you pull a plankton net through the waters of the Gulf of Mexico you will collect a lot of meroplankton – and yes… they are food for the plankton feeders just as the other forms of plankton are. Like most of the holoplankton, most are microscopic and swim through the water using cilia or flagella. Like copepods, they are multicellular and are considered true animals. Here are a few that you could find in a plankton sample…
Planula larva
These are the larva of jellyfish, sea anemones, and corals. They are ciliated cells that move through the water column until they metamorphose into the adult forms. Most will settle out on hard substrate on the seafloor and develop into a flower-like structure called a polyp. Some grow into adult polyps – like sea anemones and corals – while others will go through a second stage and become swimming medusa – the jellyfish.
Trochophore larva
This is another ciliated larval form that is the first stage of some mollusk, annelid worms, and nemertean worms.
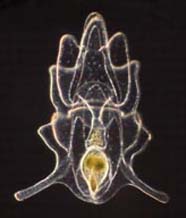
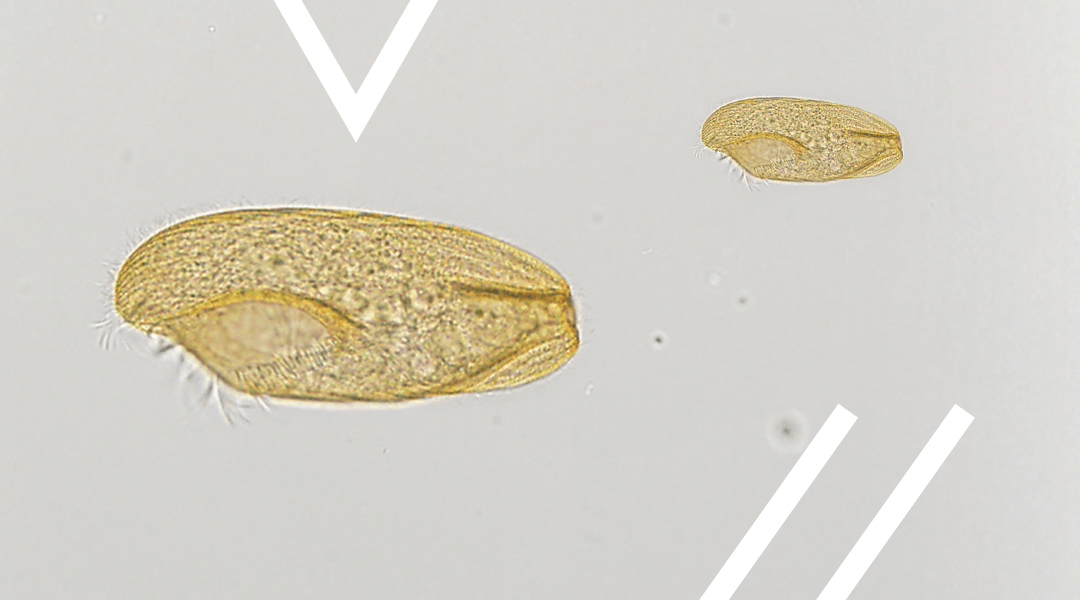
Veliger larva
This is a ciliated larval form of several mollusk. Those that go through the veliger stage begin as trochophores. Some go through the trochophore stage while in the egg, others hatch and go through the trochophore before metamorphosizing into the veliger. The veliger stage will develop the characteristic mollusk shell, and many will develop a foot which can be used in locomotion on the seafloor searching for suitable habitat.
The veliger stage of many mollusks.
Photo: NOAA.
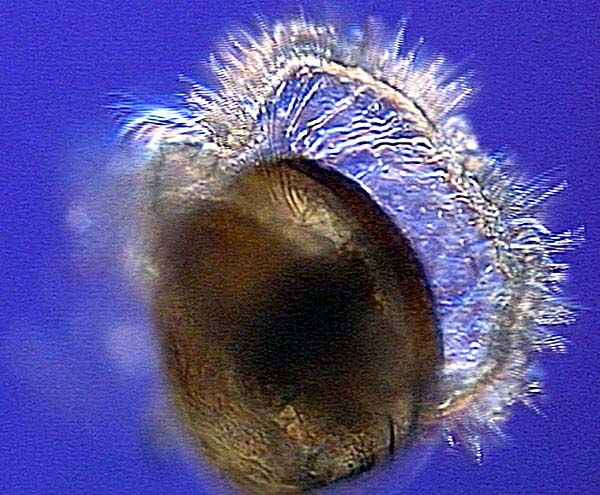
Nauplius larva
This is the first stage of a crustacean. It is very hard to tell which crustacean the nauplius will become but they do resemble crustaceans with segmented body parts and an exoskeleton. Most crustaceans will molt into the zoea stage, and some then into a megalops stage, before becoming the adult.
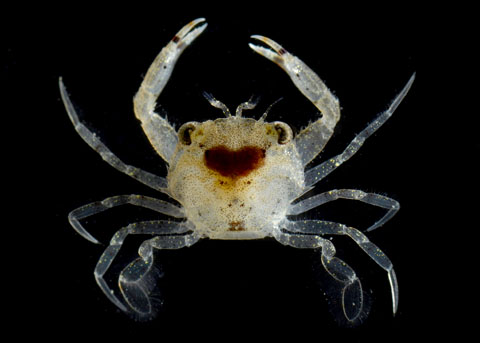
This is the megalops stage of a crab.
Photo: University of California Irvine.
Bipinnaria larva
Another ciliated larval form that will eventually become an echinoderm – starfish, sea urchin, sand dollar.
Bipannaria are the larval stage of starfish and sand dollars.
Photo: NOAA.
Ichthyoplankton
Most of the fishes in the northern Gulf of Mexico begin life as meroplankton as well – these are called “ichthyoplankton” and are quite abundant in a plankton sample. Even large fish, such billfish and swordfish, begin life at this stage.
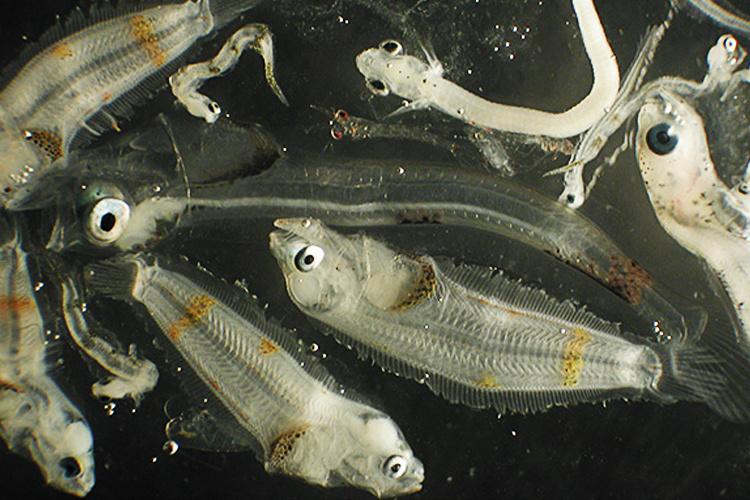
Most fish in the northern Gulf begin their lives as tiny plankton.
Photo: NOAA.
The first nine post in this series have been about microscopic creatures found in the northern Gulf. It goes without saying that there are literally thousands of other forms of plankton we did not mention. It is also important to mention how important these creatures are to the health of the Gulf and why they were as much of a concern during the oil spill as were dolphins, sea turtles, and sea birds. As the plankton go… so goes the Gulf. We will now turn our attention to the larger creatures – ones you do not need a microscope to see.
by Rick O'Connor | Jan 17, 2025
So far in this series we have been discussing microscopic creatures in the northern Gulf of Mexico that are single celled – though many may be linked together in chains. In this article we will begin discussing microscopic creatures that are multicellular.
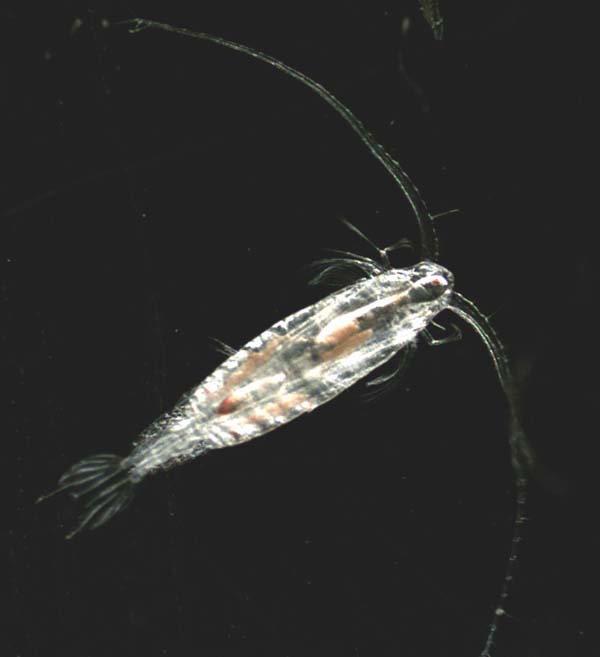
When you do a plankton tow in the northern Gulf, and have a look under the microscope, you will notice most of the moving/swimming plankton are these bug-looking creatures scientists call copepods. The Latin origin of their name (oar-foot) comes from the motion of their swimming legs, which resembles rowing with an oar. They twist and turn all within the field of view, moving quite fast. You will not miss them.
One of the most common creatures in the northern Gulf. The copepod.
Photo: National Oceanic and Atmospheric Administration.
It has been stated that the copepods produce some of the largest biomass in the oceans, there are TONS of them within the water column. They swim all through the water column feeding on the phytoplankton we have already discussed in this series. They play a very important role in the food chain connecting the photosynthetic phytoplankton – the “grasses of the sea” – with the consuming animals of the northern Gulf. It has been stated that the copepods are most likely in every creature’s food chain – making them one of the most important members of the northern Gulf of Mexico community. In addition to connecting the marine animals to the primary producers, they also are important at removing carbon from the surface waters of the oceans, reducing the negative impacts of excessive carbon in the atmosphere.
As mentioned, they are multicellular but still microscopic. We also mentioned they look like bugs and are in the Phylum Arthropoda along with the true bugs. Arthropods have jointed legs, antennae, and an exoskeleton that must be shed during growth – and this is the case with the copepods. They are in the Subphylum Crustacea – indicating they are related to shrimps and crabs. Most are between 1-2mm in length but can reach lengths of 10mm and large to be seen in a glass of sea water as flecks darting about. Most have a single compound eye and, along with their antennae, can detect the movements of both predators and prey.
Many larger creatures of the northern Gulf feed on them directly – such as the plankton feeding fish and whales. But most include them as a lower part of their food chain. Copepods can sense the presence of such predators and are quite fast swimmers. They have been clocked at 295 feet in one hour – which is equivalent to a human swimming at 50mph!
Though you will never see them when you visit the beaches, they are one of the most abundant, and ecologically important, creatures in the northern Gulf of Mexico.
References
Copepods. National Museum of Natural History. https://naturalhistory.si.edu/research/invertebrate-zoology/research/copepods.
Copepod. Monterey Bay Aquarium. https://www.montereybayaquarium.org/animals/animals-a-to-z/copepod.
Walter, T.C.; Boxshall, G. (2024). World of Copepods Database. Accessed at https://www.marinespecies.org/copepoda on 2024-11-17. doi:10.14284/356.
by Rick O'Connor | Jan 10, 2025
After two articles on protozoans, we now know what these animal-like creatures are. We have discussed some that move by flagella, and others than move by pseudopodia. The last group by short flagella called cilia.
Ciliates are often covered with these small hair-like structures and can move them relatively fast. Thus, they swim MUCH faster than flagellates, and both are faster than the amoeboid sarcodinids.
They are easy, and not easy, to identify under a microscope. You will be examining the slide seeing diatoms and dinoflagellates scattered across the screen, an occasional flagellate slowly swim by, the very slow fried egg-looking amoeboid slime through, and then a dot/cell will zip by at high speed. That was a ciliate. Easy to identify because anything moving that fast is a ciliate. Hard to identify because you have NO idea which one. Under the heat of the light, they will eventually slow down, and you can better see them for identification.
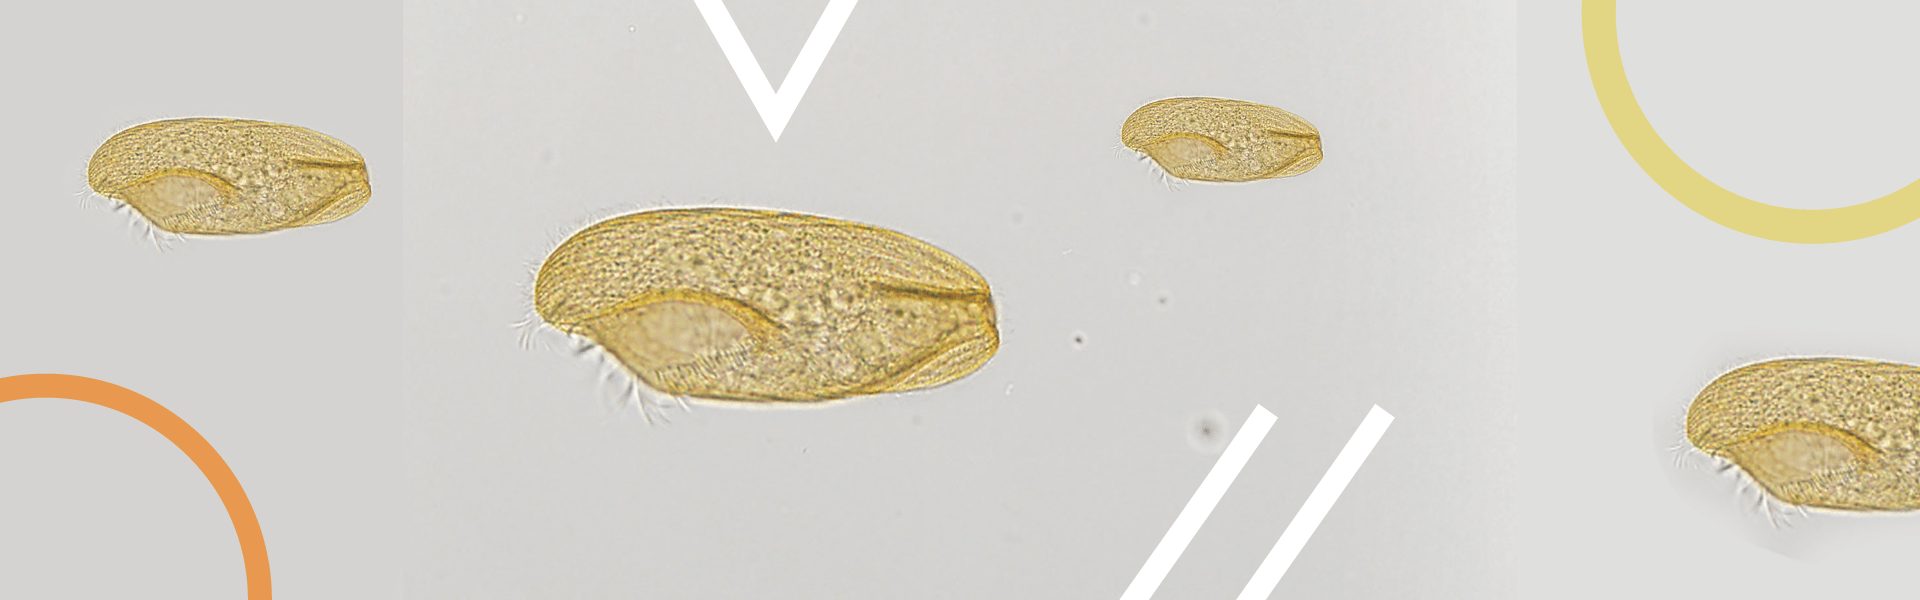
Ciliated cell found in soil.
Photo: Florida Atlantic University
Most ciliates have an open mouth and what is called an oral groove. This groove acts like a throat leading the food to the food vacuole – where it is digested. Waste will live the protozoan either through the cell membrane, or back out the mouth. At the opening if the mouth are numerous cilia that generate a current sucking up food like a vacuum cleaner and moving it down the oral groove. Most have many nuclei which are easily seen under the scope. They move through the water column collecting food and moving it down the food chain. Most lack shells, so do not contribute to the sediments of the ocean floor or on our beaches.
Up to this point in the series we have been discussing the microscopic phytoplankton and zooplankton found in the Gulf of Mexico. These are creatures few know about, nor do they understand their importance in cycling food, energy, nutrients, and other chemical processes that keep the ecology of the northern Gulf of Mexico in balance. But is now time to turn our attention to the larger – macroscopic – creatures of this world. We begin with seaweed.
References
Yaeger, R.G. 1996. Protozoa: Structure, Classification, Growth, and Development. Chapter 77. Medical Microbiology, 4th edition. https://www.ncbi.nlm.nih.gov/books/NBK8325/#A4082.
by Rick O'Connor | Dec 20, 2024
In our last article we asked the question – “what are protozoans?” As we mentioned then the breakdown of the word includes “proto” which means “before”, and “zoan” which refers to animals. These are the “before animals” – meaning animal-like creatures BEFORE there were true animals.
They are single celled creatures that lack a cell wall and chlorophyll – animal-like – but they are only single celled – so, not true animals. Being animal-like means they cannot produce their own food as the diatoms, dinoflagellates, seaweeds, and true plants do. Rather, they must consume food as animals do. Some feed on diatoms and dinoflagellates. Some feed on decaying organic matter on the seafloor. Some are parasitic and feed off of a host organism. Some feed on other protozoans. And some do a combination. But they are all consumers.
The group is classified into six phyla mostly based on how they move. One subphylum is the Sarcodinids – which move using blobby extensions of their cytoplasm called pseudopods. Under a microscope they would resemble a fried egg oozing across the slide. They are NOT fast. They can use these pseudopods not only for moving but for gathering food. I remember watching them under a scope in college. They slowly oozed across the slide engulfing most other protozoans and phytoplankton they encountered. They were like the “sharks” of the micro-world. Many live on the seafloor, or within the sediments themselves. Some are parasites. And there are a few planktonic forms. Their primary role in the marine system is moving energy through the food chain and cleaning up the environment. As with the flagellates, there two common groups in marine waters – the foraminiferans and the radiolarians.
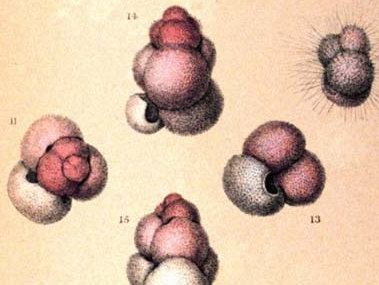
The first true oceanographic research cruise was the voyage of the HMS Challenger in 1872. The chief scientist on this first expedition was Charles Wyville Thomson, a marine geologist and one very interested in what was on the ocean floor. During the first leg of the voyage – from Europe to the America’s – they collected sediment samples several time each day. By far most of the ocean floor was made of what was called “globigerina ooze”. Globigerinids are a group of marine foraminiferans. They produce a calcium carbonate shell that is chambered. Under a microscope they look very much like seashells. They are part of the plankton layers in the ocean – what would be called “zooplankton”. Many possess spines on their shells to help reduce sinking. When they die their shells fall to the seafloor. Over time they formed the thick layers of sediment Thomson witnessed and called “ooze”. He also discovered that most of the ocean floor is covered with these microscopic shells. The Gulf of Mexico is no different. Most formaminiferans live on the seafloor and contribute to the sediment layers from there. One group forms mats on rocks that look pink in color and are responsible for the pink sands found in Bermuda.
Artist image of Globigerina.
Image: NOAA
Another group of shelled amoeboid protozoans are the radiolarians. Under the microscope these are some of the most beautiful creatures you will find in the northern Gulf. Like diatoms, their shells are made of silica and look like glass. Most have spines and shapes that make them resemble snowflakes – truly beautiful. Like foraminiferans, when they die their shells settle on the seafloor and contribute to the ooze layers. Radiolarian ooze has been found as deep as 12,000 feet.
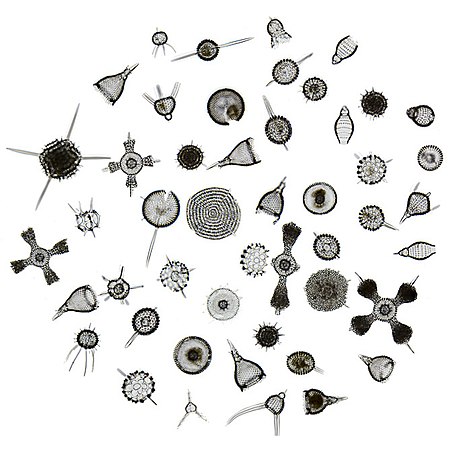
The snowflake-like shells of radiolarians.
Image: Wikipedia.
These small, microscopic amoeba like animals play an important role in moving food and energy through the Gulf. Their discovery on the seafloor helped marine geologists better understand how our oceans formed and how they have changed over time. On other beaches around the world, they have contributed to sands giving some beaches very unique colors – which are popular with tourists. They are an unknown, but important part of the marine community in the northern Gulf of Mexico.
References
Yaeger, R.G. 1996. Protozoa: Structure, Classification, Growth, and Development. Chapter 77. Medical Microbiology, 4th edition. https://www.ncbi.nlm.nih.gov/books/NBK8325/#A4082.
