by Rick O'Connor | Feb 21, 2025
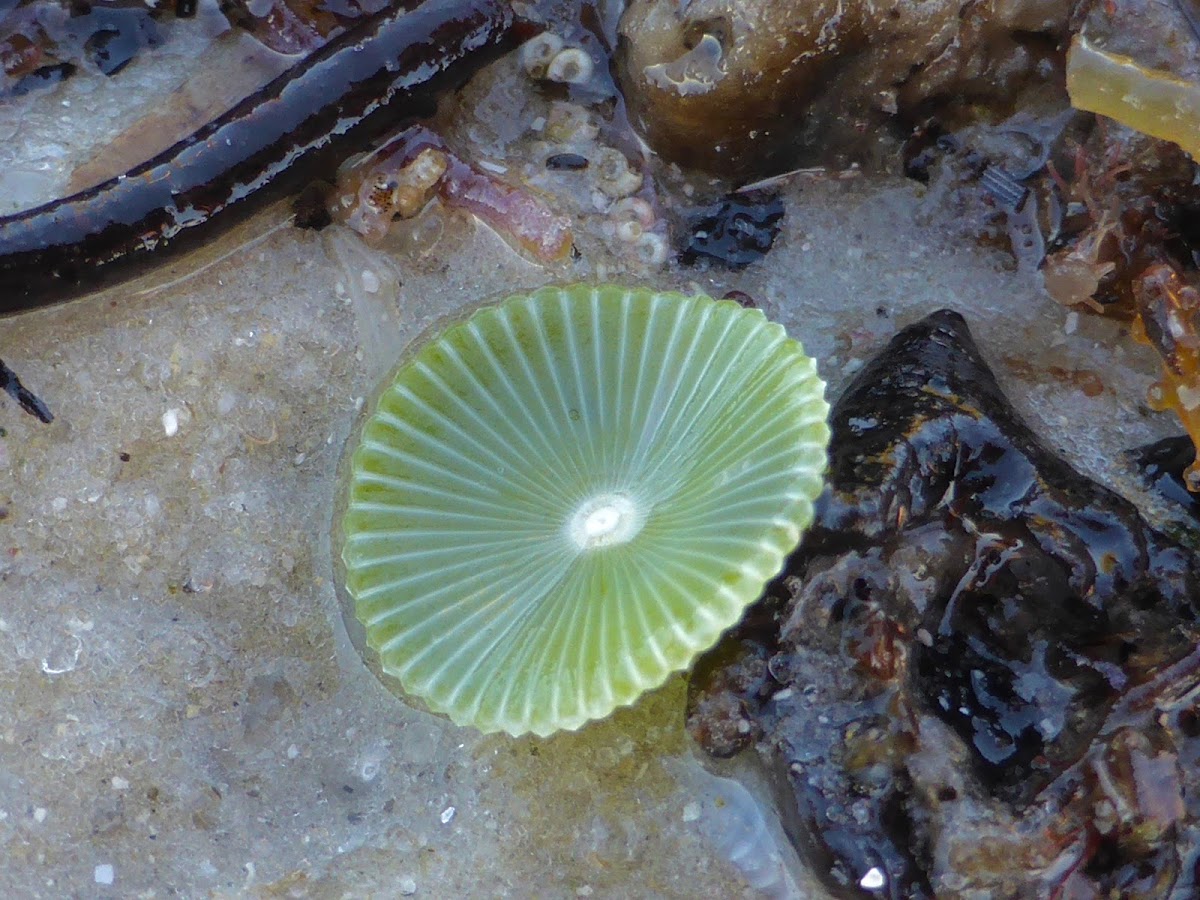
They say life began in the oceans. We know that the lithosphere is cracked, adding new land, subducting land over time. But much of the lithosphere is covered with water – and here life began. Initially it had to begin on either rock or sand. The sand would have been produced by the weathering and erosion of rock. Obviously, this would all have had to occur over a long period of time. But the first forms of life would have to be able to find food and nutrition from a barren seafloor with little to offer. This would take a special community of creatures – ones we call the pioneer community.
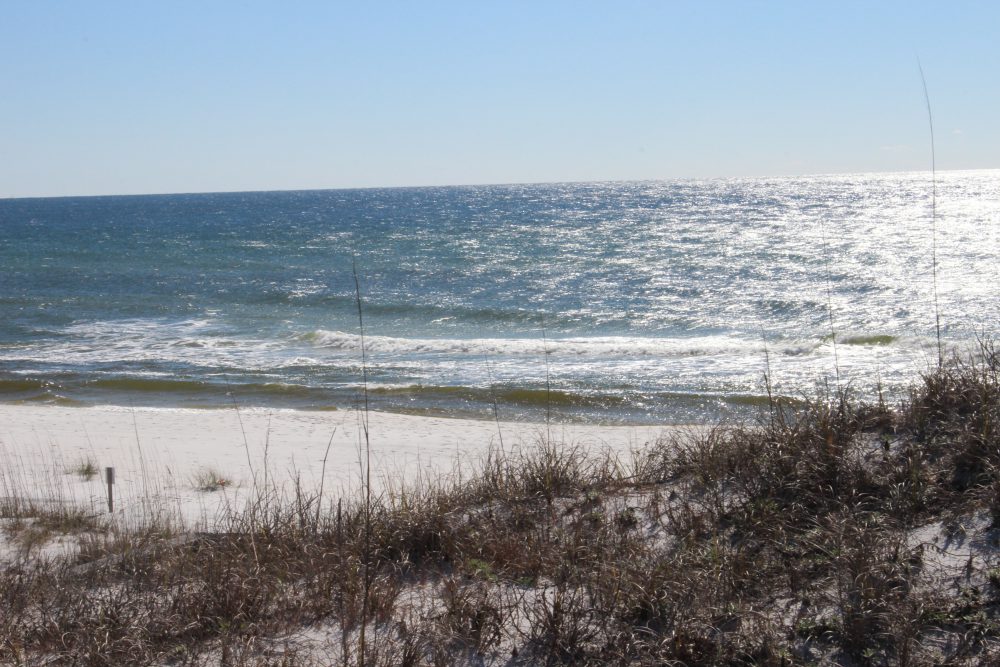
It is believed that life began in the ocean.
Phot: Rick O’Connor
Key members of these communities would have been the producers’ ones who produce food. What we know now is that producers absorb carbon dioxide and water and – using the sun as a source of energy – convert this into carbohydrates and oxygen. We have since learned that there are ancient forms of bacteria that can do this with hydrogen sulfide and other compounds. However, it started – it began. One problem with this model is that much of the world’s oceans are too deep for sunlight to reach. Thus, living organisms would need to be close to shore. Today we know two things. One, the ocean’s surface is covered with microscopic plant-like creatures (phytoplankton) who can float and reach the sunlight. Two, some of the ancient chemosynthetic bacteria (those that do not need the sun and can use other compounds to produce carbohydrates) live on the ocean floor.
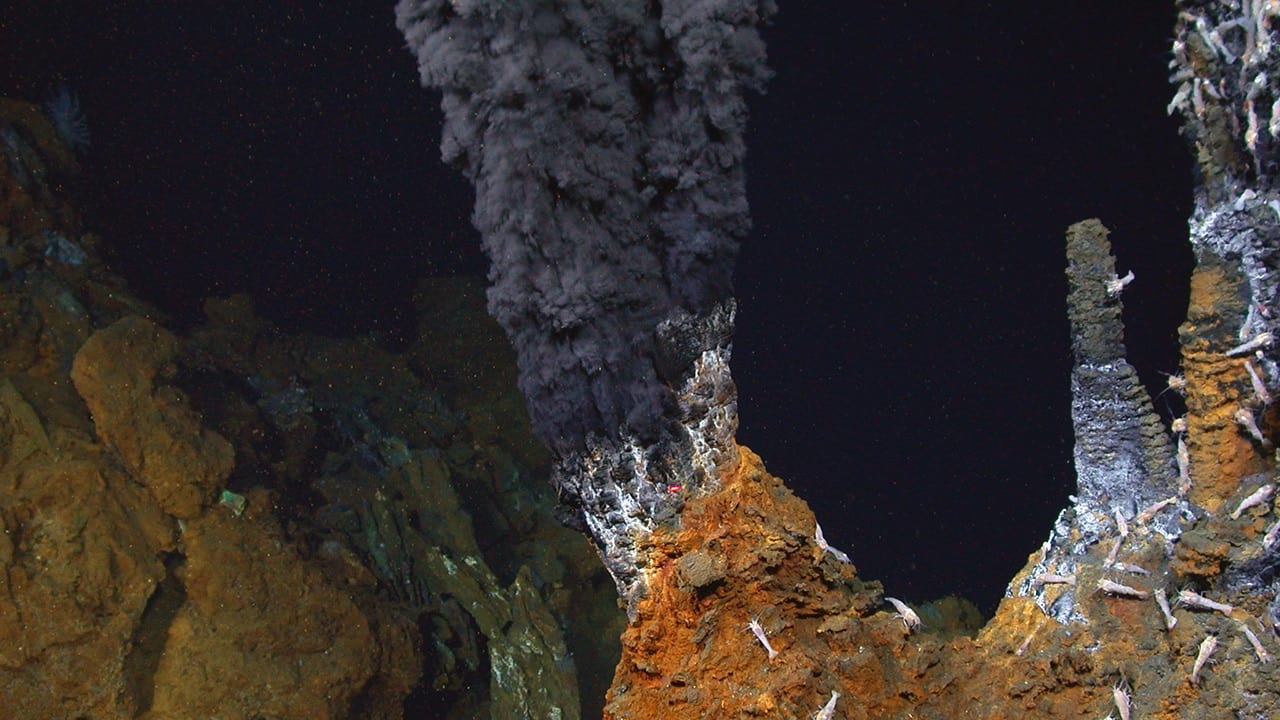
The black smokers – hydrothermal vents – found on the ocean floor.
Photo: Woodshole Oceanographic Institute.
Producers are followed by consumers, creatures who cannot make their own food and must feed on either the producers or on other consumers. There are plankton feeding animals – oysters, sponges, corals, and zooplankton. There are larger creatures that feed on larger plankton – manta rays, menhaden, and whales. There are consumers who feed on the first order of consumers – stingrays, parrotfish, and pinfish. And there are the top predators – orcas, sharks, and tuna. The ocean is a giant food web of creatures feeding on creatures. All creatures evolve defenses to avoid predation. Predators evolve answers to these defenses. Some species survive for long periods of time like the horseshoe crabs and nautilus. Others cannot compete and go extinct.
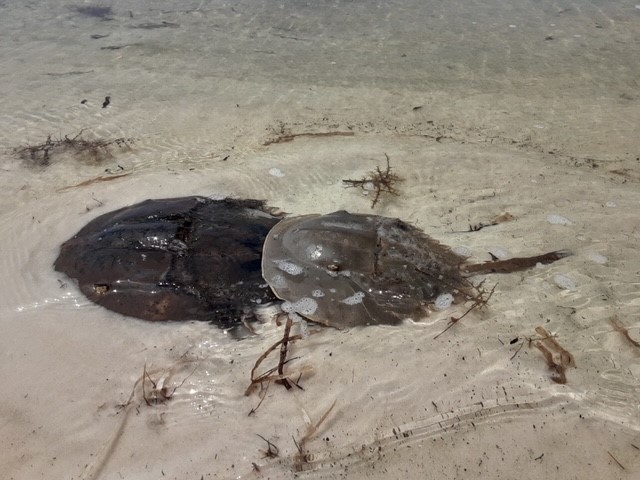
Horseshoe crabs are one of the ancient creatures from our seas. Photo: Bob Pitts
As we mentioned in Part 1 of this series – the hydrosphere is in motion. Different temperatures, pressure, and the rotation of the planet move water all over. These currents bring food and nutrients, remove waste, and help disperse species across the seas. Life spreads to other locations. Some conditions are good – and life thrives. Others not so much – and only specialists can make it. The biodiversity of our oceans is an amazing. Coral reefs, mangrove forests, and seagrass beds are home to thousands of species all interacting with each other in some way. The polar regions are harsh – but many species have evolved to live here, and the diversity is surprising higher than most think. The bottom of the sea is basically unknown. It has been said we know more about the surface of the moon than we do at the bottom of our ocean. But we know there is a whole world going on down there. We believe the basic principles of life function there as they do at the surface – but maybe not!
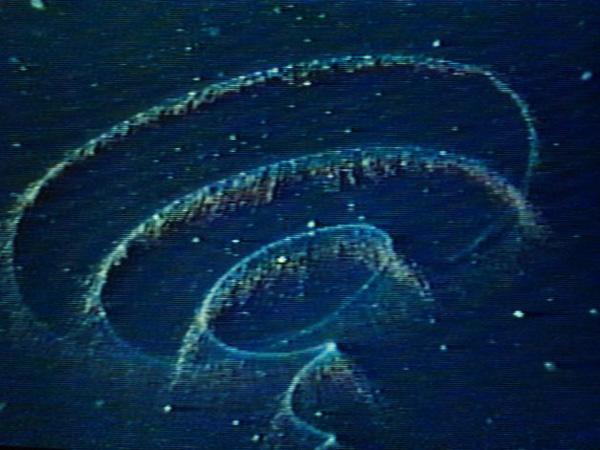
The magical lights of the deep sea.
Photo: NOAA
Fossil records suggest life here began almost one billion years ago. The fossils they find are of creatures similar and different from those inhabiting our ocean currently. As we stated that the physical planet is under constant change – life is as well. It is a system that has been working well for a very long time. Over the last few centuries humans have studied the physical and living oceans to better understand how these systems function. They have been functioning well for a very long time. And though life began at sea – there was dry land to exploit – for those who could make the trip. That will be next.
by Rick O'Connor | Feb 14, 2025
With this article we will shift from the microscopic creatures of the Gulf of Mexico to the macroscopic ones – ones you can see without a microscope. We will begin with the simplest and most primitive of macroscopic creatures – the seaweeds.
Many locals see the grass washed ashore along the Intracoastal Waterway and call this seaweed, but it is in fact seagrass. Seaweed differs from seagrass in that they are not true plants. True plants are vascular – meaning they have a series of “veins” running through their body called xylem and phloem. These veins move water and material throughout the body – similar to the arteries and veins of an animal. But seaweeds lack this “circulatory” system, rather they absorb water through their tissues and must live in the water environment to do this. Seaweeds lack leaves, stems, and roots. They do not produce seeds or flowers, but they do require sunlight and nutrients and conduct photosynthesis as true plants do. When I was in college seaweed was considered simple plants – just nonvascular ones. Today biologists believe they are too simple to be considered plants and thus are a group existing between the microscopic phytoplankton and the true vascular plants we know from our lawns and forests. They are often called algae as well as seaweed.
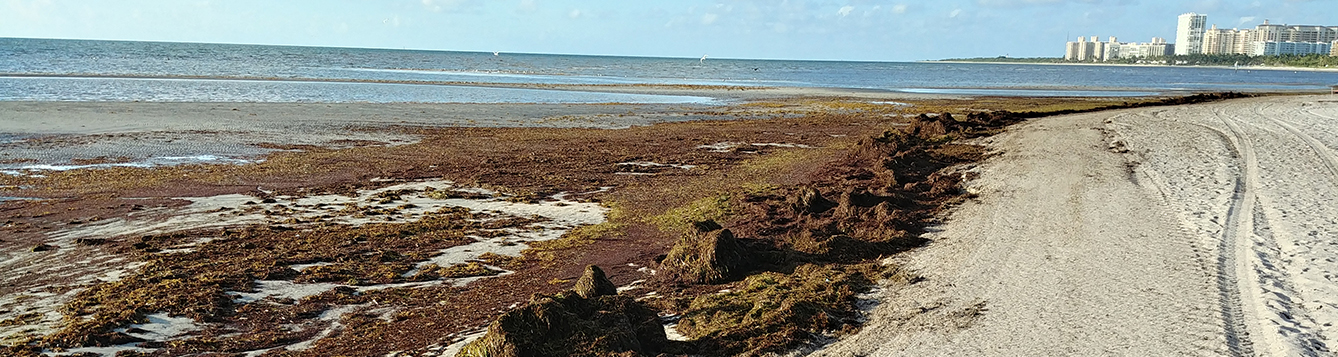
Mats of Sargassum on a south Florida Beach.
Photo: University of Florida
Biologists divided the seaweeds into divisions based on their color, which is determined by the photosynthetic pigments they have for photosynthesis. Compared to my college days, the classification of green algae is quite complex. The entire group was once placed in the Division Chlorophyta. Today, most sources consider only the marine forms of green algae in the group Chlorophyta, with numerous other groups consisting of thousands of species. Most green algae live in freshwater and are believed to be the group that led to the land plants we are familiar with. Their photosynthetic pigments include chlorophyll and a and b but also carotene and xanthophyll. The pigments are dominated by the chlorophylls – hence their green color – and the ratio of chlorophyll to carotene and xanthophyll is the same as the plants you find in your yard – hence the argument they led to the evolution of land plants.
Green algae – or any of the seaweeds – are not as common along the northern Gulf of Mexico as you find on other coasts. Not having true roots, stems, or leaves, seaweeds must attach themselves to the seafloor using a suction cup type structure called a holdfast. To attach, the holdfast must have a rock of some type. Along the rocky shores of Maine and California, they are quite common. Even with the limestone rock of south Florida you can find these. But the fine quartz sand of the northern Gulf of Mexico is not as inviting to them. That said, we do find them here and most are found on man-made structures such as jetties, seawalls, and artificial reefs – I found one attached to a beer can.
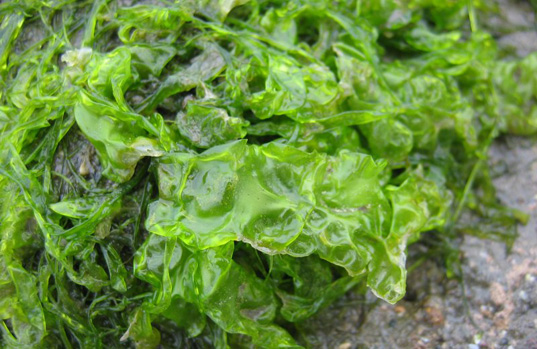
Of all of the green algae that exist in Florida, I have only encountered three. One is called “sea lettuce” in the genus Ulva. Attached to rock jetties and seawalls, it looks just like lettuce and is beautiful, brilliant green in color. It grows to about seven inches in height and is used as a food source in different countries. It can become a problem if local waters are high in nutrients due to pollution from land sources. It will grow abundantly, reducing habitat for other species, and wash ashore during storms where it breaks down releasing gases that can be toxic to shore life and humans. I first encountered it growing on the rock jetties at St. Andrews State Park in Panama City, but it does grow on local hard structures.
Sea Lettuce.
Photo: University of California
“Dead Man’s Fingers” – Codium – is another green algae I first encountered it on the jetties of St. Andrews. The thick finger-like projections of this seaweed extending from the rocks did resemble a glove – or the fingers of a dead man within the rocks. Some species around the world are used for food. But I could not find any references that it is here.
“Deadman’s Fingers”.
Photo: iNaturalist
The third species of green algae I have seen locally is known as the “Mermaids Wine Glass” – Acetabularia. This beautiful seaweed is relatively small and does resemble a wine, or martini glass. They are quite abundant in south Florida and is the one I found growing on a beer can submerged in Santa Rosa Sound.
“Mermaid’s Wineglass”
Photo: Project Noah
Though seaweeds in general are harder to find along the northern Gulf coast, they are fun to search for and do play a role as primary producers here.
References
Green Algae. Wikipedia. https://en.wikipedia.org/wiki/Green_algae.
Deadman’s Fingers. Monterey Bay Aquarium. https://www.montereybayaquarium.org/animals/animals-a-to-z/dead-mans-fingers.
Introduction to Green Algae. University of California/Berkley. https://ucmp.berkeley.edu/greenalgae/greenalgae.html.
Ulva Lactuca. Wikipedia. https://en.wikipedia.org/wiki/Ulva_lactuca.
by Rick O'Connor | Feb 14, 2025
To better understand the basics of how the planet works we will use the analogy of a chicken egg. The yolk would represent the core – solid and in the middle of the planet. The mantle would be like the egg white that surrounds the yolk. It takes up most of the space, is fluid, and slowly rises and falls as it is heated by the core. The eggshell would represent the crust of the earth. Solid, and very thin. However, the crust of our planet is not smooth. It is covered with mountains and valleys, some of it above sea level but most (70%) would be below the oceans. And above the eggshell would be a thin layer of gas we call the atmosphere.
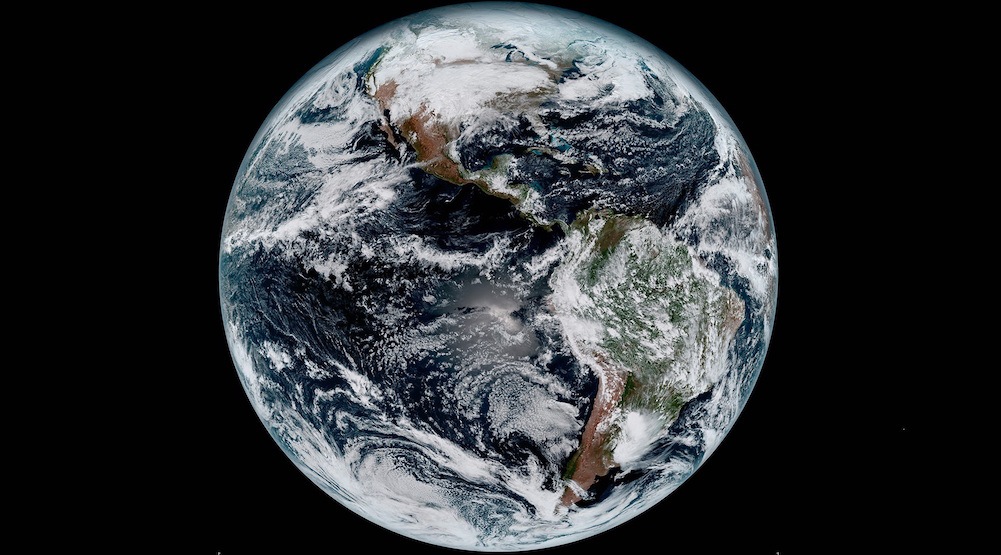
Our fragile Earth
Photo: NOAA
What we know of the core of the planet has come from seismic waves we have generated. As sound waves pass through different materials, the waves bend and reflect differently. The patterns of the refraction and reflection suggest that the core is made of iron and nickel. The temperatures here are extreme – up to 9000°F – but the intense pressure generated by gravity keeps the inner core a solid – like our egg yolk.
The mantle is actually solid rock but moves VERY slowly like a thick liquid – similar to glaciers. Like the core – the mantle is very hot but the pressure there keeps in a more solid fluid state. However, as this rock layer comes closer to the crust, the temperature is high enough, and the pressure low enough, that it becomes more fluid like – and we call it magma. This upper portion of the mantle is known by geologists as the asthenosphere.
The crust is made of solid igneous rock that is basically cooled magma. Granite is the rock that makes up the continental land masses and the denser basalt is found on the ocean floors – basalt “sinks” deeper into the more fluid mantle. Geologists call the crust the lithosphere.
The ocean is made of 97% water and 3% salt. This saltwater makes up 90% of the water on the planet. Freshwater can be found on land and in the ice of the polar regions. They refer to all of the water on the planet as the hydrosphere.
The air above the planet is a thin layer of gases made primarily of nitrogen, but also includes oxygen, carbon dioxide and other trace gases. It is called the atmosphere.
If you were to look down on the planet from the north pole it would rotate counterclockwise – from the south pole it would be clockwise. This rotation causes the hydrosphere and atmosphere to “slush around”. Add temperature and pressure change as a cause for this rotation we generate the winds and currents of our planet.
Over the last century scientists have discovered that the crust is cracked, and each section of eggshell is called a plate. These cracks provide places where molten magma can exit into the environment in the form of volcanos. These can be found on both land and at the bottom of the sea. The molten rock cools when it meets the hydrosphere and atmosphere and a cocktail of gases, liquids, and solids are produced. These gases contributed to the formation of the atmosphere that was held close to the planet by gravity.
About one billion years ago some of these molecules formed cell like structures that could take in gases, liquids, and solids and release waste products. This taking in/converting/releasing out of new materials changed the chemistry of the land, sea, and air. Oxygen increased in the atmosphere and the planet cooled to a point where these cell-like structures could live, grow, and reproduce. They produced their own energy to maintain their own metabolism and eventually some cells developed that could not make their own energy and needed to consume the cells that did – predator/prey relationships were developed.
As the planet aged and changed, the living creatures aged and changed. Many creatures could not survive the new changes and went extinct. With the new changes, new creatures would appear. Those had to deal with the conditions of either land, sea, or air and with the other creatures that lived nearby. Interactions between these creatures would change the environment and the process of change in life followed suit.
This is how our planet has functioned since its beginning. The planet changes, the living organisms change, these changes cause more changes, and the planet evolves over time. Today, there are millions of species on the planet and millions more have gone extinct. In the next article we will look at how these systems function in the hydrosphere.
by Rick O'Connor | Jan 31, 2025
Each year I survey the public to determine what their needs are – what they are most concerned about – and where Extension might help. One of the primary functions of Extension is to provide local clientele with solutions to their needs – our mantra at UF IFAS Extension has been “Solutions for Your Life”. Most years the primary concern for Sea Grant locally has been water quality. Habitat restoration and invasive species also score high. These are all important issues. We want to maintain a high quality of life and addressing these concerns will help do that. And as important as these are, and they are, if someone were to ask me about my highest concern, it would be climate change. The issues above can be connected directly, or indirectly, to climate change.
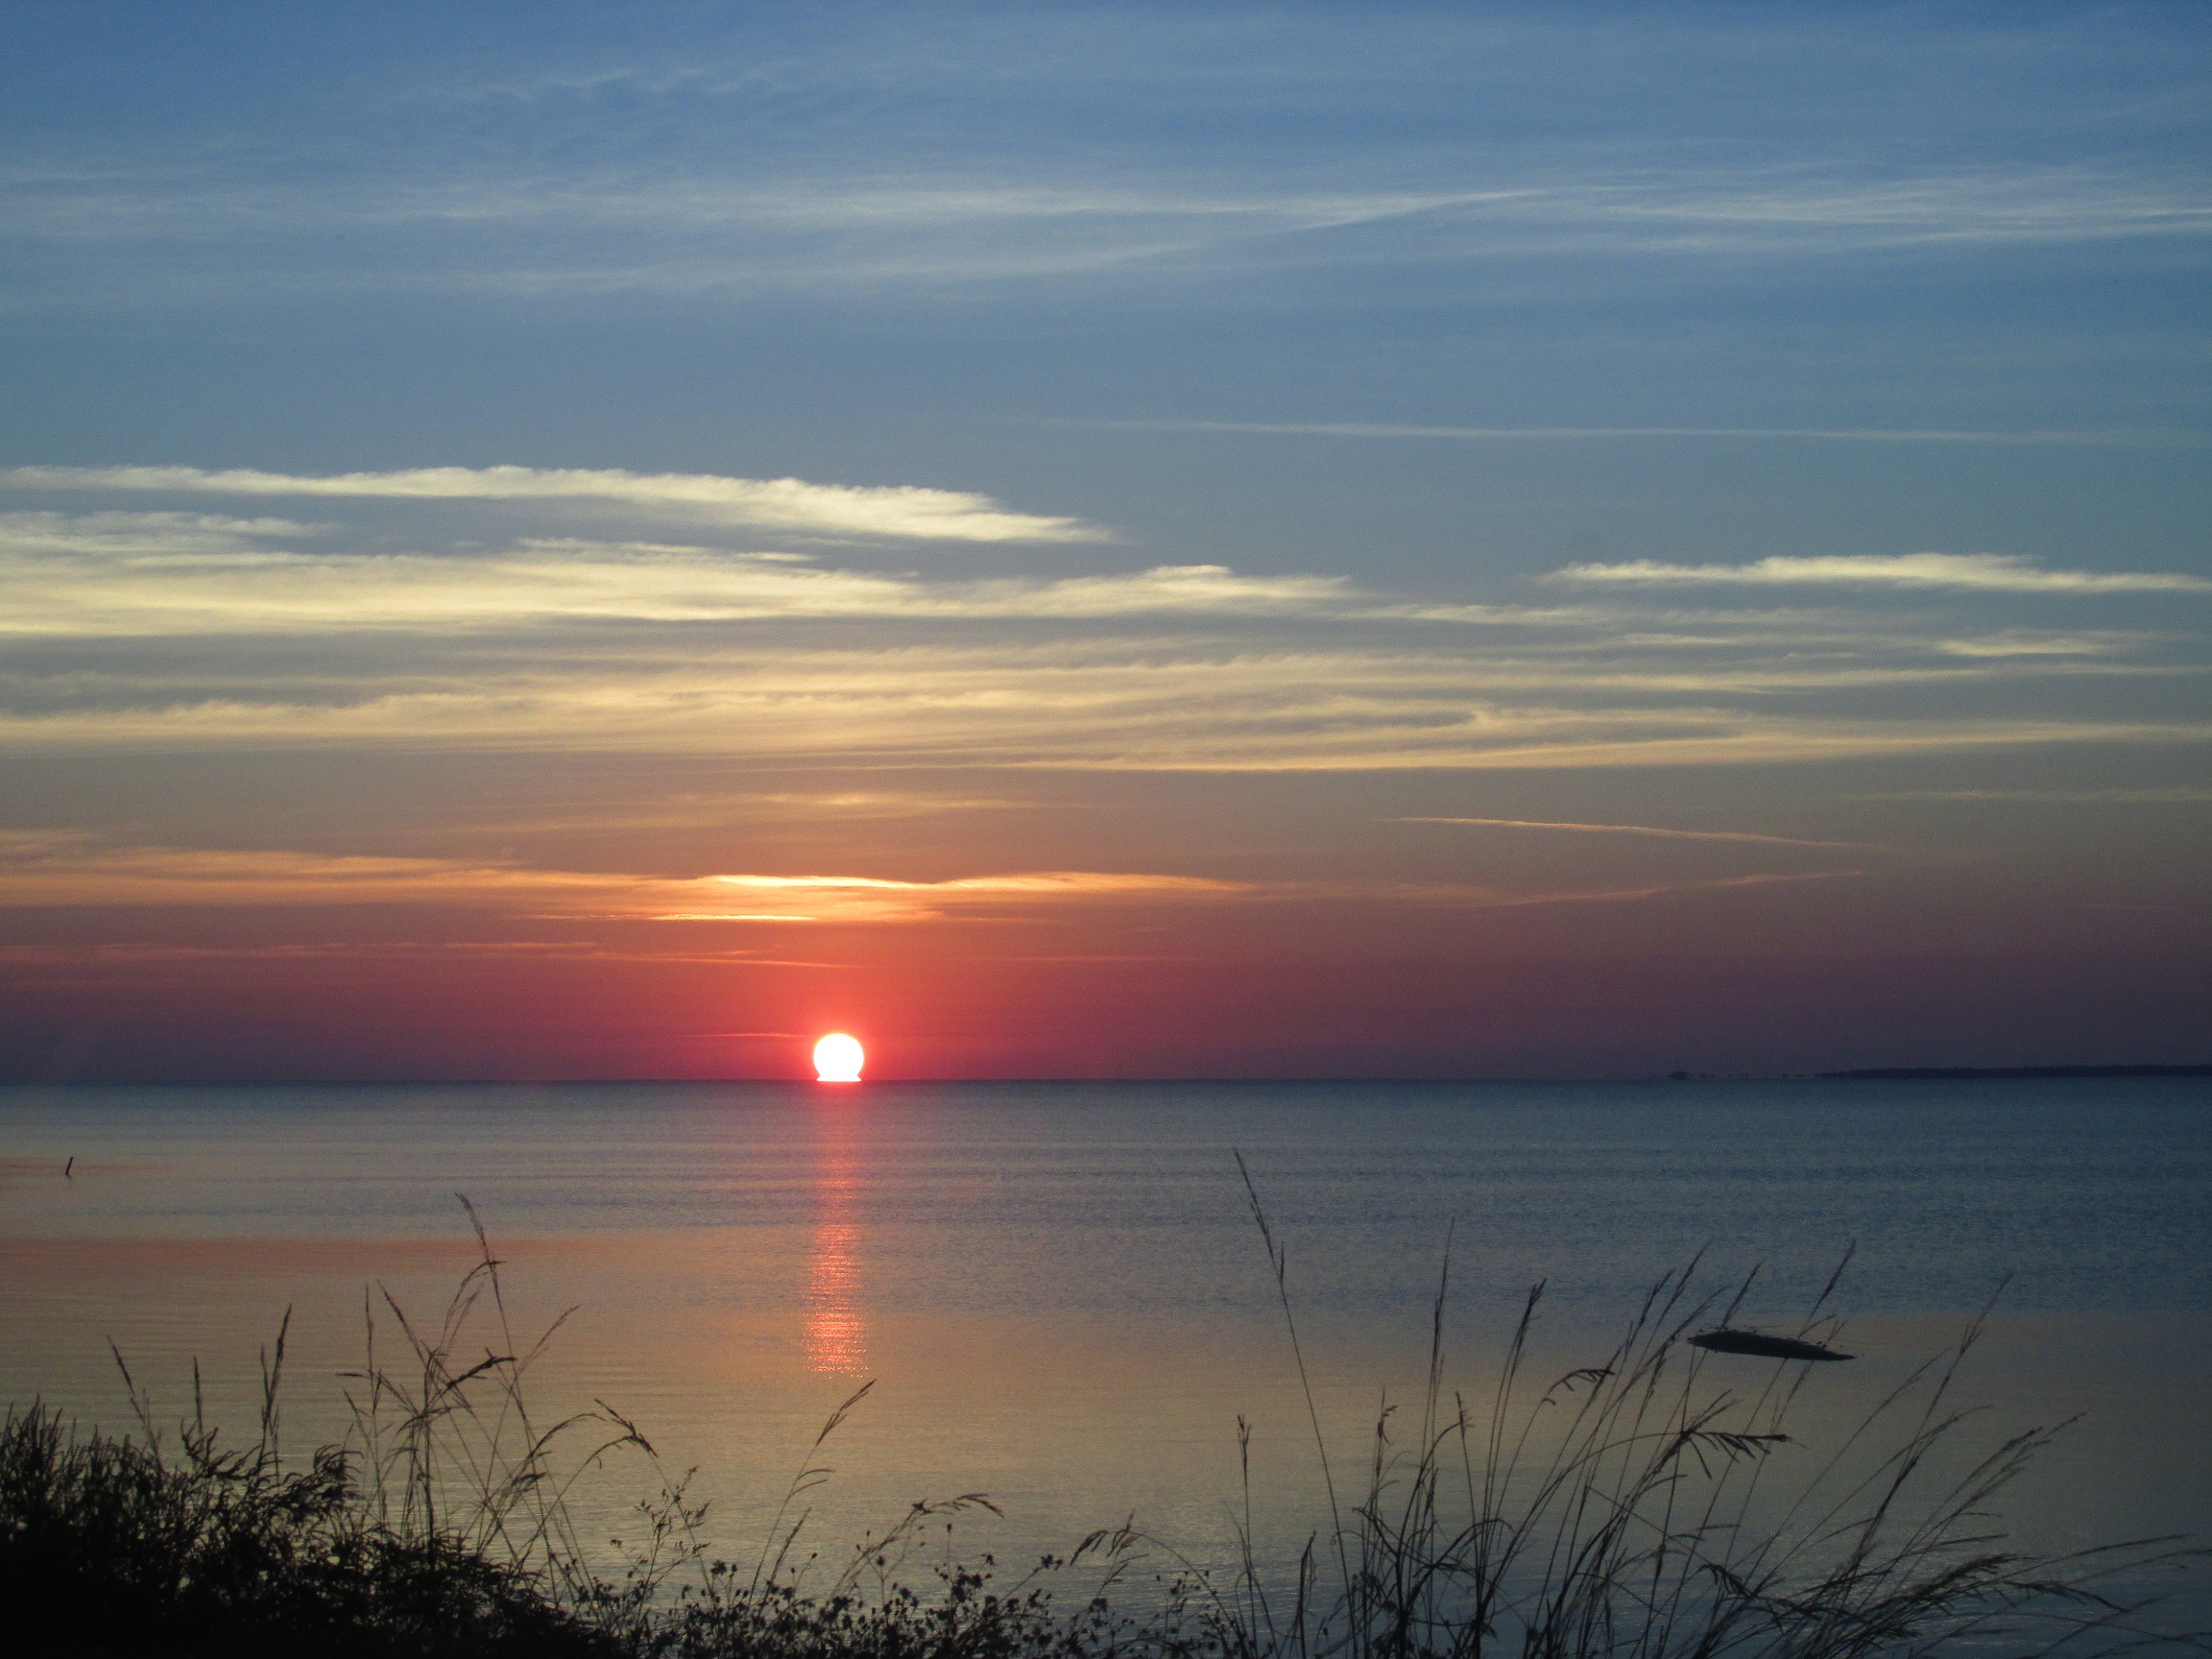
Sunrise over Apalachicola Bay in Northwest Florida
Scientists have predicted, and witnessed, the negative impacts of climate change for several decades now. Nonscientists have begun to notice as well. Increased number of hurricanes, increased intensity of some of these hurricanes, excessive and extended heat waves in the summer, drought conditions in some areas of the country, flooding issues in others, and wildfires out west. These things have all happened before but in recent decades they are becoming more common.
In 2024 I wrote four articles about our changing climate in response to the devasting hurricane season we had. The reason was my concern about climate change and that we all need to pay more attention to the issue. I wrote a total of 41 articles over the course of the year – including these four on climate. The articles on climate were the least read articles of the group. There could be a couple of reasons for this. It could be that most do not consider it a high priority concern – and I understand that. Again, water quality and habitat loss are real concerns and climate maybe less so for many people. It could be that people understand the concern about climate but what can you do? It is too big of an issue for me to deal with and so, I will focus on what I can do something about. It may be because the topic is so negative – and I get this also. I taught environmental science at Pensacola State College for 15 years. Despite there being many positive lessons in the course, many students were so depressed by the final exam they would add notes such as “I will never have children” and others similar to this. Discussing the state of our environment can be a “downer”, and they just do not want to deal with it. And it could be that they deny climate change is even happening. There are many who do feel this way. In their minds, there is no issue, nothing to discuss, nothing to read about – move on.
I posted my four articles and let it ride (links to them are posted below). However, with the tragedy of the fires in Los Angeles recently, I felt it needed to be brought back up. I watched a program about the fires and a science writer, who recently published a book about climate, made a statement to the effect that “nature is letting us know that something serious is going on… nature is letting man know that we are in this together and we need to make some changes”. I agree. Though the topics of water quality and habitat loss are concerning – and Extension will provide articles and programs during the year to help the community solve those problems – I also believe that the community needs to pay more attention to climate change and enact behavior changes to solve this very serious problem.
I have decided to post articles throughout 2025 mimicking the environmental science course I used to teach. I am obviously going to shorten the subjects – and may write more in-depth articles about some of them down the road – but the outline will follow that of the course. We will begin with how the planet works. This will be followed by the introduction of humans and how we have spread across the planet. There will be articles about how we have impacted our natural resources and the climate. And we will end with some suggested methods for solving some of the problems. I am not expecting a lot of people to follow this – but I hope you will. And I hope some positive change will come from it. Let’s begin…
Climate articles from 2024
Another Look at Climate Change – Part 1 Introduction
https://blogs.ifas.ufl.edu/escambiaco/2024/06/20/another-look-at-climate-change-part-1-introduction/.
Another Look at Climate Change – Part 2 How Might the Earth’s Temperature and Climate Change in the Future?
https://blogs.ifas.ufl.edu/escambiaco/2024/06/25/another-look-at-climate-change-part-2-how-might-the-earths-temperature-and-climate-change-in-the-future/.
Another Look at Climate Change – Part 3 What are Some Possible Effects of a Warmer Atmosphere?
https://blogs.ifas.ufl.edu/escambiaco/2024/07/03/another-look-at-climate-change-part-3-what-are-some-possible-effects-of-a-warmer-atmosphere/.
Another Look at Climate Change – Part 4 What Can Be Done?
https://blogs.ifas.ufl.edu/escambiaco/2024/07/08/another-look-at-climate-change-part-4-what-can-be-done/.
by Rick O'Connor | Jan 24, 2025
What are meroplankton? How do they differ from regular plankton?
In the plankton world there are those that are plankton (drifters) their whole lives – holoplankton – and those who are plankton for only part of their lives – meroplankton. Most know the meroplankton as larva – the early stages of large creatures like fish, crabs, and shrimp. When you pull a plankton net through the waters of the Gulf of Mexico you will collect a lot of meroplankton – and yes… they are food for the plankton feeders just as the other forms of plankton are. Like most of the holoplankton, most are microscopic and swim through the water using cilia or flagella. Like copepods, they are multicellular and are considered true animals. Here are a few that you could find in a plankton sample…
Planula larva
These are the larva of jellyfish, sea anemones, and corals. They are ciliated cells that move through the water column until they metamorphose into the adult forms. Most will settle out on hard substrate on the seafloor and develop into a flower-like structure called a polyp. Some grow into adult polyps – like sea anemones and corals – while others will go through a second stage and become swimming medusa – the jellyfish.
Trochophore larva
This is another ciliated larval form that is the first stage of some mollusk, annelid worms, and nemertean worms.
Veliger larva
This is a ciliated larval form of several mollusk. Those that go through the veliger stage begin as trochophores. Some go through the trochophore stage while in the egg, others hatch and go through the trochophore before metamorphosizing into the veliger. The veliger stage will develop the characteristic mollusk shell, and many will develop a foot which can be used in locomotion on the seafloor searching for suitable habitat.
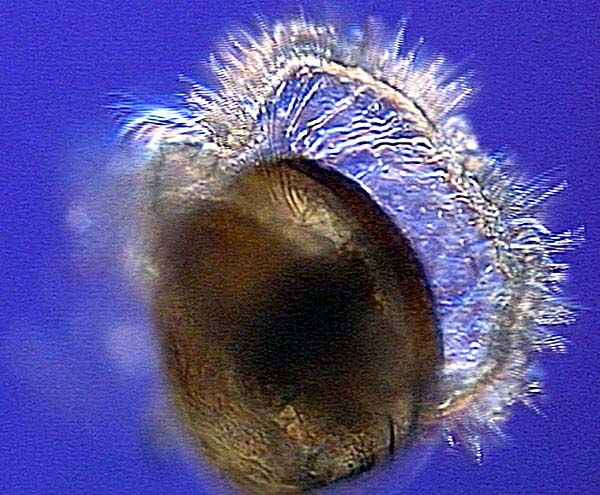
The veliger stage of many mollusks.
Photo: NOAA.
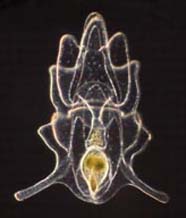
Nauplius larva
This is the first stage of a crustacean. It is very hard to tell which crustacean the nauplius will become but they do resemble crustaceans with segmented body parts and an exoskeleton. Most crustaceans will molt into the zoea stage, and some then into a megalops stage, before becoming the adult.
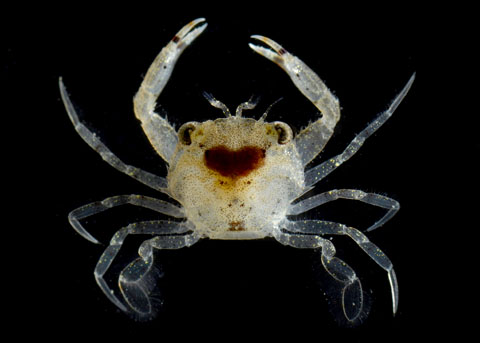
This is the megalops stage of a crab.
Photo: University of California Irvine.
Bipinnaria larva
Another ciliated larval form that will eventually become an echinoderm – starfish, sea urchin, sand dollar.
Bipannaria are the larval stage of starfish and sand dollars.
Photo: NOAA.
Ichthyoplankton
Most of the fishes in the northern Gulf of Mexico begin life as meroplankton as well – these are called “ichthyoplankton” and are quite abundant in a plankton sample. Even large fish, such billfish and swordfish, begin life at this stage.
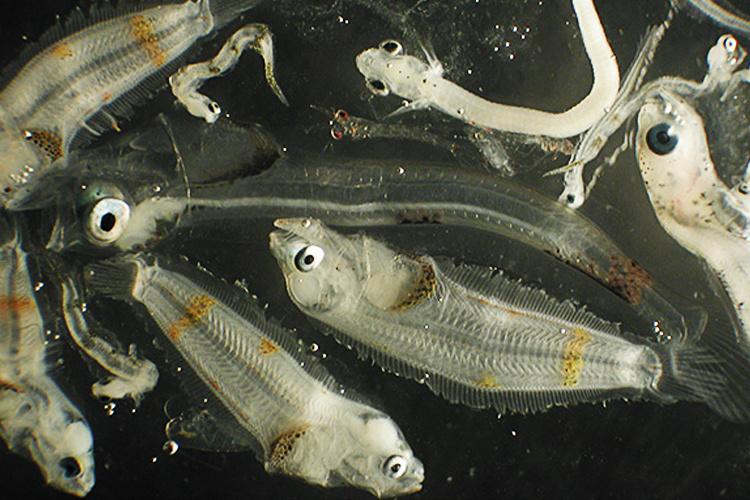
Most fish in the northern Gulf begin their lives as tiny plankton.
Photo: NOAA.
The first nine post in this series have been about microscopic creatures found in the northern Gulf. It goes without saying that there are literally thousands of other forms of plankton we did not mention. It is also important to mention how important these creatures are to the health of the Gulf and why they were as much of a concern during the oil spill as were dolphins, sea turtles, and sea birds. As the plankton go… so goes the Gulf. We will now turn our attention to the larger creatures – ones you do not need a microscope to see.
