by Rick O'Connor | Dec 22, 2025
Though encounters with Eastern Diamondback Rattlesnakes are rare, bites from them are even more rare, and deaths from those bites almost nonexistent, it is worth discussing the issues and remedies of a bite.

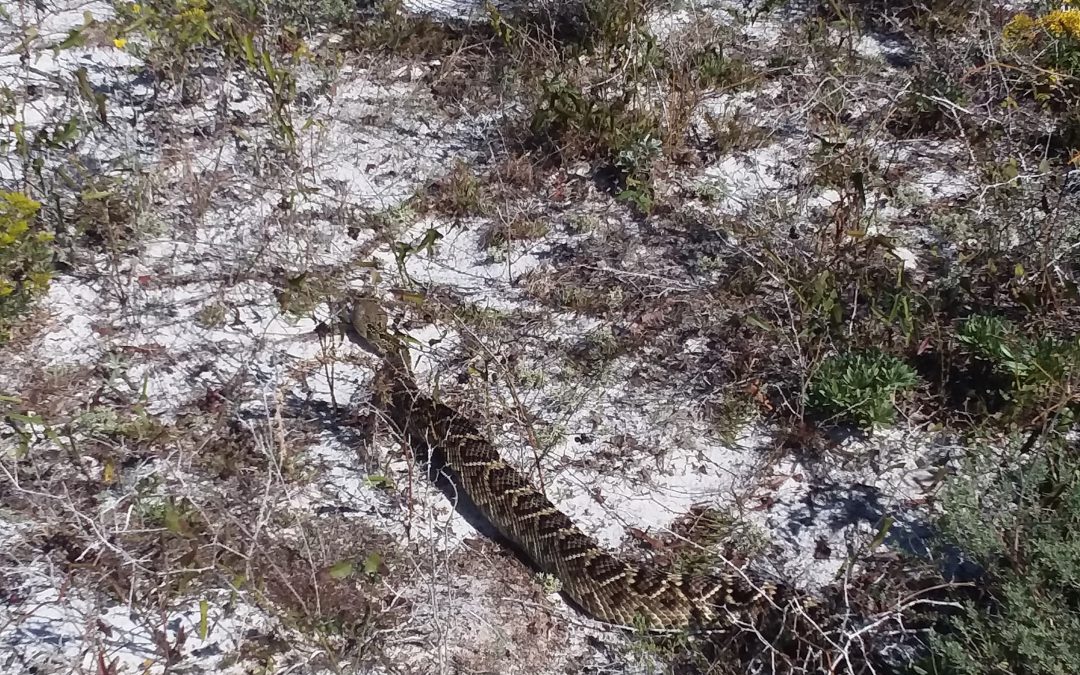
The eastern diamondback rattlesnake is a classic serpent found in xeric habitats like barrier islands and deserts. They can be found in all habitats on barrier islands.
Photo: Bob Pitts
About 8000 people are bitten by snakes each year in the U.S. and Canada. Most are on the hands of men who were engaging the snake. 95% of those bitten are trying to either catch or kill them. Annually less than 12 people die from some species of rattlesnake bite. Many are young or old, with a suppressed immune system or pre-existing medical condition. Many who die, for whatever reason, refused medical treatment.
Most lethal bites are those that reach the heart or brain. However most bites are on the extremities where tissue and nerve damage can occur, but death is less likely. One reason some may refuse medical treatment is cost. Antivenin treatments are expensive. Typical bites may require 4-6 vials and costs were between $1500-$3500/vial in 2010. Add to this the cost of hospital stays, and you can see how expensive it can be.
Another reason given as to why medical attention was not sought is the fact that many venomous snakes will give what is called a “dry bite”. As mentioned in earlier articles, snake venom is “expensive” for snakes to produce, and it is intended for prey – not predators. Rattlesnakes will often give what is called a “bluff bite” – striking with their head but not even opening their mouths. The injection of venom is a voluntary action by the snake, and they may choose to inject very little, if any, venom even if the fangs penetrate. It is believed that about 50% of the rattlesnakes are dry bites. That said, you should never gamble on whether you received venom or not, you should go to the hospital.
The venom itself is a cocktail of proteins, polypeptides, digestive enzymes, and other compounds. It is basically modified salvia – which already includes some digestive enzymes. Myotoxins are a large component of rattlesnake venom. Myotoxins attack muscle tissue, cause pain, discoloration, minor bleeding, and swelling. This can be accompanied by chills, sweats, dizziness, disorientation, tingling and numbness of mouth and tongue, metallic taste, vomiting, diarrhea, bloody stools, alternating blood pressure and heart rates, blurred vision, muscle spasms, and neurotoxins can paralyze diaphragm leading to asphyxiation.
To avoid envenomation problems wear closed-toed shoes when hiking in rattlesnake territory. Do not extend your hand into brushy/grassy areas – use your hiking stick instead. Watch stepping over, or sitting on, logs and stumps without close surveying. Do not touch dead rattlesnakes, if not dead long, they can still bite. Carry a cell phone.
What to do if bitten…
Call 911.
Call poison control if you have their number.
Get to a hospital.
Remove rings, watches, etc. – swelling will occur.
Keep bite at, or below, heart level.
Remain calm.
What NOT to do if bitten…
Do not cut the wound.
Do not suck venom out.
Do not apply a tourniquet.
Do not apply ice.
Do not drink alcohol.
Do not use electroshock treatment.
Envenomation from an eastern diamondback rattlesnake is a scary thing. However, there are many ways to avoid this problem, and there is basic treatment if you are. Remember few people are bitten, and very few die. Get medical attention as soon as you can.
References
Rubio, M. 2010. Rattlesnakes of the United States and Canada. ECO Herpetological Publishing & Distribution. Rodeo, New Mexico. pp. 307.
Gibbons, W., Dorcas, M. 2005. Snakes of the Southeast. The University of Georgia Press. Athens, Georgia. pp. 253.
Graham, S.P. 2018. American Snakes. John’s Hopkins University Press. Baltimore, Maryland. pp. 293.
by Rick O'Connor | Dec 15, 2025
As many of you know, Escambia County Extension logs snakes people encounter when out and about during their day. We do not send people out to look for them but rather log those that people encounter when doing their normal activity. The objective of this project is to educate the public about which snakes people typically encounter, when they encounter them, and where.
The number of reports was down in 2025. We are not sure whether this was due to fewer people reporting, or whether there were fewer snakes encountered. Some who regularly report have told me they have not seen as many snakes this year. If this is the case it could be due to the snow event we had in the winter, the intense heat of this past summer, and the drought we have witnessed this summer/fall. We are not sure.
Of the 40 known species that inhabit the Pensacola Bay area – 19 were encountered this year. This compares to other years as follows –
| Year |
No. of Species Encountered |
| 2022 |
21 |
| 2023 |
24 |
| 2024 |
21 |
| 2025 |
19 |
Based on this people typically encounter about 50% of the species that live here. This year we were slightly below that at 47%.
Broken down by size classes we have the following for 2025…
| Size class |
No. of species known |
No. of species encountered |
Most common |
| Small (<12”) |
7 |
3 |
Florida Red-bellied Pine woods snake |
| Medium (12-24”) |
8 |
5 |
Eastern ribbon snake |
| Large (>24”) |
7 |
5 |
Southern black racer |
| Water Snakes |
13 |
2 |
Banded water snake |
| Venomous |
4 |
3 |
Cottonmouth |
| Non-native |
1 |
1 |
Brahminy blind snake |
| TOTAL |
40 |
19 |
Ribbon snake Southern black racer |
Small Snakes
First, small snakes are small; thus, more difficult to see. Most are encountered in gardens and landscaping. They are mostly nocturnal. This year the most common were both the Florida red-bellied snake and the Pine woods snake (both had 3 encounters). When compared to previous years…
| Year |
Most common small snake encountered |
| 2022 |
Southern ring-necked snake (3) |
| 2023 |
Rough earth snake (2) |
| 2024 |
Southern ring-necked snake (5) |
| 2025 |
Pine woods snake, Florida red-bellied snake (3) |
Medium Snakes
Some species in this group are the most frequently encountered snakes by residents. Like small snakes, most are encountered in gardens and landscaping. This year the Eastern ribbon snake. Not only was it the most encountered medium sized snake, but it also tied for the most common snake encountered all year. As you can see from the numbers below, this snake was encountered more frequently this year than others in the past.
| Year |
Most common medium snake encountered |
| 2022 |
Eastern ribbon snake (13) |
| 2023 |
Eastern garter snake (17) |
| 2024 |
Eastern garter snake (15) |
| 2025 |
Eastern ribbon snake (23) |
Large Snakes
There are 7 species of large snakes in the bay area and between 5-6 are encountered every year. Most likely this is because they are large, and easier to see. This year, like most years, the most encountered species is the Southern black racer. This snake does not mind humans and is often found in our neighborhoods and common in public areas as well. As you can see below, this is by far the most commonly encountered large snake and is one of the top three most common snakes encountered each year. This is a very common snake.
| Year |
Most common large snake encountered |
| 2022 |
Southern black racer (21) |
| 2023 |
Southern black racer (35) |
| 2024 |
Southern black racer (28) |
| 2025 |
Southern black racer (23) |
Water Snakes
There are more species of water snakes (13) than any other group. But they are some of the most infrequent snakes encountered in our area. This is most likely because several species only inhabit wetland/riverine systems where few residents venture. Other than the banded water snake, most other encounters have been reported by fishermen fishing on our rivers. This year, as every year, the Banded water snake was the most frequently encountered water snake. This is one of the top three most frequently encountered snakes each year. This is a very common snake here.
| Year |
Most common water snake encountered |
| 2022 |
Banded water snake (3) |
| 2023 |
Banded water snake (26) |
| 2024 |
Banded water snake (22) |
| 2025 |
Banded water snake (18) |
Venomous Snakes
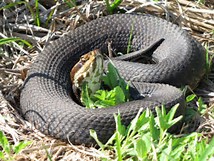
There are only six venomous snakes reported in all of Florida. That is six out of a possible 46-48 species/subspecies (depending on which guidebook you use). All six have been reported in the Florida panhandle. Two of them only in the Florida panhandle – and they are both rare here; those being the copperhead and the timber rattlesnake. So actually, only four of the six venomous snakes have a good chance of being encountered: those being the cottonmouth, eastern diamondback rattlesnake, pygmy rattlesnake, and the eastern coral snake. Each year at least three of these are encountered. In 2023 all four were. Though each species has been encountered, other than the cottonmouth, the others are not encountered frequently. Encounters with the eastern coral snakes are particularly rare. That is not to say they are not common here, they are just not encountered very often, and that is fine with most people. Like the previous years, the most frequently encountered venomous snake is the Cottonmouth. Not only is the most frequent venomous snake, but it is also one of the top three most frequently encountered snakes overall. Cottonmouths are quite common here. The reason we may encounter it more often is because of its love of water – and most of us live near some source of water. The rattlesnakes prefer high dry semi-opened woodlands away from people. Coral snakes like more dense wooded areas; and almost every encounter of this snake has been in the Gulf Breeze area. However, they are found throughout the bay area.
| Year |
Most common venomous snake encountered |
| 2022 |
Cottonmouth (15) |
| 2023 |
Cottonmouth (52) |
| 2024 |
Cottonmouth (38) |
| 2025 |
Cottonmouth (21) |
Non-native Snakes
There is only one reported non-native snake in the Pensacola Bay area; the Brahminy blind snake – also known as the “flowerpot snake”. This Asian snake is about the length and diameter of a toothpick. It is blue to gray in color, and the tiny black eyes are barely visible. It is, for the most part, blind, and does not seem to be invasive. Most who encounter this snake are gardening or working in landscaping. I have them in my yard, and they are pretty common. Most who first see it will confuse it with a worm, until you notice the scaled body – then you know you are not dealing with a worm.
| Year |
# of Brahminy blind snakes encountered |
| 2022 |
0 |
| 2023 |
5 |
| 2024 |
2 |
| 2025 |
2 |
Number of Encounters by Species by Year
| Species |
2022 |
2023 |
2024 |
2025 |
TOTAL |
| Rough earth snake |
|
2 |
2 |
|
4 |
| Smooth earth snake |
|
|
|
1 |
1 |
| Marsh brown snake |
|
|
|
|
|
| Florida red-bellied snake |
1 |
5 |
4 |
3 |
13 |
| Southeastern crowned snake |
|
1 |
1 |
|
2 |
| Pine woods snake |
2 |
2 |
|
3 |
7 |
| Southern ring-necked snake |
3 |
5 |
1 |
|
9 |
| Scarlet snake |
|
3 |
1 |
1 |
5 |
| Rough green snake |
1 |
1 |
3 |
2 |
7 |
| Eastern ribbon snake |
13 |
10 |
9 |
23 |
55 |
| Eastern garter snake |
3 |
17 |
15 |
5 |
40 |
| Eastern hognose |
1 |
2 |
|
1 |
4 |
| Southern hognose snake |
|
|
|
|
|
| Mole kingsnake |
|
|
|
|
|
| Scarlet kingsnake |
|
|
1 |
|
1 |
| Eastern kingsnake |
1 |
1 |
2 |
2 |
6 |
| Florida pine snake |
|
2 |
|
|
2 |
| Gray rat snake |
3 |
9 |
11 |
7 |
30 |
| Corn snake |
3 |
7 |
5 |
6 |
21 |
| Southern black racer |
21 |
35 |
28 |
23 |
107 |
| Eastern coachwhip |
5 |
12 |
17 |
4 |
38 |
| Eastern indigo snake |
|
|
|
|
|
| Black swamp snake |
1 |
|
|
|
1 |
| Glossy crayfish snake |
1 |
|
|
|
1 |
| Queen snake |
|
|
|
|
|
| Midland water snake |
1 |
|
|
|
1 |
| Banded water snake |
3 |
26 |
22 |
18 |
69 |
| Gulf salt marsh snake |
|
3 |
2 |
|
5 |
| Yellow bellied water snake |
|
|
|
|
|
| Diamondback water snake |
|
|
|
1 |
1 |
| Brown water snake |
2 |
4 |
|
|
6 |
| Eastern green water snake |
|
3 |
1 |
|
4 |
| Western green water snake |
1 |
|
|
|
1 |
| Eastern/Western mud snake |
|
|
|
|
|
| Rainbow snake |
|
|
|
|
|
| Copperhead |
|
|
|
|
|
| Cottonmouth |
15 |
52 |
38 |
21 |
126 |
| Timber rattlesnake |
|
|
|
|
|
| Eastern diamondback rattlesnake |
5 |
8 |
11 |
8 |
32 |
| Pygmy rattlesnake |
5 |
6 |
1 |
|
12 |
| Eastern coral snake |
|
1 |
|
2 |
3 |
| Brahminy blind snake |
|
5 |
1 |
2 |
8 |
| TOTAL |
91 |
222 |
176 |
133 |
622 |
Discussion
The first statement is that 30 of the 40 known species found in the area have been encountered at least once. That is 75%. Most are medium sized to large sized snakes. There are only two species that have been encountered 100+ times over the last four years; those are Cottonmouth (126) and the Southern black racer (107). These are followed by two snakes that have been encountered between 50-100 times; those are the Banded water snake (69) and Eastern ribbon snake (55).
Those encountered between 25-50 times include:
Eastern garter snake (40)
Eastern coachwhip (38)
Eastern diamondback rattlesnake (32)
Gray rat snake (30)
Those encountered between 10-25 times include:
Corn snake (20)
Florida red-bellied snake (13)
Pygmy rattlesnake (12)
Those encountered between 2-10 times include:
Southern ring-necked snake (9)
Brahminy blind snake (8)
Pine woods snake (7)
Rough green snake (7)
Eastern kingsnake (6)
Brown water snake (6)
Gulf salt marsh snake (5)
Scarlet snake (5)
Rough earth snake (4)
Eastern hognose (4)
Eastern green water snake (4)
Eastern coral snake (3)
Southeastern crowned snake (2)
Florida pine snake (2)
Some of these species have populations of concern, and it is good they have been seen.
Those only seen ONCE in four years include:
Smooth earth snake (1) question identification – could have been rough earth snake
Scarlet kingsnake (1)
Black swamp snake (1)
Glossy crayfish snake (1)
Midland water snake (1)
Diamondback water snake (1)
Western green water snake (1)
Most of these are water snakes that live in habitats which few people visit. Others are smaller and harder to find.
AND THEN THOSE SPECIES THAT HAVE YET TO BE ENCOUNTERED IN FOUR YEARS.
Marsh brown snake
Southern hognose snake1
Mole kingsnake
Eastern indigo snake1
Queen water snake
Yellow bellied water snake
Eastern/Western mud snake
Rainbow snake2
Copperhead3
Timber rattlesnake3
1 species that are currently listed, or species of concern, and are rare in general.
2 species considered rare and under consideration of listing.
3 species that are common further north, but not as much in Florida.
We would like to thank all of you who have reported encounters in the Pensacola Bay area to myself. If you would like to participate, or have any questions, please contact me at Rick O’Connor – roc1@ufl.edu.

by Dana Stephens | Nov 17, 2025
What are PFAS?
PFAS are per- and polyfluoroalkyl substances. PFAS is a class of chemicals found in various industrial and consumer goods. For instance, you may find them in food packaging, textiles, cosmetics, and frequently in aqueous film-forming foams (AFFFs) used to extinguish fires. PFAS chemicals are known for repelling grease, water, and stains, making them widely used in various applications. These chemicals are stable and persistent, earning them the nickname “forever chemicals” because they do not readily biodegrade, or break down easily in the environment.
Numerous researchers suggested PFAS are abundant in aquatic systems and toxic to a range of aquatic organisms, with additional concerns of bioaccumulation of PFAS. PFAS accumulate in sediments and aquatic organisms, which pose health risks to wildlife and humans through the food chain. Research suggests linkages of PFAS to disruption of endocrine function, reproduction, and development in aquatic organisms. Research suggests similar linkages of PFAS to humans, like increased cancer risk, immune system suppression, endocrine and reproductive disruption, and child developmental concerns.
The United States Geological Survey (USGS) estimated that at least 45% of the United States’ tap water has one or more PFAS chemicals (Smalling et al. 2023). At least one PFAS was identified in 60% of public wells and 20% of domestic wells supplying drinking water in the eastern United States (McMahon et al. 2022).
Have PFAS been found in Santa Rosa County drinking water and surface waters?
Measured PFAS in Florida and Santa Rosa County Drinking Waters
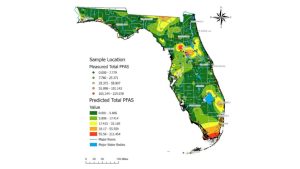
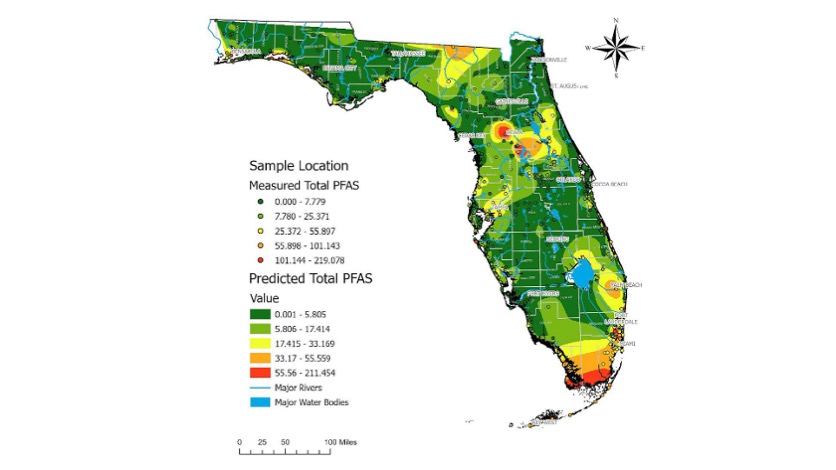
Figure 1. Map with measured total PFAS in drinking water samples across a gradient of low concentrations (green dots) to medium concentrations (yellow dots) to higher concentrations (red dots). Shaded map colors are the predicted total PFAS using estimated values of PFAS concentrations from low (green) to high (red). Data, figure, and result interpolation from Sinkway et al. 2024.
A team of researchers completed a comprehensive statewide assessment of PFAS in Florida drinking water (Sinkway et al. 2024). The team collected 448 drinking water samples across all 67 Florida counties. The drinking water samples were analyzed for 31 PFAS, where 19 PFAS were found in at least one drinking water sample. The top five most frequently detected PFAS across Florida were 6:2 fluorotelomer sulfonate (6:2 FTS) (in 84% of the samples analyzed), Perfluorooctanoic acid (PFOA) (65%), linear perfluorooctane sulfonate (PFOS) (65%), branched PFOS (64%), and perfluorobutane sulfonic acid (PFBS).
A total of 107 taps had PFOA or PFOS concentrations above 4 ng/L (ppt), where the maximum total PFAS concentration in a tap was 219 ng/L. A maximum contaminant level for PFOA and PFOS of 4 ng/L was implemented by the United States Environmental Protection Agency National Primary Drinking Water Regulation as of May 14, 2025 (USEPA, 2025). Overall, 8% of the drinking water samples analyzed exceeded 4 ng/L for PFOA and 16% for PFOS. The average total PFAS in city water was 15.6 ng/L, and in well water was 4.5 ng/L across Florida.
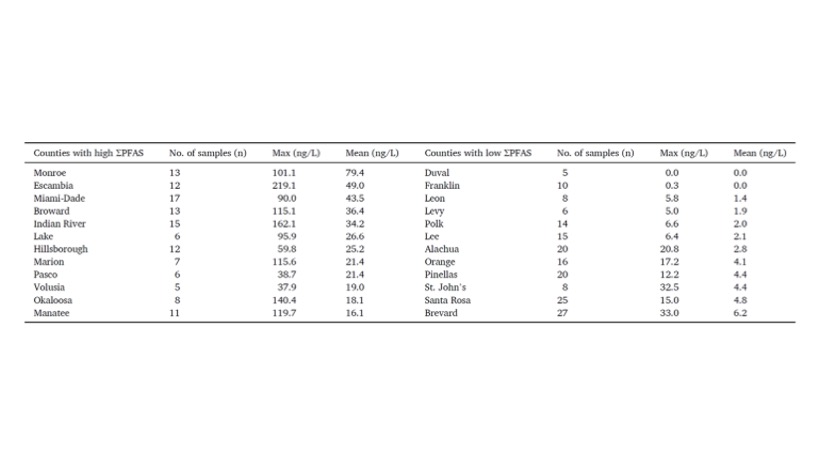
Santa Rosa County was not ranked in the 12 Florida counties with the highest maximum and average total PFAS concentrations (ng/L) or the lowest maximum and average total PFAS concentrations (ng/L) in drinking water (Table 1). Santa Rosa ranked 34th for the highest maximum total PFAS concentration and 35th for the highest average total PFAS concentration among the 67 Florida counties. Among the 25 drinking water samples collected, the maximum total PFAS concentration measured was 15 ng/L with an average total PFAS of 4.8 ng/L among the drinking water samples.

Table 1. The 12 Florida counties with highest and lowest total PFAS drinking water concentrations (ng/L). Data, figure, and result interpolation from Sinkway et al. 2024.
Measured PFAS in Florida and Santa Rosa County Surface Waters
A team of researchers completed a comprehensive statewide assessment of PFAS in Florida surface waters (Camacho et al. 2024). A network of citizen scientists collected 2,323 surface water samples across the 67 Florida counties. These surface water samples were analyzed for 50 PFAS, with 33 PFAS being detected in at least one surface water sample across Florida. The top five most frequently detected PFAS were perfluorooctanoic acid (PFOA) (94% of the samples), perfluorobutane sulfonic acid (PFBS) (65%), perfluorohexanoic acid (PFHxA) (61%), perfluorononanoic acid (PFNA) (54%), and perfluorooctane sulfonate (PFOS) (53%).
There were 915 surface water samples (39%) with PFOA concentrations above 4 ng/L and 920 samples (40%) with PFOS above 4 ng/L. All counties had at least one sample with PFOA, 96% had PFNA, 93% had PFBS, 91% had PFOS, and 82% of counties had PFHxA. The average PFAS detected among counties ranged from 2 ng/L of PFNA to 10 ng/L of PFOS. The maximum PFAS detected among counties ranged from 81 ng/L of PFOA to 1135 ng/L of PFOS.

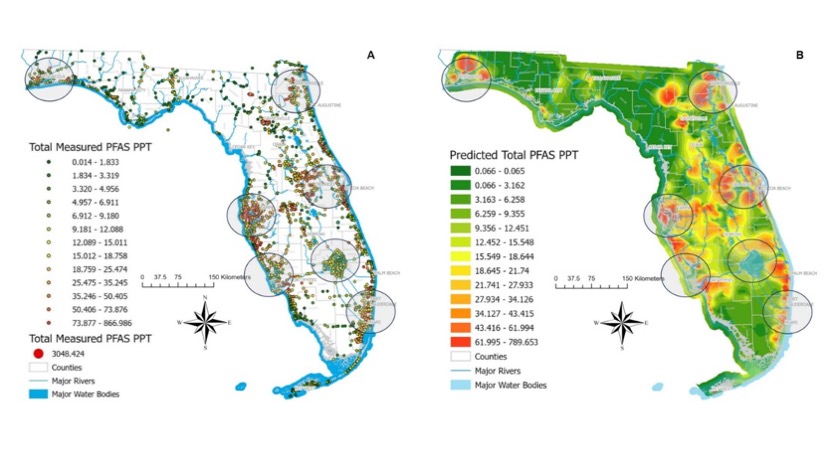
Figure 2. Surface water sampled sites with detected PFAS, where the dots’ color represents the total PFAS concentration measured. Map B shows predicted PFAS levels based on measured total PFAS concentrations in surface water samples. Note that these values do not represent predicted PFAS concentrations on land. Data, figure, and result interpolation from Camacho et al. 2024.
A total of 36 surface water samples were collected in Santa Rosa County (Figure 2). Santa Rosa County ranked 31stamong Florida counties with 7 surface water samples (7 samples out of 36 total or 19%) with PFOA above 4 ng/L. Santa Rosa County ranked 26th for the number of samples with 8 samples (22%) above 4 ng/L for PFOS. The average total PFAS concentration detected in a surface water sample was 6 ng/L, while the maximum total PFAS concentration detected in a sample was 29 ng/L.
Dr. Bowden, with the University of Florida’s College of Veterinary Medicine and Chemistry Department, led the PFAS research shared here. Dr. Bowden has extensive information on the Bowden Lab website (https://www.bowdenlaboratory.com/dr-bowden.html), including an interactive map of all the PFAS surface water samples collected in Florida. Select Okaloosa County under the filter section to see the surface water samples and learn more about the PFAS information for each sample collected in Okaloosa County (https://www.bowdenlaboratory.com/florida-surface-water.html).
What does this mean for Santa Rosa County?
PFAS have been detected in drinking water and surface waters in Santa Rosa County. Although not the highest concentrations across the state, there were drinking and surface water samples exceeding USEPA’s 4 ng/L contaminant level standard. Understanding what PFAS are and joining in educational conversations about PFAS helps our community. Efforts that support continued sampling and extended monitoring also increase our understanding of PFAS concentrations in Santa Rosa County’s drinking and surface waters. If you want to learn more about PFAS or join community scientists’ efforts to expand PFAS water monitoring, please contact Dana Stephens, Florida Sea Grant Extension Agent with the UF/IFAS Okaloosa County Extension Office.
References
Camacho, C.G., et al. 2024. Statewide surveillance and mapping of PFAS in Florida surface waters. American Chemical Society, 4: 434-4355. https://doi.org/10.1021/acsestwater
United States Environmental Protection Agency (USEPA). 2025. Per- and polyfluoroalkyl substances (PFAS) final PFAS national primary drinking water regulation. https://www.epa.gov/sdwa/and-polyfluoroalkyl-substances-pfas
McMahon, P.B., Tokranov, A.K., and Bexfield, L.M. 2022. Perfluoroalkyl and polyfluoroalkyl substances in groundwater used as a source of drinking water in the Eastern United States. Environmental Science and Technology 56(4): 2279-2288. https://doi.org/10.1021/acs.est.1c04795
Skinkway, T.D., et al. 2024. Crowdsourcing citizens for statewide mapping of per- and polyfluoroalkyl substances (PFAS) in Florida drinking water. Science of the Total Environment, 926: 1-9. https://doi.org/10.1016/j.scitotenv.2024.171932
by Dana Stephens | Nov 17, 2025
What are PFAS?
PFAS are per- and polyfluoroalkyl substances. PFAS is a class of chemicals found in various industrial and consumer goods. For instance, you may find them in food packaging, textiles, cosmetics, and frequently in aqueous film-forming foams (AFFFs) used to extinguish fires. PFAS chemicals are known for repelling grease, water, and stains, making them widely used in various applications. These chemicals are stable and persistent, earning them the nickname “forever chemicals” because they do not readily biodegrade, or break down easily in the environment.
Numerous researchers suggested PFAS are abundant in aquatic systems and toxic to a range of aquatic organisms, with additional concerns of bioaccumulation of PFAS. PFAS accumulate in sediments and aquatic organisms, which pose health risks to wildlife and humans through the food chain. Research suggests linkages of PFAS to disruption of endocrine function, reproduction, and development in aquatic organisms. Research suggests similar linkages of PFAS to humans, like increased cancer risk, immune system suppression, endocrine and reproductive disruption, and child developmental concerns.
The United States Geological Survey (USGS) estimated that at least 45% of the United States’ tap water has one or more PFAS chemicals (Smalling et al. 2023). At least one PFAS was identified in 60% of public wells and 20% of domestic wells supplying drinking water in the eastern United States (McMahon et al. 2022).
Have PFAS been found in Walton County drinking water and surface waters?
Measured PFAS in Florida and Walton County Drinking Waters
Figure 1. Map with measured total PFAS in drinking water samples across a gradient of low concentrations (green dots) to medium concentrations (yellow dots) to higher concentrations (red dots). Shaded map colors are the predicted total PFAS using estimated values of PFAS concentrations from low (green) to high (red). Data, figure, and result interpolation from Sinkway et al. 2024.
A team of researchers completed a comprehensive statewide assessment of PFAS in Florida drinking water (Sinkway et al. 2024). The team collected 448 drinking water samples across all 67 Florida counties. The drinking water samples were analyzed for 31 PFAS, where 19 PFAS were found in at least one drinking water sample. The top five most frequently detected PFAS across Florida were 6:2 fluorotelomer sulfonate (6:2 FTS) (in 84% of the samples analyzed), Perfluorooctanoic acid (PFOA) (65%), linear perfluorooctane sulfonate (PFOS) (65%), branched PFOS (64%), and perfluorobutane sulfonic acid (PFBS).
A total of 107 taps had PFOA or PFOS concentrations above 4 ng/L (ppt), where the maximum total PFAS concentration in a tap was 219 ng/L. A maximum contaminant level for PFOA and PFOS of 4 ng/L was implemented by the United States Environmental Protection Agency National Primary Drinking Water Regulation as of May 14, 2025 (USEPA, 2025). Overall, 8% of the drinking water samples analyzed exceeded 4 ng/L for PFOA and 16% for PFOS. The average total PFAS in city water was 15.6 ng/L, and in well water was 4.5 ng/L across Florida.
Walton County was not ranked in the 12 Florida counties with the highest maximum and average total PFAS concentrations (ng/L) in drinking water (Table 1). Walton County was not included in the rankings of Florida counties with the lowest maximum and average total PFAS concentrations (ng/L) in drinking water as the total number of samples (n=3) was below the required 5 total number sample requirement (Table 1). Among the three drinking water samples collected, the maximum PFAS concentration measured was 0 ng/L with an average of 0 ng/L. Walton County had no drinking water samples exceeding the 4 ng/L standard for PFOA.
Table 1. The 12 Florida counties with highest and lowest total PFAS drinking water concentrations (ng/L). Data, figure, and result interpolation from Sinkway et al. 2024.
Measured PFAS in Florida and Walton County Surface Waters
A team of researchers completed a comprehensive statewide assessment of PFAS in Florida surface waters (Camacho et al. 2024). A network of citizen scientists collected 2,323 surface water samples across the 67 Florida counties. These surface water samples were analyzed for 50 PFAS, with 33 PFAS being detected in at least one surface water sample across Florida. The top five most frequently detected PFAS were perfluorooctanoic acid (PFOA) (94% of the samples), perfluorobutane sulfonic acid (PFBS) (65%), perfluorohexanoic acid (PFHxA) (61%), perfluorononanoic acid (PFNA) (54%), and perfluorooctane sulfonate (PFOS) (53%).
There were 915 surface water samples (39%) with PFOA concentrations above 4 ng/L and 920 samples (40%) with PFOS above 4 ng/L. All counties had at least one sample with PFOA, 96% had PFNA, 93% had PFBS, 91% had PFOS, and 82% of counties had PFHxA. The average PFAS detected among counties ranged from 2 ng/L of PFNA to 10 ng/L of PFOS. The maximum PFAS detected among counties ranged from 81 ng/L of PFOA to 1135 ng/L of PFOS.
Figure 2. Surface water sampled sites with detected PFAS, where the dots’ color represents the total PFAS concentration measured. Map B shows predicted PFAS levels based on measured total PFAS concentrations in surface water samples. Note that these values do not represent predicted PFAS concentrations on land. Data, figure, and result interpolation from Camacho et al. 2024.
A total of 18 surface water samples were collected in Walton County (Figure 2). Walton County ranked 51st among Florida counties with one surface water sample (one sample out of 18 total or 5%) with PFOA above 4 ng/L. Walton County ranked 42nd for the number of samples with two samples (11%) above 4 ng/L for PFOS. The average total PFAS concentration detected in a surface water sample was 6 ng/L, while the maximum total PFAS concentration detected in a sample was 29 ng/L.
Dr. Bowden, with the University of Florida’s College of Veterinary Medicine and Chemistry Department, led the PFAS research shared here. Dr. Bowden has extensive information on the Bowden Lab website (https://www.bowdenlaboratory.com/dr-bowden.html), including an interactive map of all the PFAS surface water samples collected in Florida. Select Okaloosa County under the filter section to see the surface water samples and learn more about the PFAS information for each sample collected in Okaloosa County (https://www.bowdenlaboratory.com/florida-surface-water.html).
What does this mean for Walton County?
PFAS were not detected in drinking waters in Walton County. However, the sample size, or the number of samples, was small with three total samples collected and analyzed. PFAS were detected in surface waters in Walton County. Although not the highest concentrations or most frequent identified in Florida, there were surface water samples above USEPA’s 4 ng/L contaminant level standard for PFOA and PFOS.
Understanding what PFAS are and joining in educational conversations about PFAS helps the Walton County community. Efforts that support continued sampling and extended monitoring also increase our understanding of PFAS concentrations in Walton County’s drinking and surface waters. If you want to learn more about PFAS or join community scientists’ efforts to expand PFAS water monitoring, please contact Dana Stephens, Florida Sea Grant Extension Agent with the UF/IFAS Okaloosa County Extension Office.
References
Camacho, C.G., et al. 2024. Statewide surveillance and mapping of PFAS in Florida surface waters. American Chemical Society, 4: 434-4355. https://doi.org/10.1021/acsestwater
United States Environmental Protection Agency (USEPA). 2025. Per- and polyfluoroalkyl substances (PFAS) final PFAS national primary drinking water regulation. https://www.epa.gov/sdwa/and-polyfluoroalkyl-substances-pfas
McMahon, P.B., Tokranov, A.K., and Bexfield, L.M. 2022. Perfluoroalkyl and polyfluoroalkyl substances in groundwater used as a source of drinking water in the Eastern United States. Environmental Science and Technology 56(4): 2279-2288. https://doi.org/10.1021/acs.est.1c04795
Skinkway, T.D., et al. 2024. Crowdsourcing citizens for statewide mapping of per- and polyfluoroalkyl substances (PFAS) in Florida drinking water. Science of the Total Environment, 926: 1-9. https://doi.org/10.1016/j.scitotenv.2024.171932
by Dana Stephens | Nov 17, 2025
What are PFAS?
PFAS are per- and polyfluoroalkyl substances. PFAS is a class of chemicals found in various industrial and consumer goods. For instance, you may find them in food packaging, textiles, cosmetics, and frequently in aqueous film-forming foams (AFFFs) used to extinguish fires. PFAS chemicals are known for repelling grease, water, and stains, making them widely used in various applications. These chemicals are stable and persistent, earning them the nickname “forever chemicals” because they do not readily biodegrade, or break down easily in the environment.
Numerous researchers suggested PFAS are abundant in aquatic systems and toxic to a range of aquatic organisms, with additional concerns of bioaccumulation of PFAS. PFAS accumulate in sediments and aquatic organisms, which pose health risks to wildlife and humans through the food chain. Research suggests linkages of PFAS to disruption of endocrine function, reproduction, and development in aquatic organisms. Research suggests similar linkages of PFAS to humans, like increased cancer risk, immune system suppression, endocrine and reproductive disruption, and child developmental concerns.
The United States Geological Survey (USGS) estimated that at least 45% of the United States’ tap water has one or more PFAS chemicals (Smalling et al. 2023). At least one PFAS was identified in 60% of public wells and 20% of domestic wells supplying drinking water in the eastern United States (McMahon et al. 2022).
Have PFAS been found in Escambia County drinking water and surface waters?
Measured PFAS in Florida and Escambia County Drinking Waters
Figure 1. Map with measured total PFAS in drinking water samples across a gradient of low concentrations (green dots) to medium concentrations (yellow dots) to higher concentrations (red dots). Shaded map colors are the predicted total PFAS using estimated values of PFAS concentrations from low (green) to high (red). Data, figure, and result interpolation from Sinkway et al. 2024.
A team of researchers completed a comprehensive statewide assessment of PFAS in Florida drinking water (Sinkway et al. 2024). The team collected 448 drinking water samples across all 67 Florida counties. The drinking water samples were analyzed for 31 PFAS, where 19 PFAS were found in at least one drinking water sample. The top five most frequently detected PFAS across Florida were 6:2 fluorotelomer sulfonate (6:2 FTS) (in 84% of the samples analyzed), Perfluorooctanoic acid (PFOA) (65%), linear perfluorooctane sulfonate (PFOS) (65%), branched PFOS (64%), and perfluorobutane sulfonic acid (PFBS).
A total of 107 taps had PFOA or PFOS concentrations above 4 ng/L (ppt), where the maximum total PFAS concentration in a tap was 219 ng/L. A maximum contaminant level for PFOA and PFOS of 4 ng/L was implemented by the United States Environmental Protection Agency National Primary Drinking Water Regulation as of May 14, 2025 (USEPA, 2025). Overall, 8% of the drinking water samples analyzed exceeded 4 ng/L for PFOA and 16% for PFOS. The average total PFAS in city water was 15.6 ng/L, and in well water was 4.5 ng/L across Florida.
Escambia County ranked 2nd among the 67 Florida counties for the highest maximum and average total PFAS concentrations (ng/L) or the lowest maximum and average total PFAS concentrations (ng/L) in drinking water (Table 1). Among the 12 drinking water samples collected, the maximum total PFAS concentration measured was 219 ng/L, with an average total PFAS of 49 ng/L among the drinking water samples.
Table 1. The 12 Florida counties with highest and lowest total PFAS drinking water concentrations (ng/L). Data, figure, and result interpolation from Sinkway et al. 2024.
Measured PFAS in Florida and Escambia County Surface Waters
A team of researchers completed a comprehensive statewide assessment of PFAS in Florida surface waters (Camacho et al. 2024). A network of citizen scientists collected 2,323 surface water samples across the 67 Florida counties. These surface water samples were analyzed for 50 PFAS, with 33 PFAS detected in at least one surface water sample across Florida. The top five most frequently detected PFAS were perfluorooctanoic acid (PFOA) (94% of the samples), perfluorobutane sulfonic acid (PFBS) (65%), perfluorohexanoic acid (PFHxA) (61%), perfluorononanoic acid (PFNA) (54%), and perfluorooctane sulfonate (PFOS) (53%).
There were 915 surface water samples (39%) with PFOA concentrations above 4 ng/L and 920 samples (40%) with PFOS above 4 ng/L (Figure 2). All counties had at least one sample with PFOA, 96% had PFNA, 93% had PFBS, 91% had PFOS, and 82% of counties had PFHxA. The average PFAS detected among counties ranged from 2 ng/L of PFNA to 10 ng/L of PFOS. The maximum PFAS detected among counties ranged from 81 ng/L of PFOA to 1135 ng/L of PFOS.
Figure 2. Surface water sampled sites with detected PFAS, where the dots’ color represents the total PFAS concentration measured. Map B shows predicted PFAS levels based on measured total PFAS concentrations in surface water samples. Note that these values do not represent predicted PFAS concentrations on land. Data, figure, and result interpolation from Camacho et al. 2024.
A total of 52 surface water samples were collected in Escambia County. Escambia County ranked 22nd among Florida counties with 14 surface water samples (14 samples out of 52 total or 27%) with PFOA above 4 ng/L. Escambia County ranked 27th for the number of samples, with 7 samples (13%) above 4 ng/L for PFOS. The average total PFAS concentration detected in a surface water sample was 12 ng/L, while the maximum total PFAS concentration detected in a sample was 118 ng/L.
Dr. Bowden, with the University of Florida’s College of Veterinary Medicine and Chemistry Department, led the PFAS research shared here. Dr. Bowden has extensive information on the Bowden Lab website (https://www.bowdenlaboratory.com/dr-bowden.html), including an interactive map of all the PFAS surface water samples collected in Florida. Select Okaloosa County under the filter section to see the surface water samples and learn more about the PFAS information for each sample collected in Okaloosa County (https://www.bowdenlaboratory.com/florida-surface-water.html).
What does this mean for Escambia County?
PFAS were detected in drinking water and surface waters in Escambia County. There were drinking and surface water samples exceeding USEPA’s 4 ng/L contaminant level standard, notably in the 12 collected drinking water samples. Understanding what PFAS are and joining in educational conversations about PFAS helps our community. Efforts that support continued sampling and extended monitoring also increase our understanding of PFAS concentrations in Escambia County’s drinking and surface waters. If you want to learn more about PFAS or join community scientists’ efforts to expand PFAS water monitoring, please contact Dana Stephens, Florida Sea Grant Extension Agent with the UF/IFAS Okaloosa County Extension Office.
References
Camacho, C.G., et al. 2024. Statewide surveillance and mapping of PFAS in Florida surface waters. American Chemical Society, 4: 434-4355. https://doi.org/10.1021/acsestwater
United States Environmental Protection Agency (USEPA). 2025. Per- and polyfluoroalkyl substances (PFAS) final PFAS national primary drinking water regulation. https://www.epa.gov/sdwa/and-polyfluoroalkyl-substances-pfas
McMahon, P.B., Tokranov, A.K., and Bexfield, L.M. 2022. Perfluoroalkyl and polyfluoroalkyl substances in groundwater used as a source of drinking water in the Eastern United States. Environmental Science and Technology 56(4): 2279-2288. https://doi.org/10.1021/acs.est.1c04795
Skinkway, T.D., et al. 2024. Crowdsourcing citizens for statewide mapping of per- and polyfluoroalkyl substances (PFAS) in Florida drinking water. Science of the Total Environment, 926: 1-9. https://doi.org/10.1016/j.scitotenv.2024.171932
by Rick O'Connor | Sep 22, 2025
Introduction
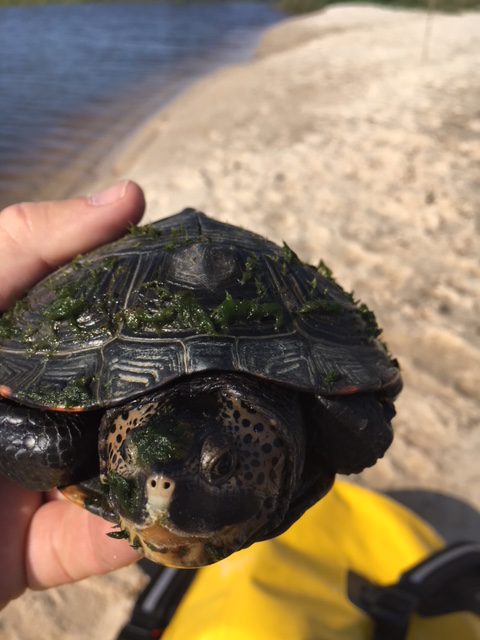
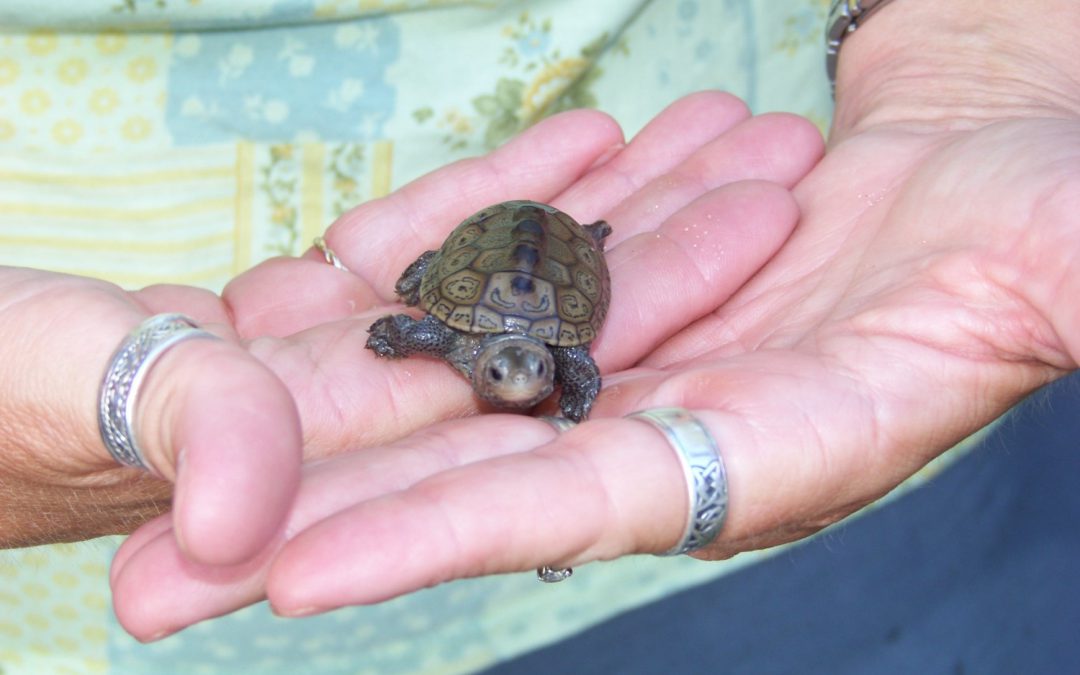
The diamondback terrapin (Malaclemys terrapin) is the only resident turtle within brackish water and estuarine systems in the United States (Fig. 1). They prefer coastal estuarine wetlands – living in salt marshes, mangroves, and seagrass communities. The literature suggests they have strong site fidelity – meaning they do not move far from where they live. Within their habitat they feed on shellfish, mollusk and crustaceans mostly. In early spring they will breed. Gravid females will venture along the shores of the bay seeking a high-dry sandy beach where they will lay a clutch of about 10 eggs. She will typically return to lay more than one clutch each season. Nesting will continue through the summer. Hatching begins mid-summer and will extend into the fall. Hatchings that occur in late fall may overwinter within the nest and emerge the following spring. They live 20-25 years.
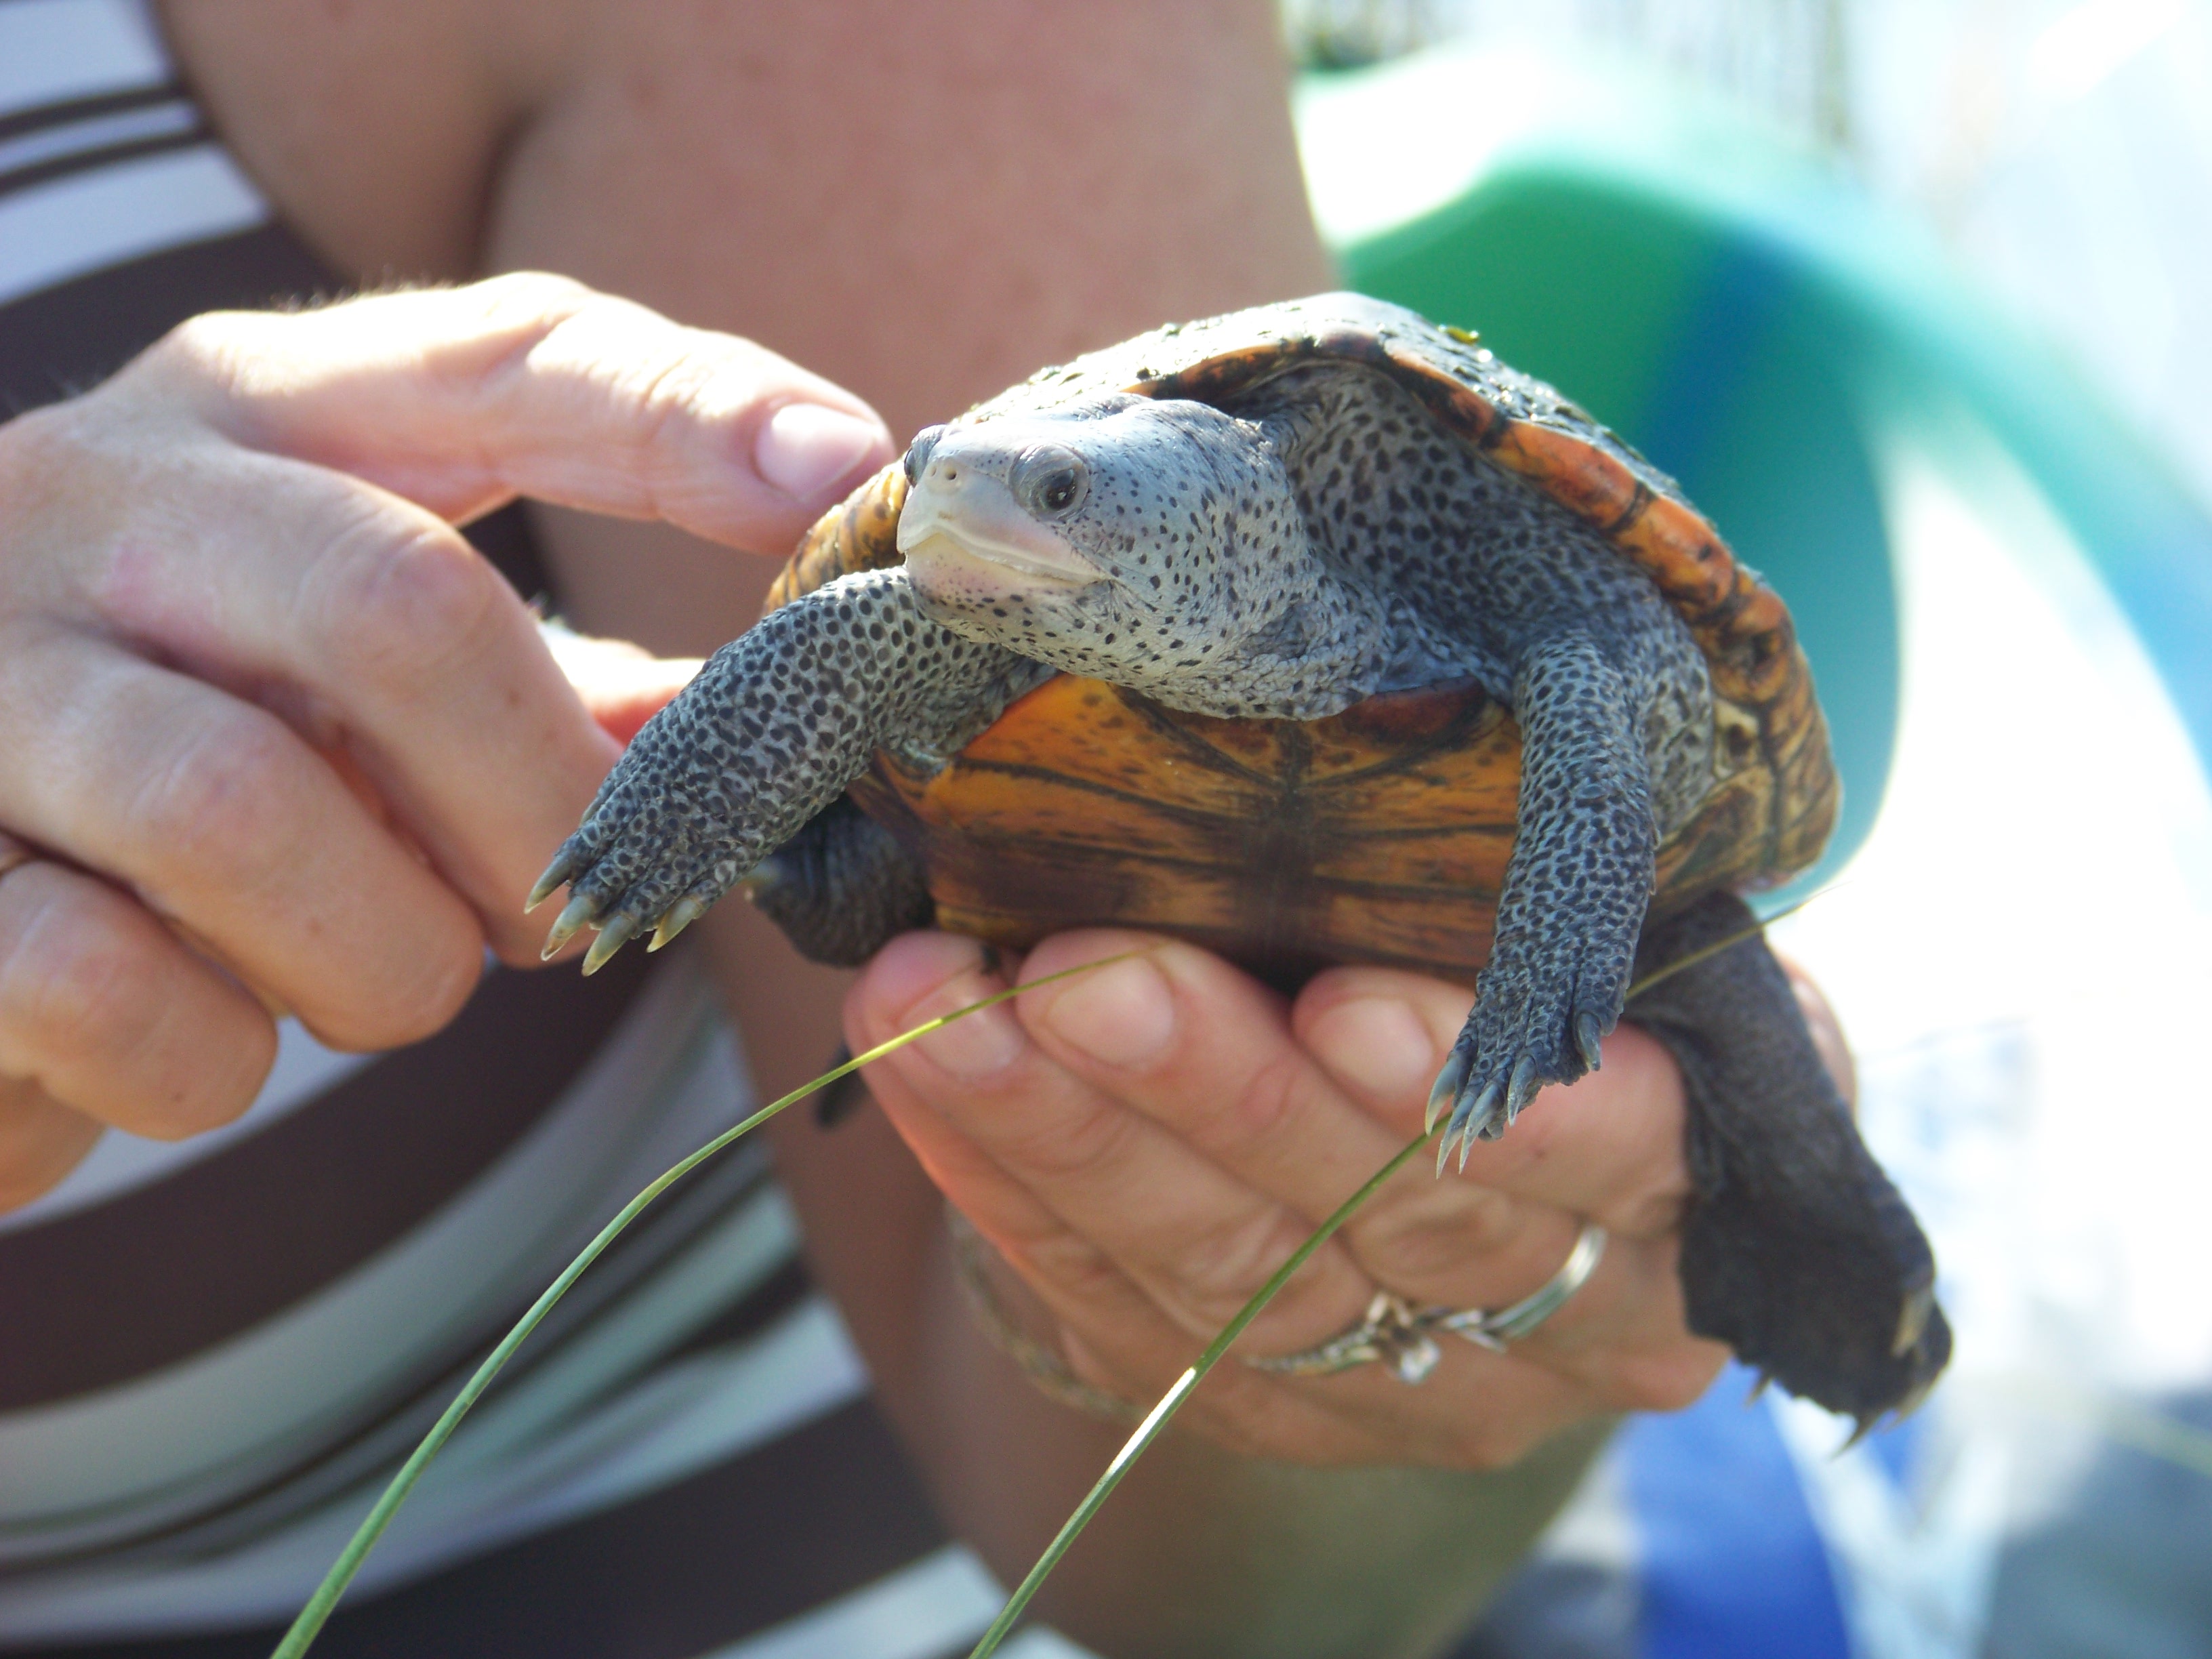
Fig. 1. The diamondback terrapin.
Photo: Molly O’Connor
Terrapins range from Massachusetts to Texas and within this range there are currently seven subspecies recognized – five of these live in Florida, and three are only found in Florida (Fig. 2). However, prior to 2005 their existence in the Florida panhandle was undocumented. The Panhandle Terrapin Project (PTP) was initially created to determine if terrapins did exist here.
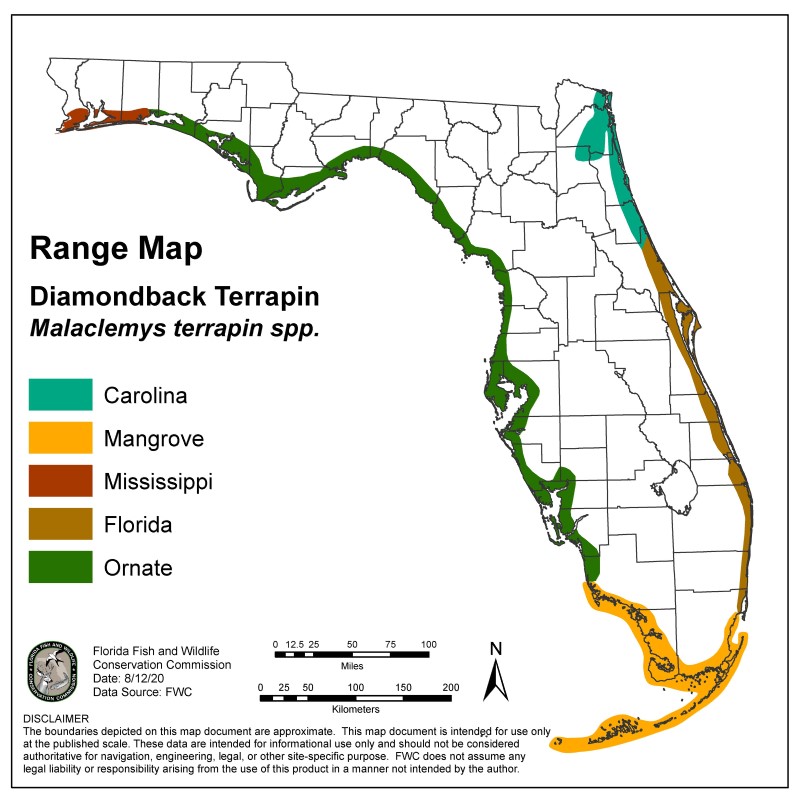
Fig. 2. Terrapins of Florida.
Image provided by FWC
The Scope of the Project
Phase 1
The project began in 2005 using trained volunteers to survey suitable habitat for presence/absence. Presence is determined by locating potential nesting beaches and searching for evidence of nesting. Nesting begins in April and ends in September – with peak nesting occurring in this area during May and June. The volunteers are trained in March and survey potential beaches from April through July. They search for tracks of nesting females, eggshells of nests that were depredated by predators, and live terrapins – either on the beach or the heads in the water. Often volunteers will conduct 30-minute head counts to determine relative abundance. Between 2005 and 2010 the team was able to verify at least one record in each of the panhandle counties.
Phase 2
The next phase is to determine their status – how many nesting beaches does each county have, and how many terrapins are using them? A suitability map was developed by Dr. Barry Bitters as a Florida Master Naturalist project to locate suitable nesting beaches. Volunteers would visit these during the spring to determine whether nesting was occurring, and the relative abundance was determined using what we called the “Mann Method” – developed by Tom Mann of the Mississippi Department of Wildlife, along with the 30-minute head counts. The Mann Method involved counting the number of tracks and depredated nests within a 16-day window. The assumption to this method was that nesting females would lay multiple clutches each season – but they did not lay more than one every 16 days. Going on another assumption, that the sex ratio within the population was 1:1, each track and depredated nest within a 16-day window was a different female and doubling this number would give the relative abundance of adults in this population. Between 2007 and 2023 we were able to determine the number of nesting beaches in each county and relative abundance in three of those counties (see results below).
Phase 3
Partnering with the U.S. Geological Survey, we were able to move to Phase 3 – which involves trapping and tagging terrapins. Doing this gives the team a better idea of where the terrapins are going and how they are using the habitat. To trap the terrapins, we use modified crab traps (modified so that the terrapins had access to air to breath), seine nets, fyke nets, dip nets, and by hand – the most effective has been modified crab traps (Fig. 3). These traps are placed in terrapin habitat over a 3-day period, being checked daily. Any captured terrapins are measured, weighed, sexed, marked using the notch method, and given a Passive Intergraded Transponder (PIT) tag. Some of the terrapins are given a satellite tag where movement could be tracked by GPS (Fig. 4). We are now bringing on acoustic tagging for some counties. This involves placing acoustic receivers on the bottom of the bay which will detect any terrapin (with an acoustic tag) that swims nearby. Results are below.
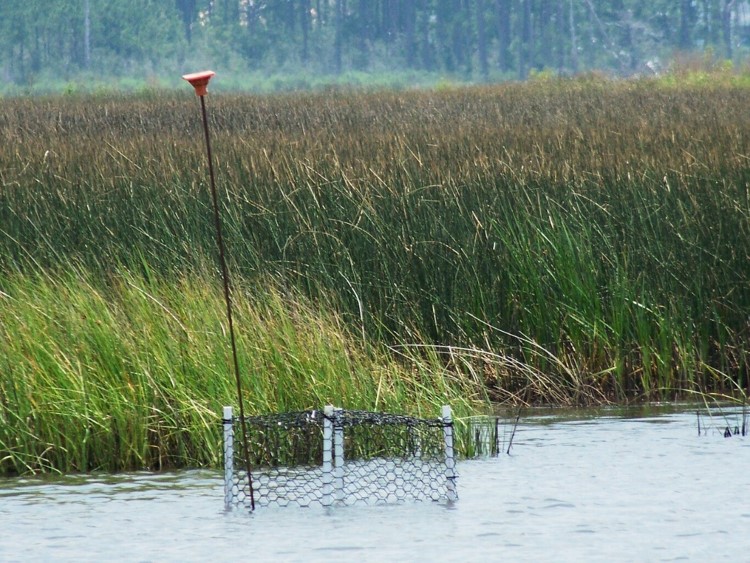
Fig. 3. Modified crab traps is one method used to capture adults.
Photo: Molly O’Connor

Fig. 4. This tag with an antenna can be detected by a satellite and tracked real time.
Photo: USGS
Phase 4
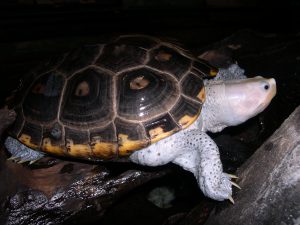
This phase involves collecting tissue samples for genetic analysis. Currently it is believed that the Ornate terrapin (Malaclemys terrapin macrospilota) ranges from Key West to Choctawhatchee Bay, and the Mississippi terrapin (M.t. pileata) ranges from Choctawhatchee Bay to the Louisiana/Texas border. The two subspecies look morphologically different (Fig. 5) and the team believes terrapins resembling the ornate terrapin have been found in Pensacola Bay. Researchers in Alabama have also reported terrapins they believe to be ornate terrapins in their waters as well. The project is now working with a graduate student from the University of West Florida who is genetically analyzing tissue samples from trapped terrapins to determine which subspecies they are and what the correct range of these subspecies. This phase began in 2025, and we do not have any results at this time.

Fig. 5. The Mississippi terrapin found in Pensacola Bay is darker in color than the Ornate terrapin found in other bays of the panhandle.
Photo: Rick O’Connor
Ornate Diamondback Terrapins Depend on Coastal Marshes and Sea Grass Habitats
Photo: Erik Lovestrand.
2025 UPDATE AND RESULTS
In 2025 we trained 188 volunteers across each county – including state park rangers and members of the Florida Oyster Corps. 47 (25%) participated in at least one survey.
We logged 345 nesting surveys and 17 trap days.
No seining or fyke nets were conducted in 2025.
Phase 1 – Presence/Absence Update
| County |
Presence |
Notes |
| Baldwin |
Yes |
A single deceased terrapin was found in western Baldwin County |
| Escambia |
Yes |
Team encountered nesting again this year |
| Santa Rosa |
Yes |
Two new locations were identified this year |
| Okaloosa |
Yes |
Encounters were lower this year |
| Walton |
Yes |
FIRST EVIDENCE OF NESTING IN WALTON COUNTY VERIFIED THIS YEAR |
| Bay |
Yes |
FIRST EVIDENCE OF NESTING IN BAY COUNTY VERIFIED THIS YEAR |
| Gulf |
Yes |
Team encountered nesting again this year |
| Franklin |
ND |
ND |
Phase 2 Nesting Survey – Update
| County |
# of primary beaches1 |
# of secondary beaches2 |
# of surveys |
# of encounters |
FOE3 |
| Baldwin |
0 |
TBD |
14 |
04 |
.00 |
| Escambia |
2 |
35 |
99 |
7 |
.07 |
| Santa Rosa |
3 |
45 |
137 |
25 |
.18 |
| Okaloosa |
4 |
3 |
20 |
1 |
.05 |
| Walton |
1 |
4 |
28 |
2 |
.07 |
| Bay |
3 |
3 |
47 |
14 |
.30 |
| TOTAL |
13 |
17 |
345 |
49 |
.14 |
1 primary beaches are defined as those where nesting is known to occur.
2 secondary beaches are defined as those where potential nesting is high but has not been confirmed.
3 FOE (Frequency of Encounters) is the number of terrapin encounters / the number of surveys conducted.
4 There was one deceased terrapin found by a tour guide in Baldwin County but was not part of the project.
5 There are potential nesting sites on Pensacola Beach that are technically in Escambia County but covered by the Santa Rosa team. The Escambia team focused on the Perdido Key area.
Phase 3 Trapping/Tagging Update
We currently have 8 years of data.
Terrapins have been tagged in 7 of the 8 panhandle counties.
1483 captures, 1061 individuals.
2025 Capture Effort
| Method |
County |
Number |
Description |
Condition |
| Hand capture |
Escambia |
1 |
1 adult male |
Deceased |
| Hand capture |
Santa Rosa |
5 |
4 adult females
1 unknown |
Released, deceased |
| Hand capture |
Okaloosa |
1 |
1 adult female |
Released |
| Dip Net |
Santa Rosa |
1 |
1 adult male |
Released |
| Crab Traps |
Santa Rosa |
34 |
4 juvenile females
5 adult females
25 adult males |
Released |
|
Okaloosa |
4 |
1 juvenile female
3 adult males |
Released |
| TOTAL |
|
46 |
5 juvenile females
10 adult females
30 adult males
1 unknown |
|
Preliminary information subject to revision. Not for citation or distribution.
Satellite Tagging Information
Due to the size of the tags – only large females are satellite tagged at this time.
Big Momma – tracked for 188 days – averaged 0.16 miles.
Big Bertha – tracked for 137 days – averaged 35.83 miles.
2025 Tracking Effort
| County |
Tagging Effort |
| Santa Rosa |
2 satellite tagged
6 acoustically tagged |
| Okaloosa |
1 satellite tagged |
| TOTAL |
8 tagged for tracking |
Phase 4 Update
This phase began in 2025 and there are no results at this time.
Summary
2025
17 trainings were given in 7 of the 8 counties of the Florida panhandle (including Baldwin County AL).
188 were trained; 47 (25%) conducted at least one survey.
345 surveys were logged; terrapins (or terrapin sign) were encountered 49 (14%) of those surveys.
Every county had at least one encounter during a nesting survey.
17 trapping days were conducted; 46 terrapins were captured; 37 (83%) were captured in modified crab traps; 7 were captured by hand; 1 was captured in a dip net.
8 terrapins were tagged for tracking; 6 acoustically; 2 with satellite tags.
Since 2007
511 have been trained.
1449 surveys have been logged; 347 encounters have occurred; Frequency of Encounters is 24% of the surveys.
Discussion
Phase 1
We have shown that diamondback terrapins do exist in the Florida panhandle and in Baldwin County AL.
Phase 2
We currently have 13 primary nesting beaches we are surveying weekly during nesting season across the panhandle. There were 17 secondary nesting beaches surveyed and most likely there are many more to visit. Nesting seems to be more common in late spring, but the Frequency of Encounters has been declining since 2023. This could be due to less terrapin activity but could also be due to evidence being difficult to find. We will continue to monitor to see how this trend continues.
Phase 3
The team has captured 1483 terrapins, the majority of which were from the eastern panhandle. Satellite tagged females suggest more than one has traveled over 30 miles from where they were tagged. This goes against the idea that terrapins have strong site fidelity. However, all the terrapins tagged were large females (due to size of the tags) so we are looking at the movements of only the larger females – not the population as a whole. The movements of these females also suggest they may use seagrass beds as much as the salt marshes.
Training for volunteers occurs in March of each year. If you are interested in participating, contact Rick O’Connor – roc1@ufl.edu.