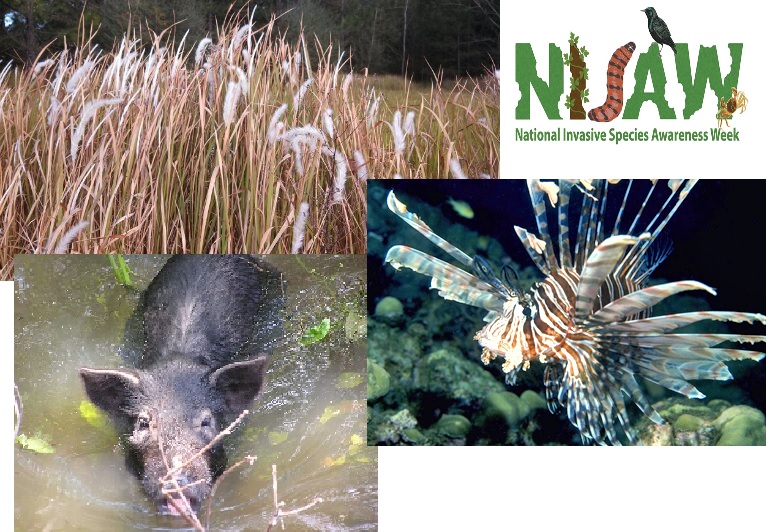
National Invasive Species Awareness Week (NISAW) is a national initiative where agencies and organizations provide information on invasive species issues to decision and policy makers. It can also be a time where we provide that information to the general public.
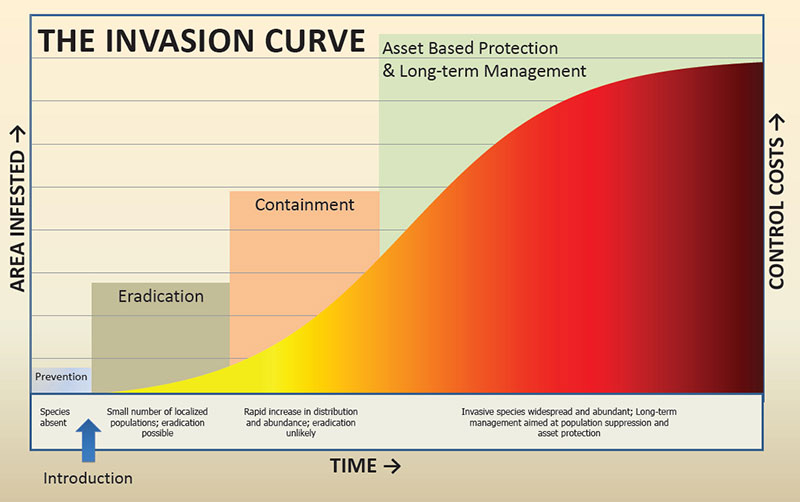
Invasive species are a global problem threatening biodiversity everywhere. Many create economic problems for the communities they invade, and management can be costly. The University of South Florida has estimated the cost to be around $21 billion a year in the U.S. alone. The most effective method of management is to detect the invader early and respond rapidly.
The Invasive Species Curve
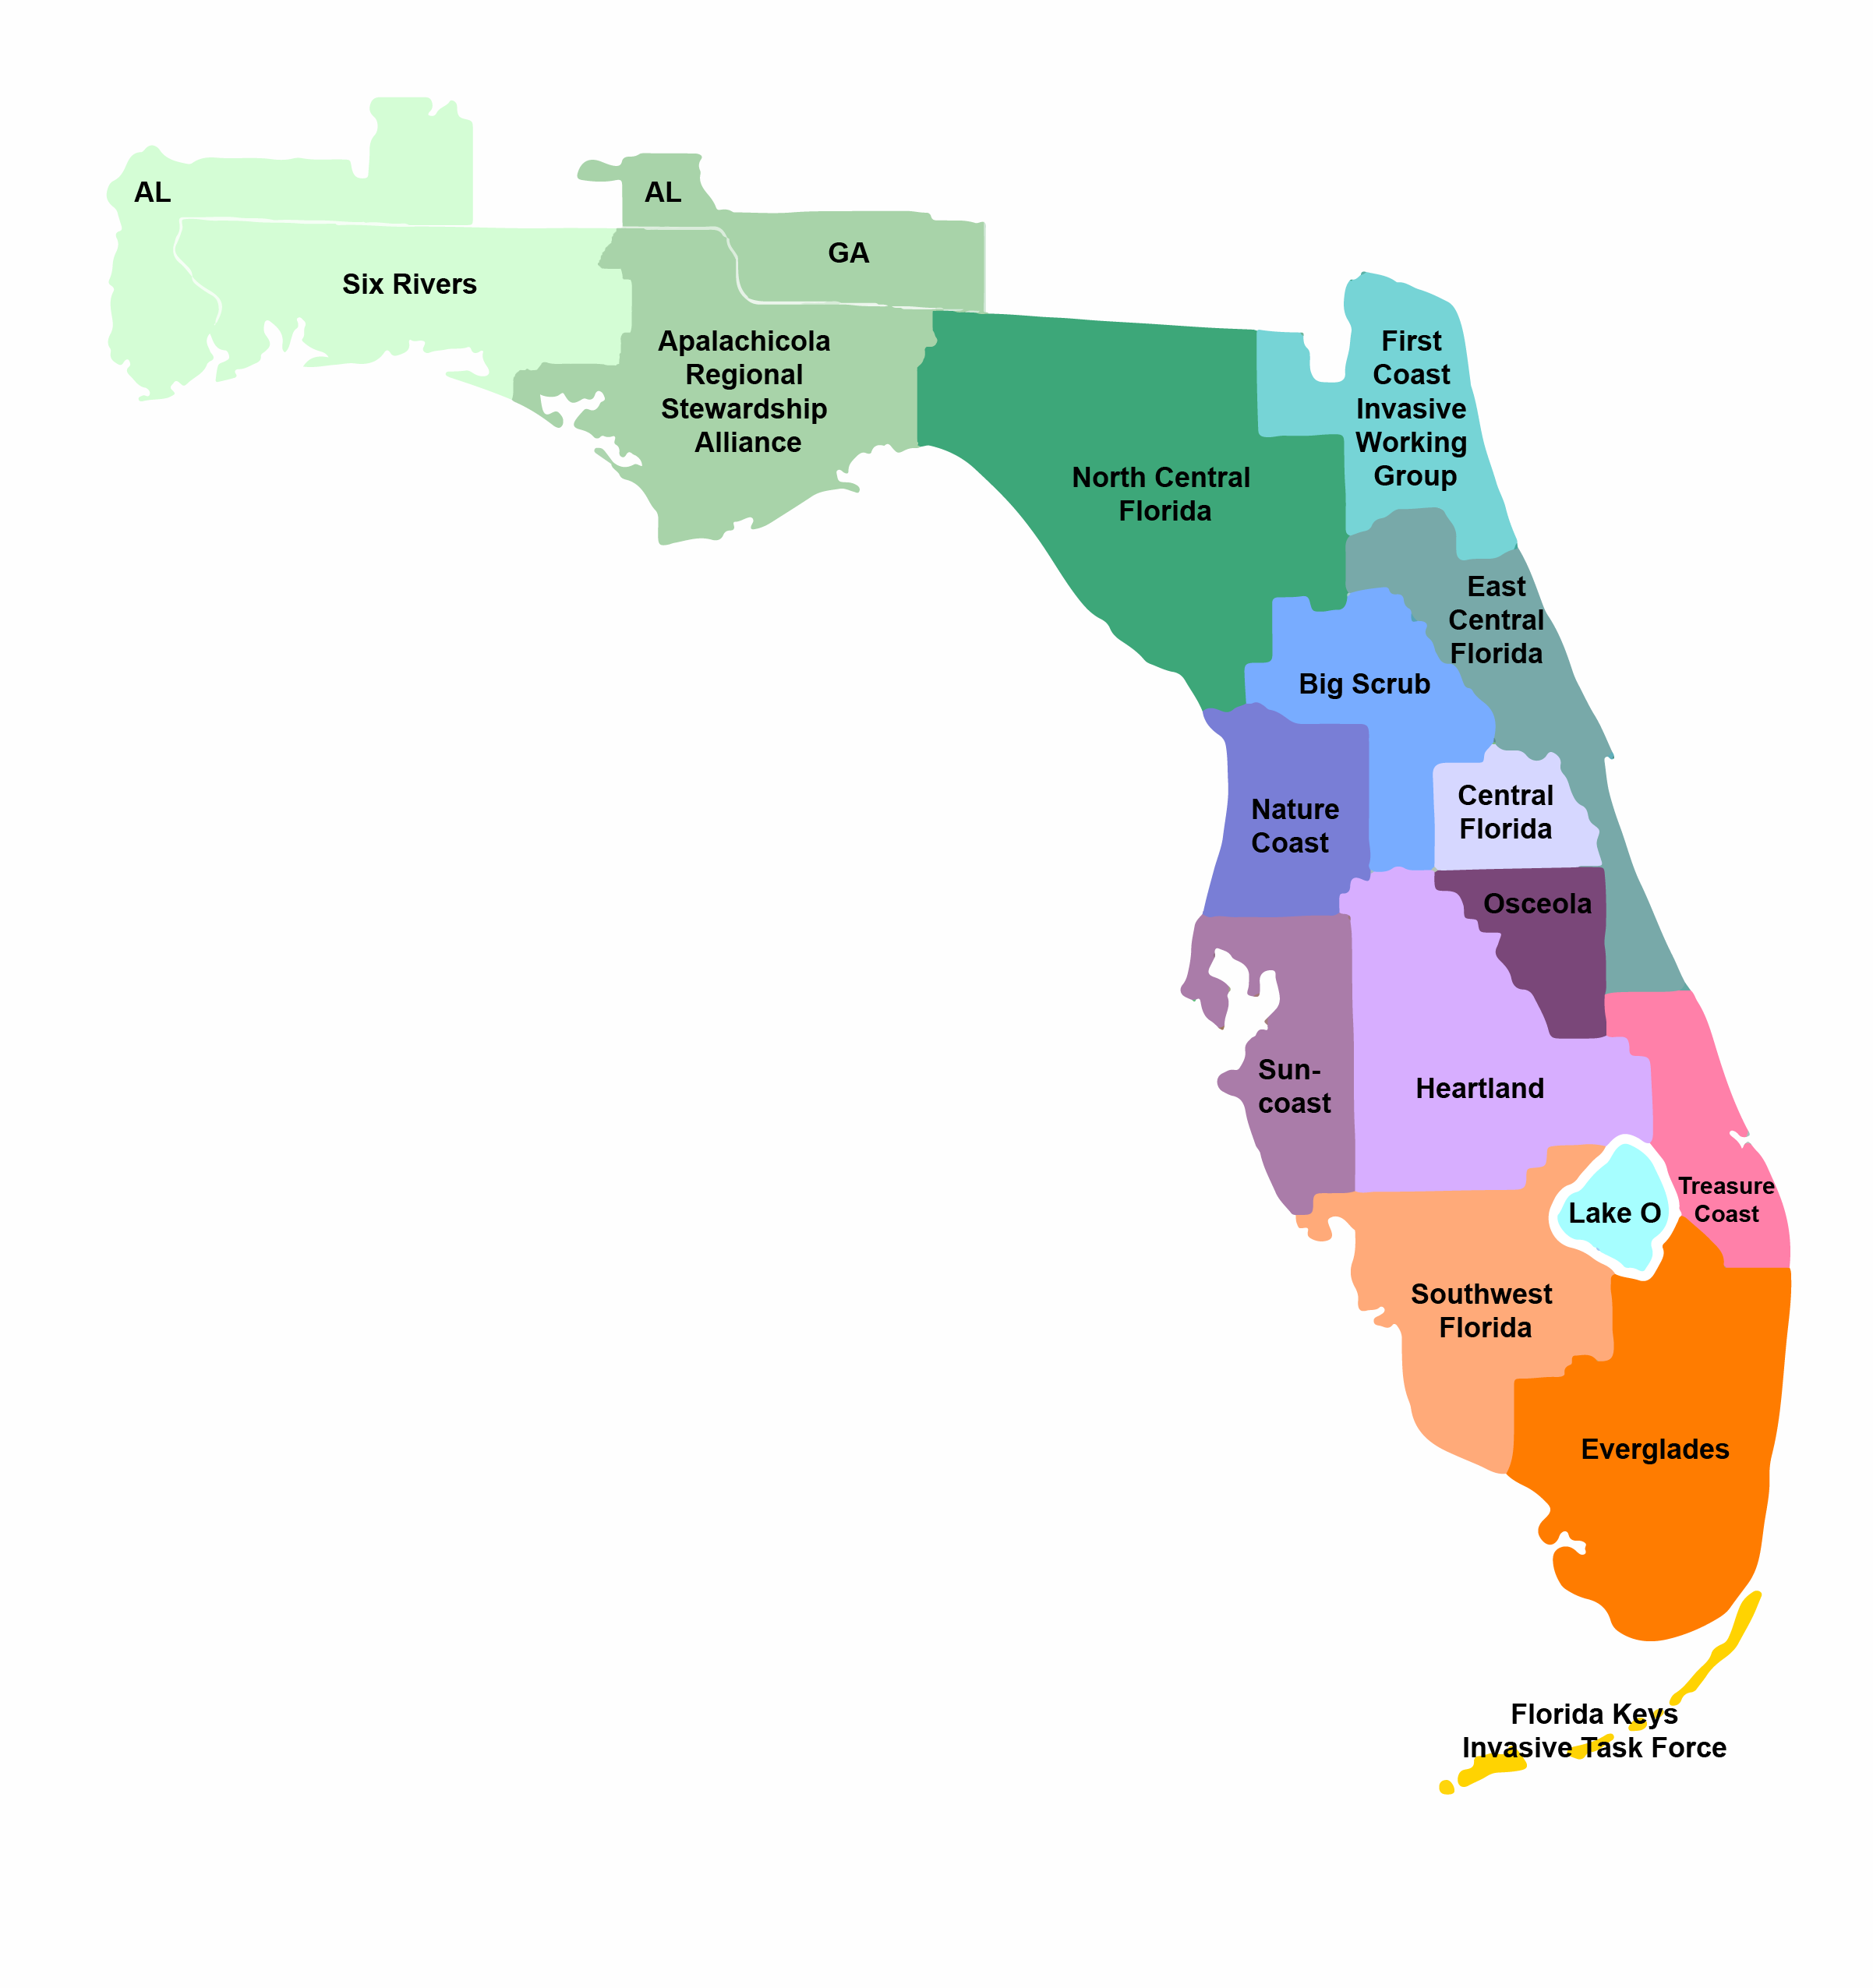
Florida is certainly no stranger to invasive species. In fact, with our climate and international travel, we have some of the largest problems. The Burmese python is a well known, but we also have problems with lizards, frogs, snakes, fish, snails, insects, mussels, and a large variety of plants. The state is divided into 15 Cooperative Invasive Species Management Areas (CISMAs). Two of these – Six Rivers and the Apalachicola Regional Stewardship Alliance (ARSA) cover the panhandle. Members of these CISMAs (which includes UF IFAS Extension) conduct management and education projects on local invasive species within their areas and also have a EDRR list for that area. An EDRR list is the Early Detection Rapid Response – the ones to be on the look out for.
Over the next few days UF IFAS Extension Agents from across the panhandle will be posting articles about the larger threats in their counties. We will be posting these by county so that both decision makers and the general public will be able to see which species are of most concern in their region.
If you have questions about invasive species in your area, or how to manage them, you can contact your county extension office for help.
The colder part of the year is the best time to install hardy trees and shrubs. All their energy is in the root zone. They will establish much faster than if you wait until they are actively growing leaves.
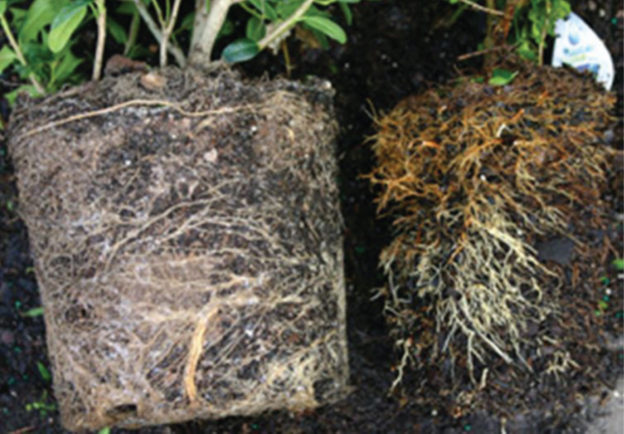
The shaved rootball (right) is smaller than the rootball before shaving (left).
Photo: Shelia Dunning
However, planting them correctly is critical to their survival. The top three mistakes that people make are: (1) installing too deeply, (2) leaving the rootball undisturbed, and (3) not applying enough water all the way through establishment of the root system. Unfortunately, it may be years before the mistakes are noticed.
Here are the ten steps for successful planting:
1. Call 811 and have all underground utilities marked before digging the hole.
Hitting a line can be costly and life threatening.
2. Loosen all surrounding compacted soil within the potential root zone of the tree.
Tree roots are close to the surface and need to be able to push through the soil.
3. If the soil is extremely dry and sandy, amend with the entire area with organic material.
This is only needed in coastal regions.
4. Remove the container from the tree and find the top-most root.
All media covering the root flare must be removed.
5. Prepare the rootball by removing encircling roots and shaving the edges of the rootball.
The rootball should no longer be shaped like the container when complete.
6. Dig the hole slightly less shallow than the rootball.
Make sure the bottom of the hole is firm soil, so sinking will not occur.
7. Place the rootball in the ground with the main root showing just above the soil grade.
Oxygen must reach the roots for new roots to develop.
8. Back fill around the rootball with the surrounding loose soil.
Take care to not cover the root flare.
9. Mulch around the outside of the rootball without covering the rootball.
Apply at least 2-3 inches of organic mulch. No more than 4″.
10. Water immediately to settle soil and then on a regular schedule until established.
Minimum of 1 gal per 3 gal plant, every 2-4 days, for 20-28 weeks. Larger plants will require more water at each event.
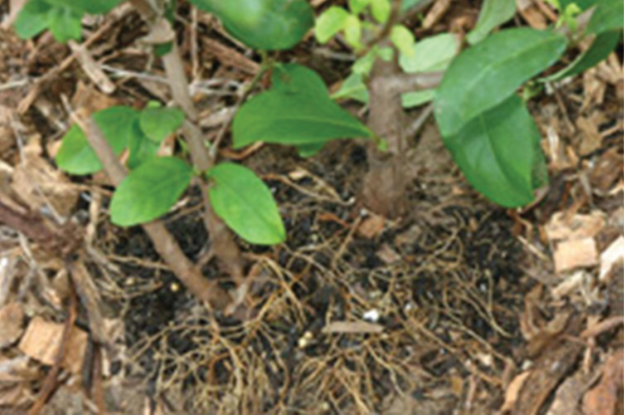
Mulch should be spread about 3 inches thick around the rootball. No mulch should be spread over the rootball.
Photo: Shelia Dunning
ATVs and Trailers: Don’t Let Invasive Species Catch a Free Ride!
In the final installment of our PlayCleanGo program, Rick O’Connor and Carrie Stevenson will look at how you can avoid spreading invasive species when you use a vehicle outside. Utilizing a hose and brush, you can clean your vehicles and remove any harmful invasive plants that may have hitched a ride.
Tents and Firewood: Don’t Let Invasive Species Camp with You!
In the 4th installment of our PlayCleanGo program, Rick O’Connor and Carrie Stevenson will show you how to avoid the introduction of invasive species when you go camping or use a firepit. In this video, we explain how you should source your firewood and how to clean your camping equipment.
Watercraft and Fishing: Stop Aquatic Hitchhikers: Keep your Kayak and Other Paddle Craft Clean!
In the 3rd installment of our PlayCleanGo program, Scott Jackson will show you how to keep paddle craft clean of invasive species that may be present in the water. Inspecting, rinsing, cleaning, and drying your equipment are important steps to reduce the transmission of invasive species which can wreak havoc on our wildlife and native plants.