by Rick O'Connor | Dec 15, 2025
Almost everyone has heard of red tides and know they periodically occur off the coast of Florida. The more frequent events occur off southwest Florida between Tampa and the Keys, but they have occurred in other parts of the state.
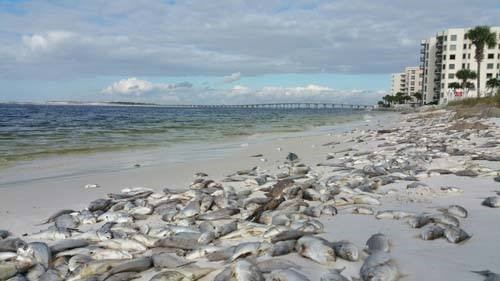
Dead fish line the beaches of Panama City during a red tide event in the past.
Photo: Randy Robinson
When they do occur in the panhandle, they seem to be more common on the east side – Bay, Gulf, and Franklin counties. This year there has been a rather large red tide event that has lingered several weeks now in this area. There have been multiple samples that have been reported as HIGH (1,000,000 cells or more / liter). Cells in this case is referring to the organism that causes red tide – Karenia brevis.

The dinoflagellate Karenia brevis.
Photo: Smithsonian Marine Station-Ft. Pierce FL
K. brevis is a microscopic plant that belongs to the dinoflagellate group. They occur naturally in Florida waters and when conditions are good – will begin to multiple and create a bloom. These blooms can be large enough to discolor the water – often making it a rusty/reddish color… hence the red tide. Good conditions would be those you would think plants like – plenty of sunlight, warm temperatures, plenty of nutrients. When the wind is lower the water moves less allowing them to concentrate into large patches producing “the tide”. These small plants can release a toxin, known as brevotoxin. Brevotoxins are neurotoxins that affect the transmission of nerve signals, which can lead to several internal complications and possibly death for marine life.
Humans and animals typically ingest or inhale brevotoxins during a large red tide event. Fish kills are a common phenomenon during large events, but marine mammals and sea turtles have also been killed. During the recent red tide event in the St. Joe area fish kills have been reported, as well as respiratory problems with humans. We now also can include diamondback terrapins as a victim.
Terrapins are smaller brackish water turtles found along the coast of Florida. At the time of this article, scientists with the US Geological Survey had logged 66 dead terrapins from the St. Joe area, all were females, and most were large females.
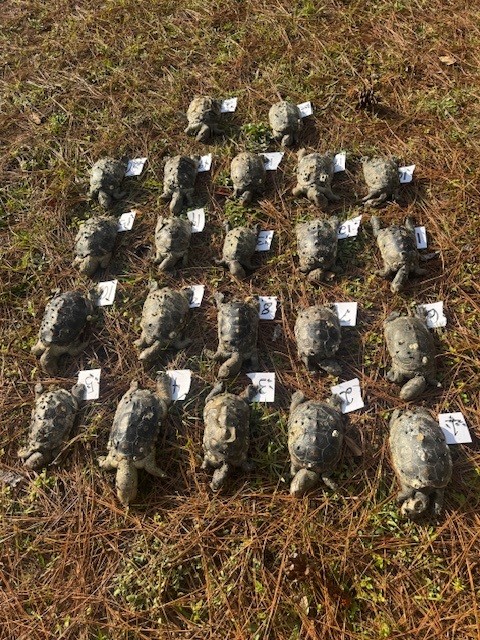
Diamondback terrapins lost during the recent red tide in St. Joe Bay.
Photo: Dan Catizone
At the time of this writing the tide in this area continues. High concentrations have been reported from Gulf, Bay, and Franklin counties. The most recent FWC report at the time of this article (December 5) red tide had been detected in 20 samples from the panhandle. Cell concentrations of >100,000/liter (medium-high) were reported from five of those. Background to medium concentrations were reported from Bay County. Background to low in Gulf and Franklin counties. Fish kills suspected to be related to the red tide occurred in Bay County but there were no reports of respiratory problems anywhere at that time.
Red tides seem to be more common in late summer and fall. NOAA believes the same climate pattern that has caused the drought, and no named tropical storms to hit Florida, may be the cause of the current patterns holding the red tide near the St. Joe area. Concentrations SEEM to be declining. Hopefully this one will not last much longer.

by Dana Stephens | Nov 17, 2025
What are PFAS?
PFAS are per- and polyfluoroalkyl substances. PFAS is a class of chemicals found in various industrial and consumer goods. For instance, you may find them in food packaging, textiles, cosmetics, and frequently in aqueous film-forming foams (AFFFs) used to extinguish fires. PFAS chemicals are known for repelling grease, water, and stains, making them widely used in various applications. These chemicals are stable and persistent, earning them the nickname “forever chemicals” because they do not readily biodegrade, or break down easily in the environment.
Numerous researchers suggested PFAS are abundant in aquatic systems and toxic to a range of aquatic organisms, with additional concerns of bioaccumulation of PFAS. PFAS accumulate in sediments and aquatic organisms, which pose health risks to wildlife and humans through the food chain. Research suggests linkages of PFAS to disruption of endocrine function, reproduction, and development in aquatic organisms. Research suggests similar linkages of PFAS to humans, like increased cancer risk, immune system suppression, endocrine and reproductive disruption, and child developmental concerns.
The United States Geological Survey (USGS) estimated that at least 45% of the United States’ tap water has one or more PFAS chemicals (Smalling et al. 2023). At least one PFAS was identified in 60% of public wells and 20% of domestic wells supplying drinking water in the eastern United States (McMahon et al. 2022).
Have PFAS been found in Santa Rosa County drinking water and surface waters?
Measured PFAS in Florida and Santa Rosa County Drinking Waters
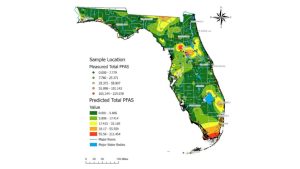
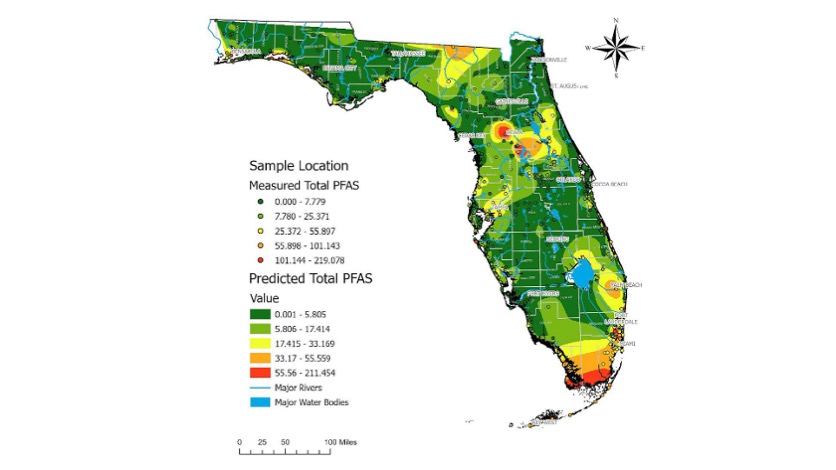
Figure 1. Map with measured total PFAS in drinking water samples across a gradient of low concentrations (green dots) to medium concentrations (yellow dots) to higher concentrations (red dots). Shaded map colors are the predicted total PFAS using estimated values of PFAS concentrations from low (green) to high (red). Data, figure, and result interpolation from Sinkway et al. 2024.
A team of researchers completed a comprehensive statewide assessment of PFAS in Florida drinking water (Sinkway et al. 2024). The team collected 448 drinking water samples across all 67 Florida counties. The drinking water samples were analyzed for 31 PFAS, where 19 PFAS were found in at least one drinking water sample. The top five most frequently detected PFAS across Florida were 6:2 fluorotelomer sulfonate (6:2 FTS) (in 84% of the samples analyzed), Perfluorooctanoic acid (PFOA) (65%), linear perfluorooctane sulfonate (PFOS) (65%), branched PFOS (64%), and perfluorobutane sulfonic acid (PFBS).
A total of 107 taps had PFOA or PFOS concentrations above 4 ng/L (ppt), where the maximum total PFAS concentration in a tap was 219 ng/L. A maximum contaminant level for PFOA and PFOS of 4 ng/L was implemented by the United States Environmental Protection Agency National Primary Drinking Water Regulation as of May 14, 2025 (USEPA, 2025). Overall, 8% of the drinking water samples analyzed exceeded 4 ng/L for PFOA and 16% for PFOS. The average total PFAS in city water was 15.6 ng/L, and in well water was 4.5 ng/L across Florida.
Santa Rosa County was not ranked in the 12 Florida counties with the highest maximum and average total PFAS concentrations (ng/L) or the lowest maximum and average total PFAS concentrations (ng/L) in drinking water (Table 1). Santa Rosa ranked 34th for the highest maximum total PFAS concentration and 35th for the highest average total PFAS concentration among the 67 Florida counties. Among the 25 drinking water samples collected, the maximum total PFAS concentration measured was 15 ng/L with an average total PFAS of 4.8 ng/L among the drinking water samples.

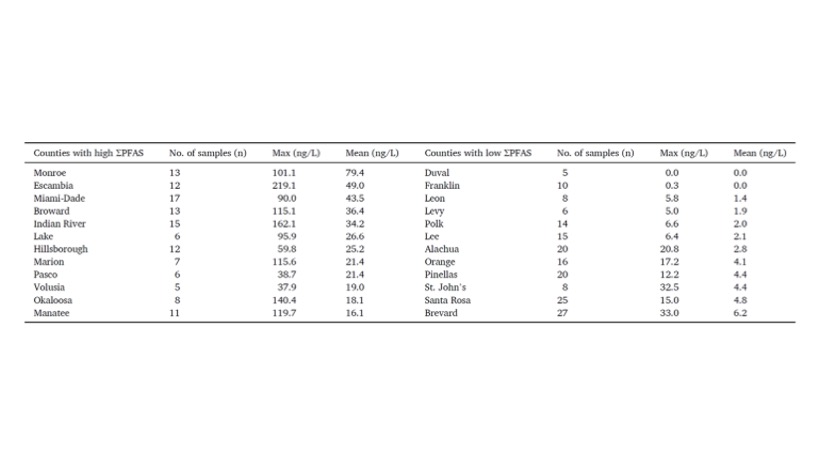
Table 1. The 12 Florida counties with highest and lowest total PFAS drinking water concentrations (ng/L). Data, figure, and result interpolation from Sinkway et al. 2024.
Measured PFAS in Florida and Santa Rosa County Surface Waters
A team of researchers completed a comprehensive statewide assessment of PFAS in Florida surface waters (Camacho et al. 2024). A network of citizen scientists collected 2,323 surface water samples across the 67 Florida counties. These surface water samples were analyzed for 50 PFAS, with 33 PFAS being detected in at least one surface water sample across Florida. The top five most frequently detected PFAS were perfluorooctanoic acid (PFOA) (94% of the samples), perfluorobutane sulfonic acid (PFBS) (65%), perfluorohexanoic acid (PFHxA) (61%), perfluorononanoic acid (PFNA) (54%), and perfluorooctane sulfonate (PFOS) (53%).
There were 915 surface water samples (39%) with PFOA concentrations above 4 ng/L and 920 samples (40%) with PFOS above 4 ng/L. All counties had at least one sample with PFOA, 96% had PFNA, 93% had PFBS, 91% had PFOS, and 82% of counties had PFHxA. The average PFAS detected among counties ranged from 2 ng/L of PFNA to 10 ng/L of PFOS. The maximum PFAS detected among counties ranged from 81 ng/L of PFOA to 1135 ng/L of PFOS.

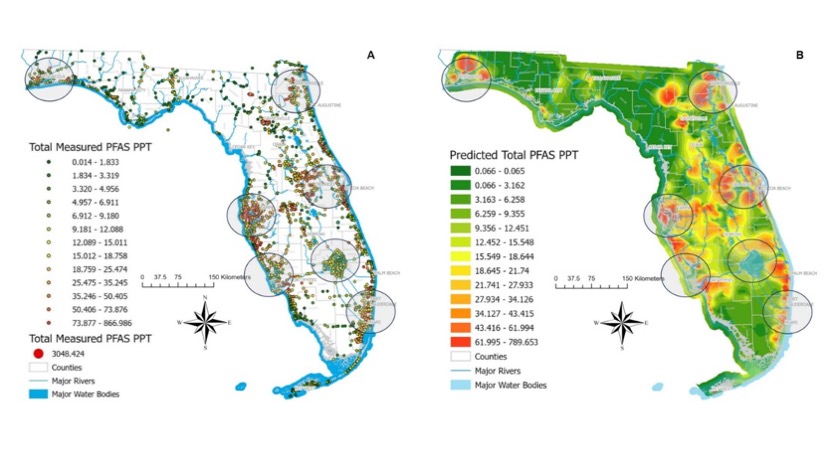
Figure 2. Surface water sampled sites with detected PFAS, where the dots’ color represents the total PFAS concentration measured. Map B shows predicted PFAS levels based on measured total PFAS concentrations in surface water samples. Note that these values do not represent predicted PFAS concentrations on land. Data, figure, and result interpolation from Camacho et al. 2024.
A total of 36 surface water samples were collected in Santa Rosa County (Figure 2). Santa Rosa County ranked 31stamong Florida counties with 7 surface water samples (7 samples out of 36 total or 19%) with PFOA above 4 ng/L. Santa Rosa County ranked 26th for the number of samples with 8 samples (22%) above 4 ng/L for PFOS. The average total PFAS concentration detected in a surface water sample was 6 ng/L, while the maximum total PFAS concentration detected in a sample was 29 ng/L.
Dr. Bowden, with the University of Florida’s College of Veterinary Medicine and Chemistry Department, led the PFAS research shared here. Dr. Bowden has extensive information on the Bowden Lab website (https://www.bowdenlaboratory.com/dr-bowden.html), including an interactive map of all the PFAS surface water samples collected in Florida. Select Okaloosa County under the filter section to see the surface water samples and learn more about the PFAS information for each sample collected in Okaloosa County (https://www.bowdenlaboratory.com/florida-surface-water.html).
What does this mean for Santa Rosa County?
PFAS have been detected in drinking water and surface waters in Santa Rosa County. Although not the highest concentrations across the state, there were drinking and surface water samples exceeding USEPA’s 4 ng/L contaminant level standard. Understanding what PFAS are and joining in educational conversations about PFAS helps our community. Efforts that support continued sampling and extended monitoring also increase our understanding of PFAS concentrations in Santa Rosa County’s drinking and surface waters. If you want to learn more about PFAS or join community scientists’ efforts to expand PFAS water monitoring, please contact Dana Stephens, Florida Sea Grant Extension Agent with the UF/IFAS Okaloosa County Extension Office.
References
Camacho, C.G., et al. 2024. Statewide surveillance and mapping of PFAS in Florida surface waters. American Chemical Society, 4: 434-4355. https://doi.org/10.1021/acsestwater
United States Environmental Protection Agency (USEPA). 2025. Per- and polyfluoroalkyl substances (PFAS) final PFAS national primary drinking water regulation. https://www.epa.gov/sdwa/and-polyfluoroalkyl-substances-pfas
McMahon, P.B., Tokranov, A.K., and Bexfield, L.M. 2022. Perfluoroalkyl and polyfluoroalkyl substances in groundwater used as a source of drinking water in the Eastern United States. Environmental Science and Technology 56(4): 2279-2288. https://doi.org/10.1021/acs.est.1c04795
Skinkway, T.D., et al. 2024. Crowdsourcing citizens for statewide mapping of per- and polyfluoroalkyl substances (PFAS) in Florida drinking water. Science of the Total Environment, 926: 1-9. https://doi.org/10.1016/j.scitotenv.2024.171932
by Dana Stephens | Nov 17, 2025
What are PFAS?
PFAS are per- and polyfluoroalkyl substances. PFAS is a class of chemicals found in various industrial and consumer goods. For instance, you may find them in food packaging, textiles, cosmetics, and frequently in aqueous film-forming foams (AFFFs) used to extinguish fires. PFAS chemicals are known for repelling grease, water, and stains, making them widely used in various applications. These chemicals are stable and persistent, earning them the nickname “forever chemicals” because they do not readily biodegrade, or break down easily in the environment.
Numerous researchers suggested PFAS are abundant in aquatic systems and toxic to a range of aquatic organisms, with additional concerns of bioaccumulation of PFAS. PFAS accumulate in sediments and aquatic organisms, which pose health risks to wildlife and humans through the food chain. Research suggests linkages of PFAS to disruption of endocrine function, reproduction, and development in aquatic organisms. Research suggests similar linkages of PFAS to humans, like increased cancer risk, immune system suppression, endocrine and reproductive disruption, and child developmental concerns.
The United States Geological Survey (USGS) estimated that at least 45% of the United States’ tap water has one or more PFAS chemicals (Smalling et al. 2023). At least one PFAS was identified in 60% of public wells and 20% of domestic wells supplying drinking water in the eastern United States (McMahon et al. 2022).
Have PFAS been found in Walton County drinking water and surface waters?
Measured PFAS in Florida and Walton County Drinking Waters
Figure 1. Map with measured total PFAS in drinking water samples across a gradient of low concentrations (green dots) to medium concentrations (yellow dots) to higher concentrations (red dots). Shaded map colors are the predicted total PFAS using estimated values of PFAS concentrations from low (green) to high (red). Data, figure, and result interpolation from Sinkway et al. 2024.
A team of researchers completed a comprehensive statewide assessment of PFAS in Florida drinking water (Sinkway et al. 2024). The team collected 448 drinking water samples across all 67 Florida counties. The drinking water samples were analyzed for 31 PFAS, where 19 PFAS were found in at least one drinking water sample. The top five most frequently detected PFAS across Florida were 6:2 fluorotelomer sulfonate (6:2 FTS) (in 84% of the samples analyzed), Perfluorooctanoic acid (PFOA) (65%), linear perfluorooctane sulfonate (PFOS) (65%), branched PFOS (64%), and perfluorobutane sulfonic acid (PFBS).
A total of 107 taps had PFOA or PFOS concentrations above 4 ng/L (ppt), where the maximum total PFAS concentration in a tap was 219 ng/L. A maximum contaminant level for PFOA and PFOS of 4 ng/L was implemented by the United States Environmental Protection Agency National Primary Drinking Water Regulation as of May 14, 2025 (USEPA, 2025). Overall, 8% of the drinking water samples analyzed exceeded 4 ng/L for PFOA and 16% for PFOS. The average total PFAS in city water was 15.6 ng/L, and in well water was 4.5 ng/L across Florida.
Walton County was not ranked in the 12 Florida counties with the highest maximum and average total PFAS concentrations (ng/L) in drinking water (Table 1). Walton County was not included in the rankings of Florida counties with the lowest maximum and average total PFAS concentrations (ng/L) in drinking water as the total number of samples (n=3) was below the required 5 total number sample requirement (Table 1). Among the three drinking water samples collected, the maximum PFAS concentration measured was 0 ng/L with an average of 0 ng/L. Walton County had no drinking water samples exceeding the 4 ng/L standard for PFOA.
Table 1. The 12 Florida counties with highest and lowest total PFAS drinking water concentrations (ng/L). Data, figure, and result interpolation from Sinkway et al. 2024.
Measured PFAS in Florida and Walton County Surface Waters
A team of researchers completed a comprehensive statewide assessment of PFAS in Florida surface waters (Camacho et al. 2024). A network of citizen scientists collected 2,323 surface water samples across the 67 Florida counties. These surface water samples were analyzed for 50 PFAS, with 33 PFAS being detected in at least one surface water sample across Florida. The top five most frequently detected PFAS were perfluorooctanoic acid (PFOA) (94% of the samples), perfluorobutane sulfonic acid (PFBS) (65%), perfluorohexanoic acid (PFHxA) (61%), perfluorononanoic acid (PFNA) (54%), and perfluorooctane sulfonate (PFOS) (53%).
There were 915 surface water samples (39%) with PFOA concentrations above 4 ng/L and 920 samples (40%) with PFOS above 4 ng/L. All counties had at least one sample with PFOA, 96% had PFNA, 93% had PFBS, 91% had PFOS, and 82% of counties had PFHxA. The average PFAS detected among counties ranged from 2 ng/L of PFNA to 10 ng/L of PFOS. The maximum PFAS detected among counties ranged from 81 ng/L of PFOA to 1135 ng/L of PFOS.
Figure 2. Surface water sampled sites with detected PFAS, where the dots’ color represents the total PFAS concentration measured. Map B shows predicted PFAS levels based on measured total PFAS concentrations in surface water samples. Note that these values do not represent predicted PFAS concentrations on land. Data, figure, and result interpolation from Camacho et al. 2024.
A total of 18 surface water samples were collected in Walton County (Figure 2). Walton County ranked 51st among Florida counties with one surface water sample (one sample out of 18 total or 5%) with PFOA above 4 ng/L. Walton County ranked 42nd for the number of samples with two samples (11%) above 4 ng/L for PFOS. The average total PFAS concentration detected in a surface water sample was 6 ng/L, while the maximum total PFAS concentration detected in a sample was 29 ng/L.
Dr. Bowden, with the University of Florida’s College of Veterinary Medicine and Chemistry Department, led the PFAS research shared here. Dr. Bowden has extensive information on the Bowden Lab website (https://www.bowdenlaboratory.com/dr-bowden.html), including an interactive map of all the PFAS surface water samples collected in Florida. Select Okaloosa County under the filter section to see the surface water samples and learn more about the PFAS information for each sample collected in Okaloosa County (https://www.bowdenlaboratory.com/florida-surface-water.html).
What does this mean for Walton County?
PFAS were not detected in drinking waters in Walton County. However, the sample size, or the number of samples, was small with three total samples collected and analyzed. PFAS were detected in surface waters in Walton County. Although not the highest concentrations or most frequent identified in Florida, there were surface water samples above USEPA’s 4 ng/L contaminant level standard for PFOA and PFOS.
Understanding what PFAS are and joining in educational conversations about PFAS helps the Walton County community. Efforts that support continued sampling and extended monitoring also increase our understanding of PFAS concentrations in Walton County’s drinking and surface waters. If you want to learn more about PFAS or join community scientists’ efforts to expand PFAS water monitoring, please contact Dana Stephens, Florida Sea Grant Extension Agent with the UF/IFAS Okaloosa County Extension Office.
References
Camacho, C.G., et al. 2024. Statewide surveillance and mapping of PFAS in Florida surface waters. American Chemical Society, 4: 434-4355. https://doi.org/10.1021/acsestwater
United States Environmental Protection Agency (USEPA). 2025. Per- and polyfluoroalkyl substances (PFAS) final PFAS national primary drinking water regulation. https://www.epa.gov/sdwa/and-polyfluoroalkyl-substances-pfas
McMahon, P.B., Tokranov, A.K., and Bexfield, L.M. 2022. Perfluoroalkyl and polyfluoroalkyl substances in groundwater used as a source of drinking water in the Eastern United States. Environmental Science and Technology 56(4): 2279-2288. https://doi.org/10.1021/acs.est.1c04795
Skinkway, T.D., et al. 2024. Crowdsourcing citizens for statewide mapping of per- and polyfluoroalkyl substances (PFAS) in Florida drinking water. Science of the Total Environment, 926: 1-9. https://doi.org/10.1016/j.scitotenv.2024.171932
by Dana Stephens | Nov 17, 2025
What are PFAS?
PFAS are per- and polyfluoroalkyl substances. PFAS is a class of chemicals found in various industrial and consumer goods. For instance, you may find them in food packaging, textiles, cosmetics, and frequently in aqueous film-forming foams (AFFFs) used to extinguish fires. PFAS chemicals are known for repelling grease, water, and stains, making them widely used in various applications. These chemicals are stable and persistent, earning them the nickname “forever chemicals” because they do not readily biodegrade, or break down easily in the environment.
Numerous researchers suggested PFAS are abundant in aquatic systems and toxic to a range of aquatic organisms, with additional concerns of bioaccumulation of PFAS. PFAS accumulate in sediments and aquatic organisms, which pose health risks to wildlife and humans through the food chain. Research suggests linkages of PFAS to disruption of endocrine function, reproduction, and development in aquatic organisms. Research suggests similar linkages of PFAS to humans, like increased cancer risk, immune system suppression, endocrine and reproductive disruption, and child developmental concerns.
The United States Geological Survey (USGS) estimated that at least 45% of the United States’ tap water has one or more PFAS chemicals (Smalling et al. 2023). At least one PFAS was identified in 60% of public wells and 20% of domestic wells supplying drinking water in the eastern United States (McMahon et al. 2022).
Have PFAS been found in Escambia County drinking water and surface waters?
Measured PFAS in Florida and Escambia County Drinking Waters
Figure 1. Map with measured total PFAS in drinking water samples across a gradient of low concentrations (green dots) to medium concentrations (yellow dots) to higher concentrations (red dots). Shaded map colors are the predicted total PFAS using estimated values of PFAS concentrations from low (green) to high (red). Data, figure, and result interpolation from Sinkway et al. 2024.
A team of researchers completed a comprehensive statewide assessment of PFAS in Florida drinking water (Sinkway et al. 2024). The team collected 448 drinking water samples across all 67 Florida counties. The drinking water samples were analyzed for 31 PFAS, where 19 PFAS were found in at least one drinking water sample. The top five most frequently detected PFAS across Florida were 6:2 fluorotelomer sulfonate (6:2 FTS) (in 84% of the samples analyzed), Perfluorooctanoic acid (PFOA) (65%), linear perfluorooctane sulfonate (PFOS) (65%), branched PFOS (64%), and perfluorobutane sulfonic acid (PFBS).
A total of 107 taps had PFOA or PFOS concentrations above 4 ng/L (ppt), where the maximum total PFAS concentration in a tap was 219 ng/L. A maximum contaminant level for PFOA and PFOS of 4 ng/L was implemented by the United States Environmental Protection Agency National Primary Drinking Water Regulation as of May 14, 2025 (USEPA, 2025). Overall, 8% of the drinking water samples analyzed exceeded 4 ng/L for PFOA and 16% for PFOS. The average total PFAS in city water was 15.6 ng/L, and in well water was 4.5 ng/L across Florida.
Escambia County ranked 2nd among the 67 Florida counties for the highest maximum and average total PFAS concentrations (ng/L) or the lowest maximum and average total PFAS concentrations (ng/L) in drinking water (Table 1). Among the 12 drinking water samples collected, the maximum total PFAS concentration measured was 219 ng/L, with an average total PFAS of 49 ng/L among the drinking water samples.
Table 1. The 12 Florida counties with highest and lowest total PFAS drinking water concentrations (ng/L). Data, figure, and result interpolation from Sinkway et al. 2024.
Measured PFAS in Florida and Escambia County Surface Waters
A team of researchers completed a comprehensive statewide assessment of PFAS in Florida surface waters (Camacho et al. 2024). A network of citizen scientists collected 2,323 surface water samples across the 67 Florida counties. These surface water samples were analyzed for 50 PFAS, with 33 PFAS detected in at least one surface water sample across Florida. The top five most frequently detected PFAS were perfluorooctanoic acid (PFOA) (94% of the samples), perfluorobutane sulfonic acid (PFBS) (65%), perfluorohexanoic acid (PFHxA) (61%), perfluorononanoic acid (PFNA) (54%), and perfluorooctane sulfonate (PFOS) (53%).
There were 915 surface water samples (39%) with PFOA concentrations above 4 ng/L and 920 samples (40%) with PFOS above 4 ng/L (Figure 2). All counties had at least one sample with PFOA, 96% had PFNA, 93% had PFBS, 91% had PFOS, and 82% of counties had PFHxA. The average PFAS detected among counties ranged from 2 ng/L of PFNA to 10 ng/L of PFOS. The maximum PFAS detected among counties ranged from 81 ng/L of PFOA to 1135 ng/L of PFOS.
Figure 2. Surface water sampled sites with detected PFAS, where the dots’ color represents the total PFAS concentration measured. Map B shows predicted PFAS levels based on measured total PFAS concentrations in surface water samples. Note that these values do not represent predicted PFAS concentrations on land. Data, figure, and result interpolation from Camacho et al. 2024.
A total of 52 surface water samples were collected in Escambia County. Escambia County ranked 22nd among Florida counties with 14 surface water samples (14 samples out of 52 total or 27%) with PFOA above 4 ng/L. Escambia County ranked 27th for the number of samples, with 7 samples (13%) above 4 ng/L for PFOS. The average total PFAS concentration detected in a surface water sample was 12 ng/L, while the maximum total PFAS concentration detected in a sample was 118 ng/L.
Dr. Bowden, with the University of Florida’s College of Veterinary Medicine and Chemistry Department, led the PFAS research shared here. Dr. Bowden has extensive information on the Bowden Lab website (https://www.bowdenlaboratory.com/dr-bowden.html), including an interactive map of all the PFAS surface water samples collected in Florida. Select Okaloosa County under the filter section to see the surface water samples and learn more about the PFAS information for each sample collected in Okaloosa County (https://www.bowdenlaboratory.com/florida-surface-water.html).
What does this mean for Escambia County?
PFAS were detected in drinking water and surface waters in Escambia County. There were drinking and surface water samples exceeding USEPA’s 4 ng/L contaminant level standard, notably in the 12 collected drinking water samples. Understanding what PFAS are and joining in educational conversations about PFAS helps our community. Efforts that support continued sampling and extended monitoring also increase our understanding of PFAS concentrations in Escambia County’s drinking and surface waters. If you want to learn more about PFAS or join community scientists’ efforts to expand PFAS water monitoring, please contact Dana Stephens, Florida Sea Grant Extension Agent with the UF/IFAS Okaloosa County Extension Office.
References
Camacho, C.G., et al. 2024. Statewide surveillance and mapping of PFAS in Florida surface waters. American Chemical Society, 4: 434-4355. https://doi.org/10.1021/acsestwater
United States Environmental Protection Agency (USEPA). 2025. Per- and polyfluoroalkyl substances (PFAS) final PFAS national primary drinking water regulation. https://www.epa.gov/sdwa/and-polyfluoroalkyl-substances-pfas
McMahon, P.B., Tokranov, A.K., and Bexfield, L.M. 2022. Perfluoroalkyl and polyfluoroalkyl substances in groundwater used as a source of drinking water in the Eastern United States. Environmental Science and Technology 56(4): 2279-2288. https://doi.org/10.1021/acs.est.1c04795
Skinkway, T.D., et al. 2024. Crowdsourcing citizens for statewide mapping of per- and polyfluoroalkyl substances (PFAS) in Florida drinking water. Science of the Total Environment, 926: 1-9. https://doi.org/10.1016/j.scitotenv.2024.171932
by Dana Stephens | Jul 7, 2025
PFAS—have you heard of them? Do you know what they are, or is it more of a term thrown around without much context?
PFAS are per- and polyfluoroalkyl substances. PFAS is a class of chemicals found in various industrial and consumer goods. For instance, you may find them in food packaging, textiles, cosmetics, and frequently in aqueous film-forming foams (AFFFs) used to extinguish fires. PFAS chemicals are known for repelling grease, water, and stains, making them widely used in various applications. These chemicals are stable and persistent, earning them the nickname “forever chemicals” because they do not readily biodegrade, or break down easily in the environment.
Numerous researchers suggested PFAS are abundant in aquatic systems and toxic to a range of aquatic organisms, with additional concerns of bioaccumulation of PFAS. PFAS accumulate in sediments and aquatic organisms, which pose health risks to wildlife and humans through the food chain. Research suggests linkages of PFAS to disruption of endocrine function, reproduction, and development in aquatic organisms. Research suggests similar linkages of PFAS to humans, like increased cancer risk, immune system suppression, endocrine and reproductive disruption, and child developmental concerns.
The United States Geological Survey (USGS) estimated at least 45% of the United States’ tap water has one or more PFAS chemicals (Smalling et al. 2023). At least one PFAS was identified in 60% of public wells and 20% of domestic wells supplying drinking water in the eastern United States (McMahon et al. 2022).
Have PFAS been found in Okaloosa County drinking water and surface waters?
Measured PFAS in Florida and Okaloosa County Drinking Waters
Figure 1. Map with measured total PFAS samples across a gradient of low concentrations (green dots) to medium concentrations (yellow dots) to higher concentrations (red dots). Shaded map colors are the predicted total PFAS using estimated values of PFAS concentrations from low (green) to high (red). Data, figure, and result interpolation from Sinkway et al. 2024.
A team of researchers completed a comprehensive statewide assessment of PFAS in Florida drinking water (Sinkway et al. 2024). The team collected 448 drinking water samples across all 67 Florida counties. The drinking water samples were analyzed for 31 PFAS, where 19 PFAS were found in at least one drinking water sample. The top five most frequently detected PFAS were 6:2 fluorotelomer sulfonate (6:2 FTS) (in 84% of the samples analyzed), Perfluorooctanoic acid (PFOA) (65%), linear perfluorooctane sulfonate (PFOS) (65%), branched PFOS (64%), and perfluorobutane sulfonic acid (PFBS).
A total of 107 taps had PFOA or PFOS concentrations above 4 ng/L (ppt), where the maximum total PFAS concentration in a tap was 219 ng/L (Click on link for higher resolution–Figure 1). The maximum contaminant level for PFOA and PFOS is 4 ng/L, legally enforced by the United States Environmental Protection Agency National Primary Drinking Water Regulation as of May 14, 2025 (USEPA, 2025). Overall, 8% of the drinking water samples analyzed exceeded 4 ng/L for PFOA and 16% for PFOS. The average total PFAS in city water was 15.6 ng/L, and in well water was 4.5 ng/L.
Table 1. Top average 12 Florida counties with highest and lowest total PFAS concentrations (ng/L). Data, figure, and result interpolation from Sinkway et al. 2024.
Okaloosa County had the 11th highest total PFAS (ng/L) concentration among the 67 Florida counties (Click on link for higher resolution–Table 1). Among the eight drinking water samples collected, the maximum PFAS concentration measured was 140 ng/L, and the lowest was 18 mg/L. Okaloosa County had one drinking water sample that exceeded the 4 ng/L standard for PFOA. There were no drinking water samples that exceeded 4 ng/L for PFOS.
Measured PFAS in Florida and Okaloosa County Surface Waters
A team of researchers completed a comprehensive statewide assessment of PFAS in Florida surface waters (Camacho et al. 2024). A network of citizen scientists collected 2,323 surface water samples across the 67 Florida counties. These surface water samples were analyzed for 50 PFAS, with 33 PFAS being detected in at least one surface water sample. The top five most frequently detected PFAS were perfluorooctanoic acid (PFOA) (94% of the samples), perfluorobutane sulfonic acid (PFBS) (65%), perfluorohexanoic acid (PFHxA) (61%), perfluorononanoic acid (PFNA) (54%), and perfluorooctane sulfonate (PFOS) (53%).
Figure 2. Map A contains all surface water sampled sites with detected PFAS, where the dots’ color represents the total PFAS concentration measured. Map B shows predicted PFAS levels based on measured total PFAS concentrations in surface water samples. Note that these values do not represent predicted PFAS concentrations on land. Data, figure, and result interpolation from Camacho et al. 2024.
There were 915 (39%) surface water samples with PFOA concentrations above 4 ng/L and 920 (40%) samples with PFOS above 4 ng/L (Click on link for higher resolution–Figure 2). All counties had at least one sample with PFOA, 96% had PFNA, 93% had PFBS, 91% had PFOS, and 82% of counties had PFHxA. The average PFAS detected among counties ranged from 2 ng/L of PFNA to 10 ng/L of PFOS. The maximum PFAS detected among counties ranged from 81 ng/L of PFOA to 1135 ng/L of PFOS. Figure 2
Okaloosa County ranked 27th among Florida counties due to 10 (20%) surface water samples with PFOA above 4 ng/L. Okaloosa County ranked 9th for the number of samples (38 total samples or 78% of the samples) above 4 ng/L for PFOS. A total of 49 surface water samples were collected in Okaloosa County. The average total PFAS concentration detected in a surface water sample was 31 ng/L, while the maximum total PFAS concentration detected in a sample was 185 ng/L.
Dr. Bowden, with the University of Florida’s College of Veterinary Medicine and Chemistry Department, led the PFAS research shared here. Dr. Bowden has extensive information on the Bowden Lab website (https://www.bowdenlaboratory.com/dr-bowden.html), including an interactive map of all the PFAS surface water samples collected in Florida. Select Okaloosa County under the filter section to see the surface water samples and learn more about the PFAS information for each sample collected in Okaloosa County (https://www.bowdenlaboratory.com/florida-surface-water.html).Figure 2 Table 1
What does this mean for Okaloosa County?
PFAS have been detected in drinking water and surface waters in Okaloosa County. Although not the highest concentrations or most frequent identified in Florida, there were drinking and surface water samples above USEPA’s 4 ng/L contaminant level standard. Understanding what PFAS are and joining in educational conversations about PFAS helps our community. Efforts that support continued sampling and extended monitoring also increase our understanding of PFAS concentrations in Okaloosa County’s drinking and surface waters. If you want to learn more about PFAS or join community scientists’ efforts to expand PFAS water monitoring, please contact Dana Stephens at the UF/IFAS Okaloosa County Extension Office.
References
Camacho, C.G., et al. 2024. Statewide surveillance and mapping of PFAS in Florida surface waters. American Chemical Society, 4: 434-4355. https://doi.org/10.1021/acsestwater
United States Environmental Protection Agency (USEPA). 2025. Per- and polyfluoroalkyl substances (PFAS) final PFAS national primary drinking water regulation. https://www.epa.gov/sdwa/and-polyfluoroalkyl-substances-pfas
McMahon, P.B., Tokranov, A.K., and Bexfield, L.M. 2022. Perfluoroalkyl and polyfluoroalkyl substances in groundwater used as a source of drinking water in the Eastern United States. Environmental Science and Technology 56(4): 2279-2288. https://doi.org/10.1021/acs.est.1c04795
Skinkway, T.D., et al. 2024. Crowdsourcing citizens for statewide mapping of per- and polyfluoroalkyl substances (PFAS) in Florida drinking water. Science of the Total Environment, 926: 1-9. https://doi.org/10.1016/j.scitotenv.2024.171932
by Dana Stephens | May 12, 2025
Spring is a time of change. Spring brings changes in our waters as well. Some of these changes are visible on top of the water and cause concern among water users and viewers. Let’s dispel some of these concerns associated with the spring season.
Sometimes, water users and viewers notice what appears to be oil floating on top of the water. Could this be oil? Potentially. Could this not be oil? Most likely. Plants perish, and decomposition occurs, typically during the spring and fall seasons of the year. Much of the decomposition that happens in spring is associated with the initial growth and development of plants. Bacteria living in the soils within and around the water break down the perished plants. These bacteria are decomposing the old plant material. The waste product produced from the bacteria’s decomposition of the old plant material is an oily substance. The oily sheen on the water is a waste product of bacteria. Frequently, the oil accumulates in portions of water where there is little to no water movement. As the decomposition process completes, the oily sheen should lessen over the next few days to weeks. This bacteria-produced oil from decomposition is a natural process.
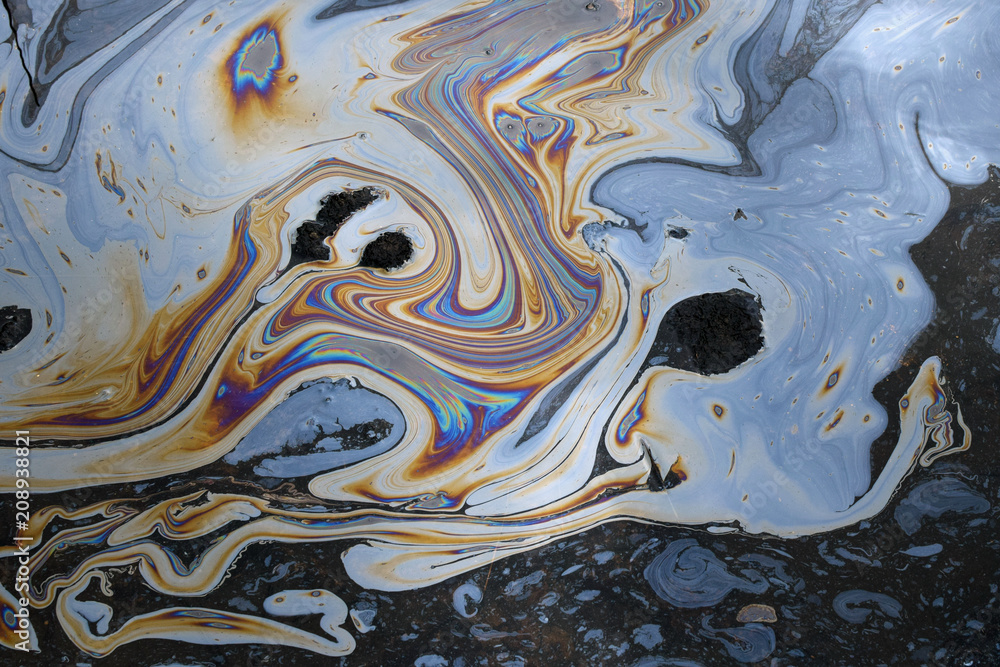
Petroleum-based oil seen on water is not a natural process. Petroleum-based oil could enter water from various sources, such as but not limited to transportation spills, stormwater runoff, and improper disposal of products containing oil. Like the oily substances produced by bacteria during decomposition, petroleum-based oils will float on top of the water and accumulate where there is little to no water movement.
Here are some tips to identify the difference between oils in water:
|
Bacteria-produced Oil |
Petroleum-based Oil |
| Appearance |
Oily sheen on top of water with little to no difference in color throughout |
Oily sheen on top of water with differences in color throughout (may even appear like a rainbow) |
| Touch
(use a stick) |
When disturbed, the sheen breaks away easily with irregular patterns and does not reform. The oil will not adhere to the stick. |
When disturbed, the sheen swirls, elongates, and does reform. The oil may adhere to the stick. |
| Odor
(not always present) |
Strong organic, musty, or earthy smell. |
Volatile organic compounds (VOCs) smelling like gasoline or diesel fuel. |
Another sheen on our waters that is frequent during Florida’s springtime is pollen. Pine, tree, and weed pollen accumulate on top of water, especially in areas with little or no water movement. If the sheen on the water is yellow, orange, or sometimes white, this is most likely due to pollen. Think about how pollen shows on a car in Florida during spring…our waters can show the same to some extent.
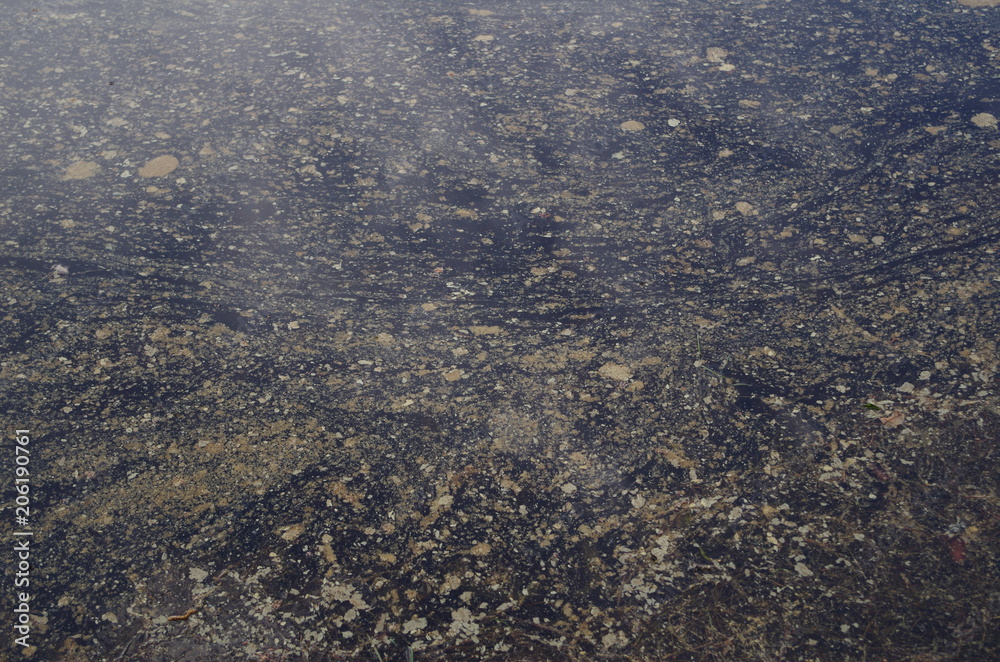
Let’s give it a try! See if you can identify the sheens in water in each photo—answers at the bottom of the page.
Photo 1

Photo 2

Photo 3
Photo 4
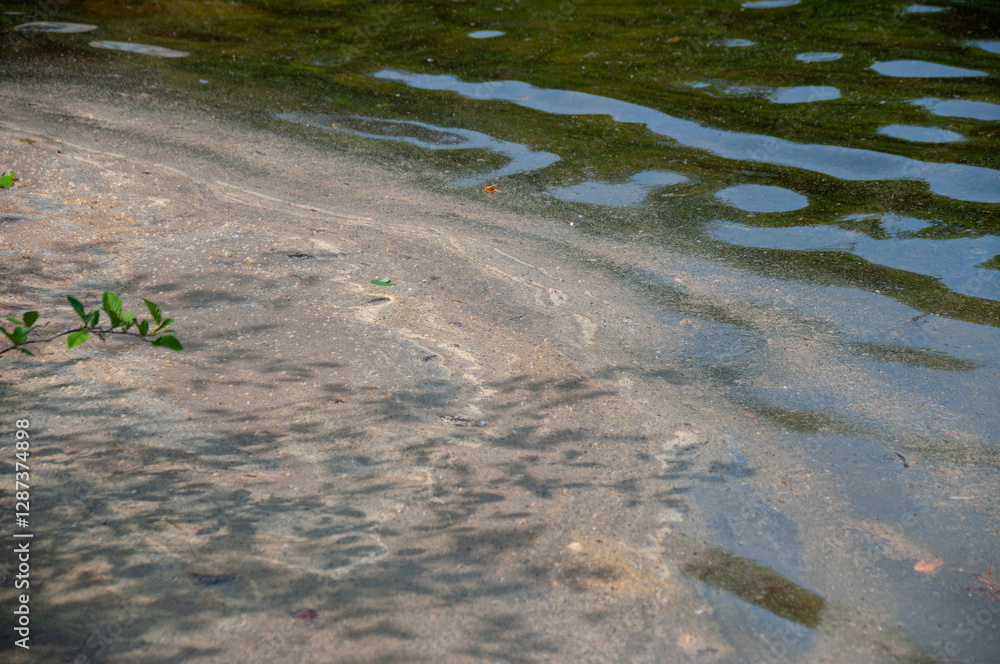
Photo 5

Photo 6
Keep Scrolling For Answers!
.
.
.
.
.
.
PHOTO ANSWERS: Photo 1: Bacteria-produced oil sheen. Photo 2: Pollen sheen. Photo 3: Petroleum-based oil sheen. Photo 4: Pollen sheen. Photo 5: Petroleum-based oil sheen. Photo 6: Mixture of bacteria-produced oil and pollen sheen. Note all photos were obtained from Adobe Stock Photos.