by Rick O'Connor | Aug 17, 2018
Being in the panhandle of Florida you may, or may not, have heard about the water quality issues hindering the southern part of the state. Water discharged from Lake Okeechobee is full of nutrients. These nutrients are coming from agriculture, unmaintained septic tanks, and developed landscaping – among other things. The discharges that head east lead to the Indian River Lagoon and other Intracoastal Waterways. Those heading west, head towards the estuaries of Sarasota Bay and Charlotte Harbor.
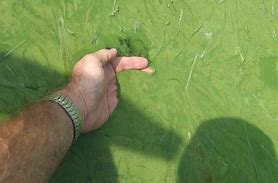
A large bloom of blue-green algae (cyanobacteria) in south Florida waters.
Photo: NOAA
Those heading east have created large algal blooms of blue-green algae (cyanobacteria). The blooms are so thick the water has become a slime green color and, in some locations, difficult to wade. Some of developed skin rashes from contacting this water. These algal blooms block needed sunlight for seagrasses, slow water movement, and in the evenings – decrease needed dissolved oxygen. When the algae die, they begin to decompose – thus lower the dissolved oxygen and triggering fish kills. It is a mess – both environmentally and economically.
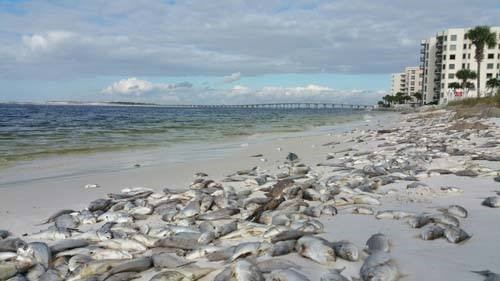
On the west coast, there are red tides. These naturally occurring events happen most years in southwest Florida. They form offshore and vary in intensity from year to year. Some years beachcombers and fishermen barely notice them, other years it is difficult for people to walk the beaches. This year is one of the worst in recent memories. The increase in intensity is believed to be triggered by the increase in nutrient-filled waters being discharged towards their area.

Dead fish line the beaches of Panama City during a red tide event in the past.
Photo: Randy Robinson
On both coasts, the economic impact has been huge and the quality of life for local residents has diminished. Many are pointing the finger at the federal government who, through the Army Corp of Engineers, controls flow in the lake. Others are pointing the finger at shortsighted state government, who have not done enough to provide a reserve to discharge this water, not enforced nutrient loads being discharged by those entities mentioned above. Either way, it is a big problem that has been coming for some time.
As bad as all of this is, how does this impact us here in the Florida panhandle?
Though we are not seeing the impacts central and south Florida are currently experiencing, we are not without our nutrient discharge issues. Most of Florida’s world-class springs are in our part of the state. In recent years, the water within these springs have seen an increase in nutrients. This clouds the water, changing the ecology of these systems and has already affected glass bottom boat tours at some of the classic springs. There has also been a decline in water entering the springs due to excessive withdrawals from neighboring communities. The increase in nutrients are generally from the same sources as those affecting south Florida.
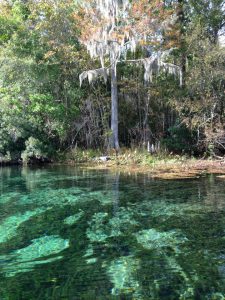
Florida’s springs are world famous. They attracted native Americans and settlers; as well as tourists and locals today.
Photo: Erik Lovestrand
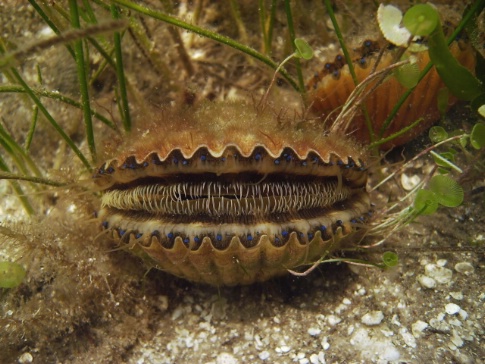
Though we are not seeing large algal blooms in our local estuaries, there are some problems. St. Joe Bay has experienced some algal blooms, and a red tide event, in recent years that has forced the state to shorten the scallop season there – this obviously hurts the local economy. Due to stormwater runoff issues and septic tanks maintenance problems, health advisories are being issued due to high fecal bacteria loads in the water. Some locations in the Pensacola area have levels high enough that advisories must be issued 30% of the time they are sampled – some as often as 40%. Health advisories obviously keep tourists out of those waterways and hurt neighboring businesses as well as lower the quality of life for those living there.
Then of course, there is the Apalachicola River issue. Here, water that normally flows from Georgia into the river, and eventually to the bay, has been held back for water needs in Georgia. This has changed flow and salinity within the bay, which has altered the ecology of the system, and has negatively impacted one of the more successful seafood industries in the state. The entire community of Apalachicola has felt the impact from the decision to hold the water back. Though the impacts may not be as dramatic as those of our cousins in south Florida, we do have our problems.

Bay Scallop Argopecten iradians
http://myfwc.com/fishing/saltwater/recreational/bay-scallops/
What can we do about it?
The quick answer is reduce our nutrient input.
The state has adopted Best Management Practices (BMPs) for farmers and ranchers to help them reduce their impact on ground water and surface water contamination from their lands. Many panhandle farmers and ranchers are already implementing these BMPs and others can. We encourage them to participate. Read more at Florida’s Rangeland Agriculture and the Environment: A Natural Partnership – https://nwdistrict.ifas.ufl.edu/nat/2015/07/18/floridas-rangeland-agriculture-and-the-environment-a-natural-partnership/.
As development continues to increase across the state, and in the panhandle, sewage infrastructure is having trouble keeping up. This forces developments to use septic tanks. Many of these septic systems are placed in low-lying areas or in soils where they should not be. Others still are not being maintained property. All of this leads to septic leaks and nutrients entering local waterways. We would encourage local communities to work with new developments to be on municipal sewer lines, and the conversion of septic to sewer in as many existing septic systems as possible. Read more at Maintaining Your Septic Tank – https://nwdistrict.ifas.ufl.edu/nat/2017/04/29/maintain-your-septic-system-to-save-money-and-reduce-water-pollution/.
And then there are the lawns. We all enjoy nice looking lawns. However, many of the landscaping plans include designs that encourage plants that need to be watered and fertilized frequently as well as elevations that encourage runoff from our properties. Following the BMPs of the Florida Friendly Landscaping ProgramTM can help reduce the impact your lawn has on the nutrient loads of neighboring waterways. Read more at Florida Friendly Yards – https://nwdistrict.ifas.ufl.edu/nat/2018/06/08/restoring-the-health-of-pensacola-bay-what-can-you-do-to-help-a-florida-friendly-yard/.
For those who have boats, there is the Clean Boater Program. This program gives advice on how boaters can reduce their impacts on local waterways. Read more at Clean Boater – https://floridadep.gov/fco/cva/content/clean-boater-program.
One last snippet, those who live along the waterways themselves. There is a living shoreline program. The idea is return your shoreline to a more natural state (similar to the concept of Florida Friendly LandscapingTM). Doing so will reduce erosion of your property, enhance local fisheries, as well as reduce the amount of nutrients reaching the waterways from surrounding land. Installing a living shoreline will take some help from your local extension office. The state actually owns the land below the mean high tide line and, thus, you will need permission (a permit) to do so. Like the principals of a Florida Friendly Yard, there are specific plants you should use and they should be planted in a specific zone. Again, your county extension office can help with this. Read more at The Benefits of a Living Shoreline – https://nwdistrict.ifas.ufl.edu/nat/2017/10/06/the-benefits-of-a-living-shoreline/.
Though we may not be experiencing the dramatic problems that our friends in south Florida are currently experiencing, we do have our own problems here in the panhandle – and there is plenty we can do to keep the problems from getting worse. Please consider some of them. You can always contact your local county extension office for more information.
by Rick O'Connor | Aug 3, 2018
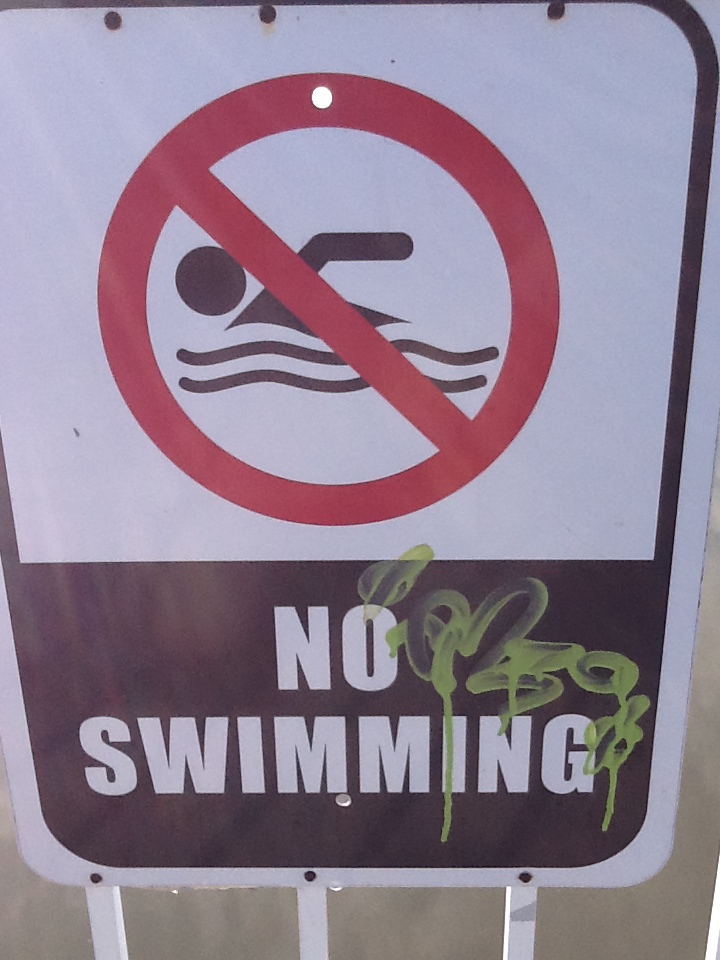
Of all the issues facing our local estuaries, high levels of fecal bacteria is the one that hinders commercial and recreational use the most. When bacteria levels increase and health advisories are issued, people become leery of swimming, paddling, or consuming seafood from these waterways.
Closed due to bacteria.
Photo: Rick O’Connor
I have been following the fecal bacteria situation in the Pensacola Bay system for several decades. Cheryl Bunch (Florida Department of Environmental Protection) has done an excellent job monitoring and reporting the bacteria levels, along with other parameters, for years – she has been fantastic.
The organisms used for monitoring have changed, so comparing numbers now and 30 years ago is somewhat difficult – but those changes came with good reason.
Fecal bacteria are organisms found in the large intestine of birds and mammals. They assist with digestion and are not a real threat to our health. Understanding that both birds and mammals in and near our estuaries must defecate, it is understandable that some levels of these bacteria are in the waterways. However, when levels are high there is a concern there are high levels of waste in the water. This waste can carry other organisms that can cause health problems for humans – such as hepatitis and cholera. So fecal bacteria monitoring is used as a proxy for other potential harmful organisms. No one wants to swim in sewage.
E. coli is a classic proxy for this type of monitoring and has been used for years. Recently it was found that saline water could kill some of the fecal bacteria – giving monitors’ low readings in estuarine systems – suggesting that there is little sewage in the water – when in fact there may be high levels of sewage undetected. They have found Enterococcus a better proxy for marine waters, particularly Enterococcus faecalis. Researchers have determined that a single sample of bay water should have more than 35 colonies of Enterococcus (ENT). If they find 35 or more colonies – a second sample is taken. If the counts are again high – a health advisory will be issued.
Over the last 30 years of monitoring FDEP’s reports on the Pensacola Bay area – there have been patterns. Most of the “hot spots” have been bayous and locations where rivers are discharging into an estuary. In addition, the periods of high fecal counts correspond well with periods of high rainfall. Locally, in the Pensacola Bay area, sampling has been reduced due to budget issues and some bodies of water are not sampled as often as others. Today both FDEP and the Florida Department of Health (FDOH) monitor and post their data via the Healthy Beaches Program. In this program, the sample stations are commonly used swimming areas – meaning some other locations are rarely, if ever, sampled. Based on these data, 30-40% of the samples from local bayous annually require a health advisory to be issued.
Health advisories can reduce interest in human related recreation activities, such as wakeboarding, paddling, or even fishing – and certainly impacts interest in swimming. Decades ago, swimming and skiing were very popular in local bayous. Today it is rare to see anyone doing so – most are motoring through heading to open bodies of water to spend their day. It may also be effecting property purchases. I have been contacted more than once with the question “would you buy on a house on XXX Bayou?”
Several local waterways are listed as impaired, and one is a BMAP area, due to high levels of bacteria. A BMAP (Basin Management Action Plan – read more at the link below) is a state designated body of water that is impaired (for some reason) and is required to make annual improvements to reduce the problem.
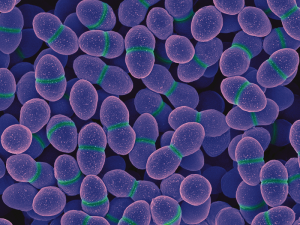
The spherical cells of the “coccus” bacteria Enterococcus.
Photo: National Institute of Health
So What Can We Do to Reduce This Problem?
In the Pensacola area, both the city and county have made efforts to modify and improve stormwater problems. Baffle boxes in east Pensacola have helped to reduce the amount of runoff entering the bayous and bays, thus reducing the frequency health advisories are being issued. That said, during heavy events the counts still increase – and rainfall seems to be increasing in the area in recent years. We will continue to monitor the frequency of advisories and post these on Sea Grant Notes through the Escambia County extension office each week.
From our side of the story (you and me) – anything you can do to reduce runoff will certainly help. Florida Friendly Landscaping techniques are a good start (see article on FFL posted below). Clean up after your pet, both in your yard and after walks – most people do… but not all. Septic systems have been a point of concern. If you have a septic system, maintain it (see article below on how). If the opportunity presents itself, you can move from septic to a sewer system. At many public places along the waterfront have signs asking everyone not to feed the birds. Congregating birds equals congregating bird feces and this can be a health issue.
Local and state governments are working to reduce the stormwater impacts on our local estuaries – which trigger other problems as well as high bacteria counts. Local residents and businesses can do the same.
References
Lewis, M.J., J.T. Kirschenfeld, T. Goodhart. 2016. Environmental Quality of the Pensacola Bay System: Retrospective Review for Future Resource Management and Rehabilitation. U.S. Environmental Protection Agency. Gulf Breeze FL. EPA/600/R-16/169.
BMAP
https://floridadep.gov/dear/water-quality-restoration/content/basin-management-action-plans-bmaps.
Florida Friendly Landscaping
Restoring the Health of Pensacola Bay, What You Can Do to Help? – Florida Friendly Landscaping
http://blogs.ifas.ufl.edu/escambiaco/2018/06/08/restoring-the-health-of-pensacola-bay-what-can-you-do-to-help-a-florida-friendly-yard/.
Septic Systems
Maintain Your Septic Tank System to Save Money and Reduce Water Pollution
https://nwdistrict.ifas.ufl.edu/nat/2017/04/29/maintain-your-septic-system-to-save-money-and-reduce-water-pollution/.
Septic Tanks: What You Should Do When a Flood Occurs
https://nwdistrict.ifas.ufl.edu/nat/2018/05/04/septic-systems-what-should-you-do-when-a-flood-occurs/.
by Rick O'Connor | Jul 6, 2018
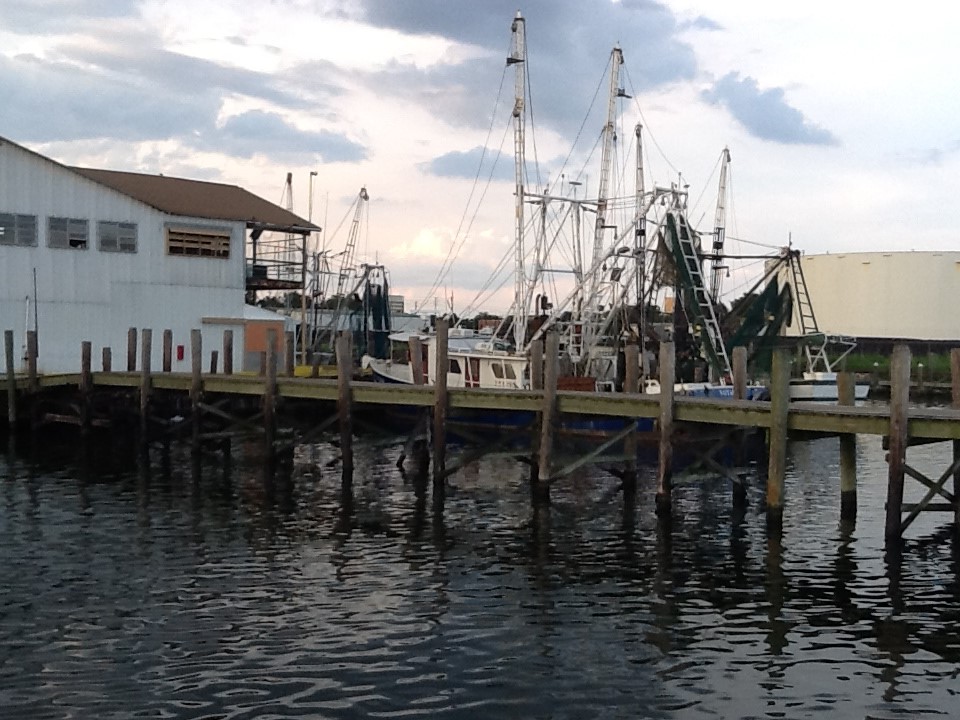
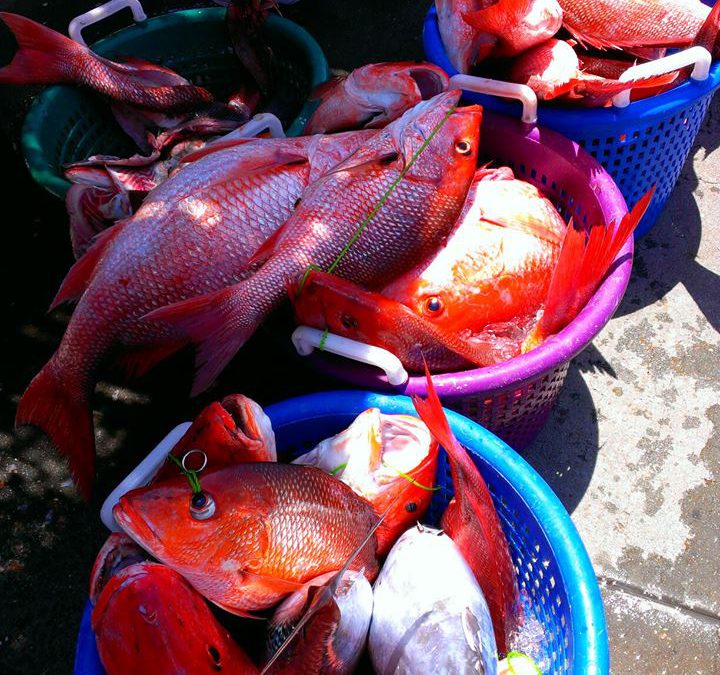
Shrimp, oysters, blue crab and fish have been harvested from the Pensacola Bay System (PBS) for decades, although there has been a decline in all in recent years. Annual landings (in pounds) have ranged from
- Fish 66,000 – 4,600,000 (most are scaienids)
- Brown shrimp 43,000 – 906,000
- Oysters 0 – 492,000
- Blue crab 400 – 137,000
There is a concern about the safety of seafood harvested from our estuary… sort of. Many local residents and visitors ask frequently about the safety of these products. However, when programs are held to provide this information they are not well attended, and when articles are posted – few view them. I think there is a concern for the safety of seafood products, particularly those from our estuaries – so I cannot explain the lack of interest in the presentations and articles.
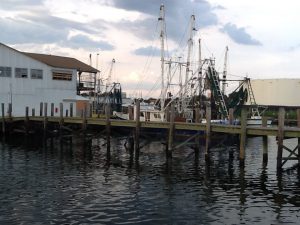
Commercial seafood in Pensacola has a long history.
Photo: Rick O’Connor
One contaminant that gets a lot of press is mercury. The toxic form of mercury is methylmercury. This form of mercury impairs brain development of fetuses – hearing, vision, and muscle function in adults. Studies suggests that the primary source of mercury in the waters of the PBS is the atmosphere. Advisories have been issued for Escambia, Blackwater, and Yellow Rivers. There have also been advisories for local largemouth and king mackerel. This is one of the metals whose concentrations within the PBS is higher than neighboring estuaries – especially in our bayous (see https://blogs.ifas.ufl.edu/escambiaco/2018/06/13/restoring-the-health-of-pensacola-bay-what-can-you-do-to-help-bioaccumulation-of-toxins/.) Florida Department of Environmental Protection (FDEP) has issued Total Maximum Daily Loads (TDMLs) for mercury in the PBS.
So How Much is Too Much?
For monitoring purposes, total mercury (THg) is easier and less expensive to than the toxic form methylmercury (MHg). Many believe the amount of THg is equivalent to the concentration of MHg, and so it is used as a proxy for MHg.
Both the U.S. EPA and the FDEP recommend concentrations of THg not be higher than 0.3 ppm, and 0.1 ppm for pregnant women (or women planning a pregnancy).
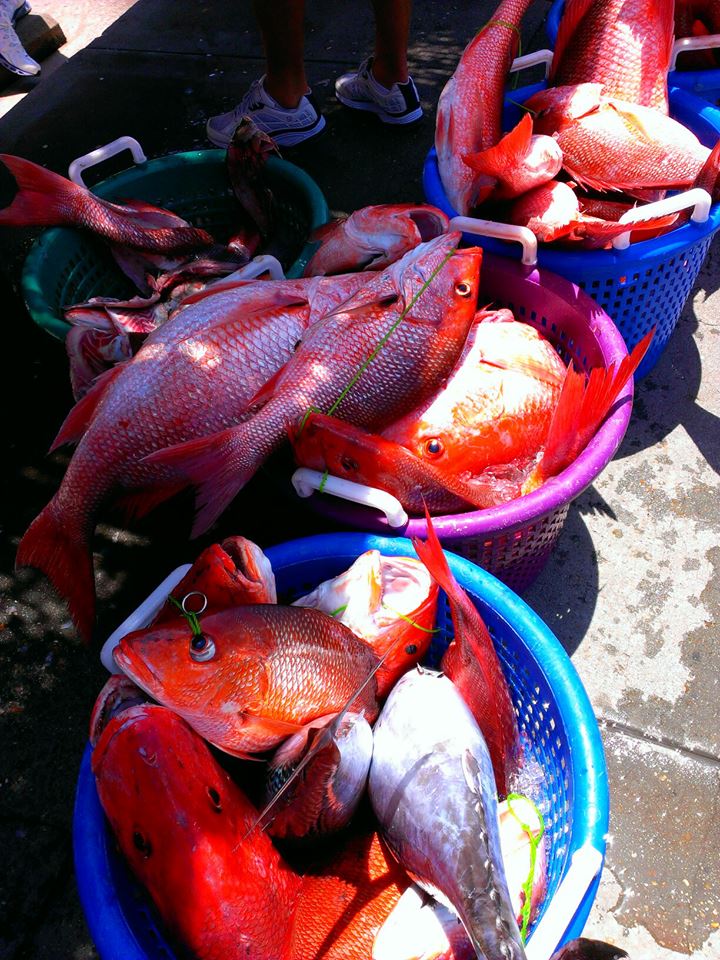
Fish
Since 2000, four studies have been conducted on six species of fish in the PBS. Concentrations of THg ranged from 0.02 – 0.88 ppm and averaged between 0.2 – 0.4 ppm.
Blue Crab
Two studies have been conducted since 2007 found mercury concentrations ranged from 0.07 – 1.1 ppm.
Oysters
30 years ago, studies were finding concentrations of THg in oysters around 0.02 ppm. Repeated studies between 1986 and 1996 found an increase to 0.3 ppm.
Overall
Studies suggest that shrimp and oysters have lower concentrations of THg than blue crab and fish.

Seafood has a long history along Florida’s panhandle.
Photo: Betsy Walker
How often have samples exceeded the safe levels suggested by EPA, FDEP, and FDA?
| Group |
Recommended highest level |
% of times samples from PBS exceeded this limit |
| Subsistence Fishermen |
0.049 ppm |
50-90%
(89% for blue crab and oysters) |
| Pregnant females |
0.1 ppm |
50-90%
(88% for blue crab) |
| General public |
0.3 ppm |
5-20%
(12% for blue crabs)
(27% for fish) |
| Food and Drug Administration recommendation |
1.0 ppm |
0% |
The concern for mercury in local seafood has led to a reduction of consuming all seafood by pregnant women – period. Recent studies have shown this can have negative effects on the developing baby as well. The recommendation is to avoid fish that have been tested high in THg. Most of these are high on the food chain – such as king mackerel, shark, and swordfish. You can find the latest on seafood safety and advisories at https://myescambia.com/our-services/natural-resources-management/marine-resources/seafood-safety. Another piece of this story is the belief, by many, that selenium can lower the toxicity of MHg. Many believe that molar ratios of selenium and mercury greater than 1.0 can reduce the toxicity. However, there have been no studies on molar ratios of these elements in the PBS.
The bottom line on this issue is to be selective on the seafood products you consume.
The most popular seafood species – shrimp.
Reference
Lewis, M.J., J.T. Kirschenfeld, T. Goodhart. 2016. Environmental Quality of the Pensacola Bay System: Retrospective Review for Future Resource Management and Rehabilitation. U.S. Environmental Protection Agency. Gulf Breeze FL. EPA/600/R-16/169.
by Rick O'Connor | Jun 22, 2018
What is bioaccumulation of toxins?
Our bodies come in contact, and produce, toxins every day. The production of toxins can result during simple metabolism of food. However, our bodies are designed with a system to rid us of these toxins. Toxins are processed by our immune system and removed via our kidneys. Some chemical compounds are structured in a way that they are not as easily removed, thus they accumulate in our bodies over time, often in fatty tissues, and sometimes they are toxic – this is bioaccumulation.
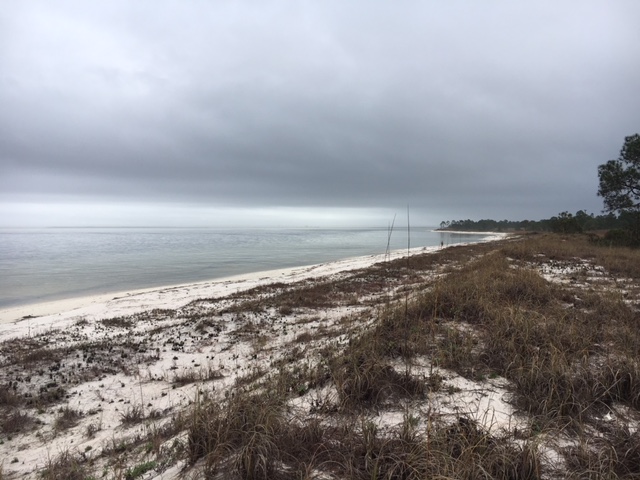
A view of Pensacola Bay from Santa Rosa Island.
Photo: Rick O’Connor
Biomagnification takes it a step further. In many cases, the concentrations of bioaccumulating toxic substances in the water may be in low enough concentrations to have little effect on human health. They are ingested by small organisms in the environment, such as plankton or juvenile marine fish, and – again are at low concentrations. However, they are accumulated in their tissues and as the next level of the food chain begin to consume them – they too accumulate the toxic compounds in their tissues. Small fish consume large amounts of plankton and thus, large amounts of the toxins they have accumulated – increasing the concentration within their own tissues. This continues up the food chain to a point where, in the larger predators, the concentrations of these toxins have increased enough that they now pose a threat to human health – this is biomagnification.
The presence, and amount, of any one bioaccumulating compound varies with species, their size, their age, their gender, their life stage, whether they are mobile or not, their diet, and whether the sample included the skin (which is lipid heavy and a common location for accumulated toxins). In the Pensacola Bay System, about 30 species of marine plants and animals have been analyzed for the presence of these accumulating compounds.
Species collected from Pensacola Bay that were analyzed for contaminants
| Plants |
3 species of seagrass
1 species of seaweed
Colonized algal periphyton |
| Invertebrates |
4 species of freshwater mussels
Eastern oyster
1 species of brackish water clams
1 species of barnacle
Several species of shrimp
Blue crab
Oyster drill (snail) |
| Vertebrates |
2 species of catfish
5 species of scaienids (drums, croakers, trout)
Bluegill
Bluefish
Several species of flounder
2 species of jacks
Largemouth bass
Sheepshead
Striped mullet |
Trace Metal Accumulation
Much of what has been studied in terms of metal accumulation has come from shellfish – particularly eastern oysters. Ten different metals have been found in oysters with zinc being in the highest concentration and lead the lowest. A 2005 study found that levels of arsenic, lead, and nickel collected from mussels collected at selected locations in the PBS were regionally high (meaning higher than other estuaries in the region). Another study (2003) found that levels of 16 different metals in shellfish were three times higher in Bayou Chico than samples from East Bay. A 1993 study found that organisms attached to pieces of treated wood in Santa Rosa Sound had elevated levels of metals. However, another study (2008) found low concentrations of metals in five species of fish collected in Escambia Bay near the I-10 Bridge.
The bioaccumulation potential within plants is less understood than animals. That said – concentrations within seagrass were relatively low when compared to the sediments they were growing in and periphytic algae attached to them.
Total Mercury Concentrations (ng/g – dry weight) for Local Marine Organisms
Lewis and Chaney (2008)
| Range (ng/g) |
Species |
| 0-200 |
Sediments, seagrass, oysters |
| 200 – 400 |
Periphytic algae |
| 400 – 600 |
Mussels |
| 600 – 800 |
Brackish clams, blue crabs |
| 800 and higher |
Fish |
The above table shows biomagnification.
Comparing trace metal concentrations between Pensacola Bay and other Regional Estuaries
(USEPA unpublished data)
| Pensacola Bay, Escambia Bay, Escambia River, Bayou Texar, Bayou Chico, Bayou Grande, Santa Rosa Sound |
Grand Lagoon (Bay Co.), Mississippi Sound, Old River, Suwannee River, Withlacoochee River, Bay La Launch |
| Cadmium |
Higher in PBS; highest in Bayou’s Grande and Texar |
| Chromium |
Similar to other estuaries |
| Copper |
Slightly elevated in Bayou Chico and Escambia River; highest in Withlacoochee |
| Total Mercury |
Much higher in PBS; particularly in the bayous |
| Nickel |
Lower in PBS |
| Lead |
Higher in PBS; particularly in the bayous |
| Zinc |
Higher in PBS; particularly in the bayous |
There are higher concentrations of trace metals in PBS and particularly in the bayous.
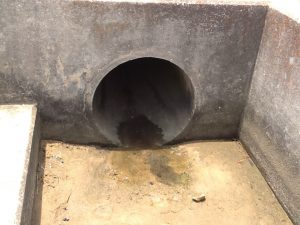
One of 39 stormwater drains into Bayou Texar.
Photo: Rick O’Connor
Non-Nutrient Organic Chemicals
These are compounds such as PCBs, DDT, and PAHs; many are actually families of multiple forms of compounds. Information on the bioaccumulation of these compounds in PBS is less common than those of trace metals. However, this information is important since they have long half-lives and magnify within the food web.
That said – there are studies on these compounds that go back to the 1970’s. They looked at DDT, pesticides, and PAHs in oysters and croakers. One study (1986-96) found DDT concentrations in oysters at 60 ppb or less. A follow up study (2004-05) at those same locations found concentrations between 8-20 ppb. One study (2008) found the order of accumulating non-nutrient organic compounds with PAHs as the highest and dieldrin at the lowest. Downward trends were reported (2004-05) for many of these compounds including PAHs and PCBs.
Some of these compounds have entered the PBS via unlined ponds associated with on-land Superfund sites. Creosote and pentachlorophenol were stored for years in such ponds and have leached into area waters such as Bayou Chico and portions of upper Pensacola Bay. A study (1987-88) found oyster drills sampled in these areas had concentrations 10x higher than reference sites in other parts of the PBS.
So what can we do about this?
The compounds that are there – are there. Many of these trace metals are heavy and sink into the sediments. There occurrence within the food web has decreased over time and some have suggested the safest thing to do is to leave them where they are. No doubt, any project requiring sediment movement requires much review and permitting.
To try to remove these compounds would be extremely expensive – hence the Superfund Program. So if we cannot clean the sediments without a lot of labor and money, can we reduce the amount that enters the bay today?
Many of these compounds come from industrial processing of products we really want or need. Reduction of the production of some will be difficult, but there is much industry can do to reduce the chance of those compounds reaching our estuaries – and they are doing this. Point source pollution (direct discharge from an industry) has reduced significantly since the 1970’s. Non-point sources (indirect discharge from you and I) is still a problem. We can choose products that contain less (or none) of the compounds we discussed. Following an IPM program for dealing with household and lawn pests (see article on Florida Friendly Yards – https://blogs.ifas.ufl.edu/escambiaco/2018/06/08/restoring-the-health-of-pensacola-bay-what-can-you-do-to-help-a-florida-friendly-yard/) can help a lot. As can practices that reduce the amount of run-off reaching our bays. Reducing your use of lawn watering, using rain barrels, or rain gardens, and planting living shorelines (all mentioned in the FFY article) can certainly help.
Reference
Lewis, M.J., J.T. Kirschenfeld, T. Goodhart. 2016. Environmental Quality of the Pensacola Bay System: Retrospective Review for Future Resource Management and Rehabilitation. U.S. Environmental Protection Agency. Gulf Breeze FL. EPA/600/R-16/169.
by Andrea Albertin | Jun 8, 2018
Flooding along the South Prong of the Black Creek River in Clay County on September 13, 2017. Photo credit: Tim Donovan, Florida Fish and Wildlife Conservation Commission (FWC).
As hurricane season is upon us again, I wanted to share the results of work that UF/IFAS Extension staff did with collaborators from Virginia Tech and Texas A&M University to help private well owners impacted by Hurricanes Irma and Harvey last year. This work highlights just how important it is to be prepared for this year’s hurricane season and to make sure that if flooding does occur, those that depend on private wells for household use take the proper precautions to ensure the safety of their drinking water.
About 2.5 million Floridians (approximately 12% of the population) rely on private wells for home consumption. While public water systems are regulated by the U.S. Environmental Protection Agency to ensure safe drinking water, private wells are not regulated. Private well users are responsible for ensuring the safety of their own water.
Hurricanes Irma and Harvey
In response to widespread damage and flooding caused by Hurricane Harvey in Texas and Irma in Florida in August and September 2017, Virginia Polytechnic Institute and State University (VT) received a Rapid Research Response Grant from the National Science Foundation to offer free well water testing to homeowners impacted by flooding.
They partnered with Texas A&M AgriLife Extension’s Well Owner Network (run by Diane Boellstorff and Drew Gholson) and us, at UF/IFAS Extension to provide this service. The effort at VT was led by members of Marc Edward’s lab in the Civil Engineering Department: Kelsey Pieper, Kristine Mapili, William Rhoads, and Greg House.
VT made 1,200 sampling kits available in Texas and 500 in Florida, and offered free analysis for total coliform bacteria and E. coli as well as other parameters, including nitrate, lead, arsenic, iron, chloride, sodium, manganese, copper, fluoride, sulfate, and hardness (calcium and magnesium). Homeowners were also asked to complete a needs assessment questionnaire regarding their well system characteristics, knowledge of proper maintenance and testing, perceptions of the safety of their water and how to best engage them in future outreach and education efforts.
Response in the aftermath of Irma
Although the sampling kits were available, a major challenge in the wake of Irma was getting the word out as counties were just beginning to assess damage and many areas were without power. We coordinated the sampling effort out of Quincy, Florida, where I am based, and spread the word to extension agents in the rest of the state primarily through a group texting app, by telephone and by word of mouth. Extension agents in 6 affected counties (Lee, Pasco, Sarasota, Marion, Clay and Putnam) responded with a need for sample kits, and they in turn advertised sampling to their residents through press releases.
Residents picked up sampling kits and returned water samples and surveys on specified days and the samples were shipped overnight and analyzed at VT, in Blacksburg, VA. Anyone from nearby counties was welcome to submit samples as well. This effort complemented free well water sampling offered by multiple county health departments throughout the state.
In all, 179 water samples from Florida were analyzed at VT and results of the bacterial analysis are shown in the table below. Of 154 valid samples, 58 (38%) tested positive for total coliform bacteria, and 3 (2%) tested positive for E. coli. Results of the inorganic parameters and the needs assessment questionnaire are still being analyzed.
Table 1. Bacterial analysis of private wells in Florida after Hurricane Irma.
| County |
Number of samples (n) |
Positive for total coliform (n) |
Positive total coliform (%) |
Positive for E. coli (n) |
Positive for E. coli (%) |
| Citrus |
1 |
0 |
0% |
0 |
0% |
| Clay |
13 |
5 |
38% |
0 |
0% |
| Hernando |
2 |
1 |
50% |
0 |
0% |
| Hillsborough |
1 |
1 |
100% |
0 |
0% |
| Marion |
19 |
5 |
26% |
1 |
5% |
| Monroe |
1 |
0 |
0% |
0 |
0% |
| Pasco |
40 |
19 |
48% |
1 |
3% |
| Putnam |
61 |
19 |
31% |
0 |
0% |
| Sarasota |
16 |
8 |
50% |
1 |
6% |
| Overall |
154 |
58 |
38% |
3 |
2% |
Of 630 samples analyzed in Texas over the course of 7 weeks post-Hurricane Harvey, 293 samples (47% of wells) tested positive for total coliform bacteria and 75 samples (2%) tested positive for E. coli.
What to do if pathogens are found
Following Florida Department of Health (FDOH) guidelines, we recommended well disinfection to residents whose samples tested positive for total coliform bacteria, or both total coliform and E. coli. This is generally done through shock chlorination by either hiring a well operator or by doing it yourself. The FDOH website provides information on potential contaminants, how to shock chlorinate a well and how to maintain your well to ensure the quality of your well water (http://www.floridahealth.gov/environmental-health/private-well-testing/index.html).
UF/IFAS extension agents that led the sampling efforts in their respective counties were: Roy Beckford – Lee County; Brad Burbaugh – Clay County; Whitney Elmore – Pasco County; Sharon Treen – Putnam and Flagler Counties; Abbey Tyrna – Sarasota County and Yilin Zhuang – Marion County.
We at IFAS Extension are working on using results from this sampling effort and the needs assessment questionnaire filled out by residents to develop the UF/IFAS Florida Well Owner Network. Our goal is to provide residents with educational materials and classes to address gaps in knowledge regarding well maintenance, the importance of testing and recommended treatments when pathogens and other contaminants are present.
Remember: Get your well water tested if flooding occurs
It’s important to remember that if any flooding occurs on your property that affects your well and/or septic system, you should have your well water tested in a certified laboratory for pathogens (total coliform bacteria and E. coli) and any other parameters your local health department may recommend.
Most county health departments accept samples for water testing. You can also submit samples to a certified commercial lab near you. Contact your county health department for information about what to have your water tested for and how to take and submit the sample.
Contact information for county health departments can be found online at: http://www.floridahealth.gov/programs-and-services/county-health-departments/find-a-county-health-department/index.html
You can search for laboratories near you certified by FDOH here: https://fldeploc.dep.state.fl.us/aams/loc_search.asp This includes county health department labs as well as commercial labs, university labs and others.
You should also have your well water tested at any time when:
- The color, taste or odor of your well water changes or if you suspect that someone became sick after drinking your well water
- A new well is drilled or if you have had maintenance done on your existing well
Testing well water once a year is good practice to ensure the safety of your household’s drinking water.
by Andrea Albertin | May 4, 2018
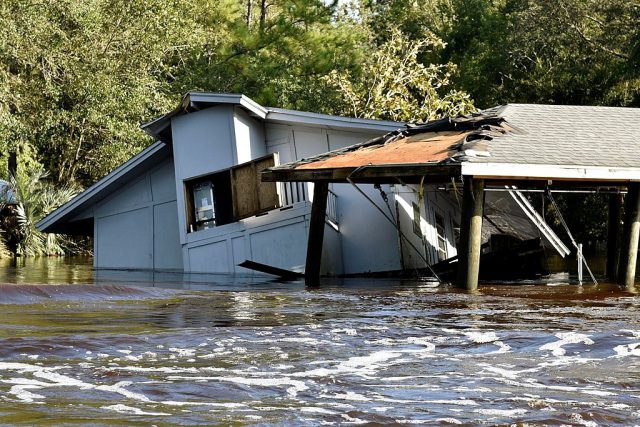
Special care needs to be taken with a septic system after a flood or heavy rains. Photo credit: Flooding in Deltona, FL after Hurricane Irma. P. Lynch/FEMA
Approximately 30% of Florida’s population relies on septic systems, or onsite sewage treatment and disposal systems (OSTDS), to treat and dispose of household wastewater. This includes all water from bathrooms and kitchens, and laundry machines.
When properly maintained, septic systems can last 25-30 years, and maintenance costs are relatively low. In a nutshell, the most important things you can do to maintain your system is to make sure nothing but toilet paper is flushed down toilets, reduce the amount of oils and fats that go down your kitchen sink, and have the system pumped every 3-5 years, depending on the size of your tank and number of people in your household.
During floods or heavy rains, the soil around the septic tank and in the drain field become saturated, or water-logged, and the effluent from the septic tank can’t properly drain though the soil. Special care needs to be taken with your septic system during and after a flood or heavy rains.
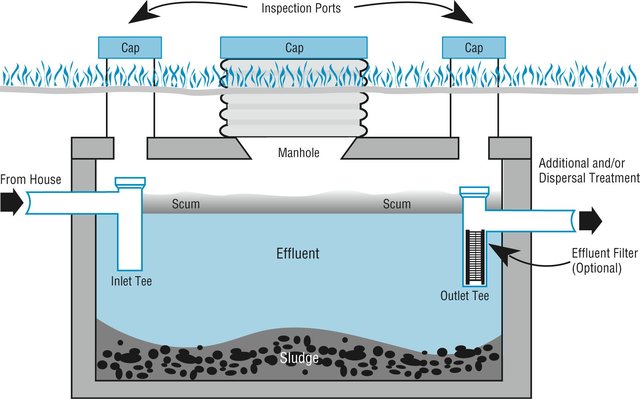
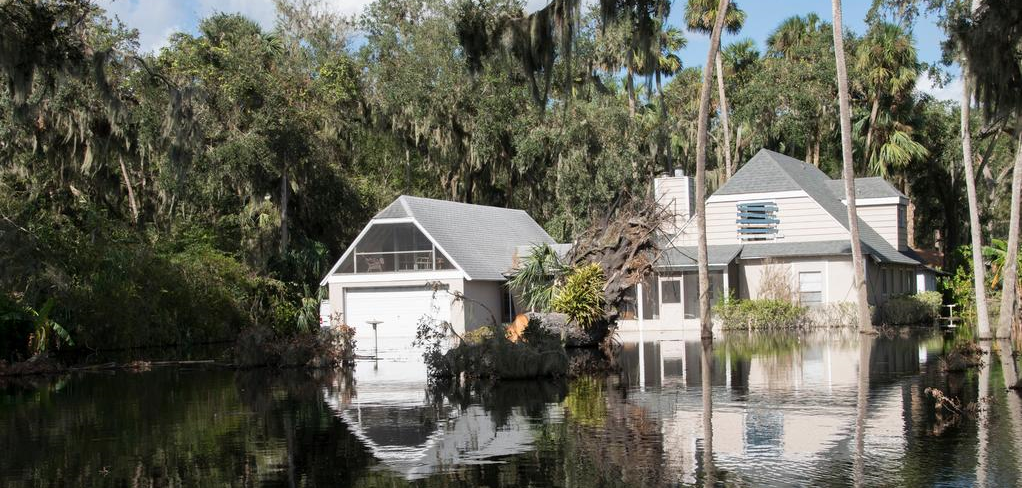
Image credit: wfeiden CC by SA 2.0
How does a traditional septic system work?
The most common type of OSTDS is a conventional septic system, made up of (1) a septic tank (above), which is a watertight container buried in the ground and (2) a drain field, or leach field. The effluent (liquid wastewater) from the tank flows into the drain field, which is usually a series of buried perforated pipes. The septic tank’s job is to separate out solids (which settle on the bottom as sludge), from oils and grease, which float to the top and form a scum layer. Bacteria break down the solids (the organic matter) in the tank. The effluent, which is in the middle layer of the tank, flows out of the tank and into the drain field where it then percolates down through the ground.
During floods or heavy rains, the soil around the septic tank and in the drain field become saturated, or water-logged, and the effluent from the septic tank can’t properly drain though the soil. Special care needs to be taken with your septic system during and after a flood or heavy rains.
What should you do after flooding occurs?
- Relieve pressure on the septic system by using it less or not at all until floodwaters recede and the soil has drained. For your septic system to work properly, water needs to drain freely in the drain field. Under flooded conditions, water can’t drain properly and can back up in your system. Remember that in most homes all water sent down the pipes goes into the septic system. Clean up floodwater in the house without dumping it into the sinks or toilet.
- Avoid digging around the septic tank and drain field while the soil is water logged. Don’t drive heavy vehicles or equipment over the drain field. By using heavy equipment or working under water-logged conditions, you can compact the soil in your drain field, and water won’t be able to drain properly.
- Don’t open or pump out the septic tank if the soil is still saturated. Silt and mud can get into the tank if it is opened, and can end up in the drain field, reducing its drainage capability. Pumping under these conditions can also cause a tank to pop out of the ground.
- If you suspect your system has been damage, have the tank inspected and serviced by a professional. How can you tell if your system is damaged? Signs include: settling, wastewater backs up into household drains, the soil in the drain field remains soggy and never fully drains, and/or a foul odor persists around the tank and drain field.
- Keep rainwater drainage systems away from the septic drain field. As a preventive measure, make sure that water from roof gutters doesn’t drain into your septic drain field – this adds an additional source of water that the drain field has to manage.
More information on septic system maintenance after flooding can be found on the EPA website publication https://www.epa.gov/ground-water-and-drinking-water/septic-systems-what-do-after-flood
By taking special care with your septic system after flooding, you can contribute to the health of your household, community and environment.