by Rick O'Connor | Sep 15, 2025
Introduction
The bay scallop (Argopecten irradians) was once common in the lower portions of the Pensacola Bay system. However, by 1970 they were all but gone. Closely associated with seagrass, especially turtle grass (Thalassia testudinum), some suggested the decline was connected to the decline of seagrass beds in this part of the bay. Decline in water quality and overharvesting by humans may have also been a contributor. It was most likely a combination of these factors.
Scalloping is a popular activity in our state. It can be done with a simple mask and snorkel, in relatively shallow water, and is very family friendly. The decline witnessed in the lower Pensacola Bay system was witnessed in other estuaries along Florida’s Gulf coast. Today commercial harvest is banned, and recreational harvest is restricted to specific months and to the Big Bend region of the state. With the improvements in water quality and natural seagrass restoration, it is hoped that the bay scallop may return to lower Pensacola Bay.
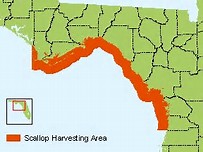
Scallop harvest area.
Image: Florida Department of Environmental Protection
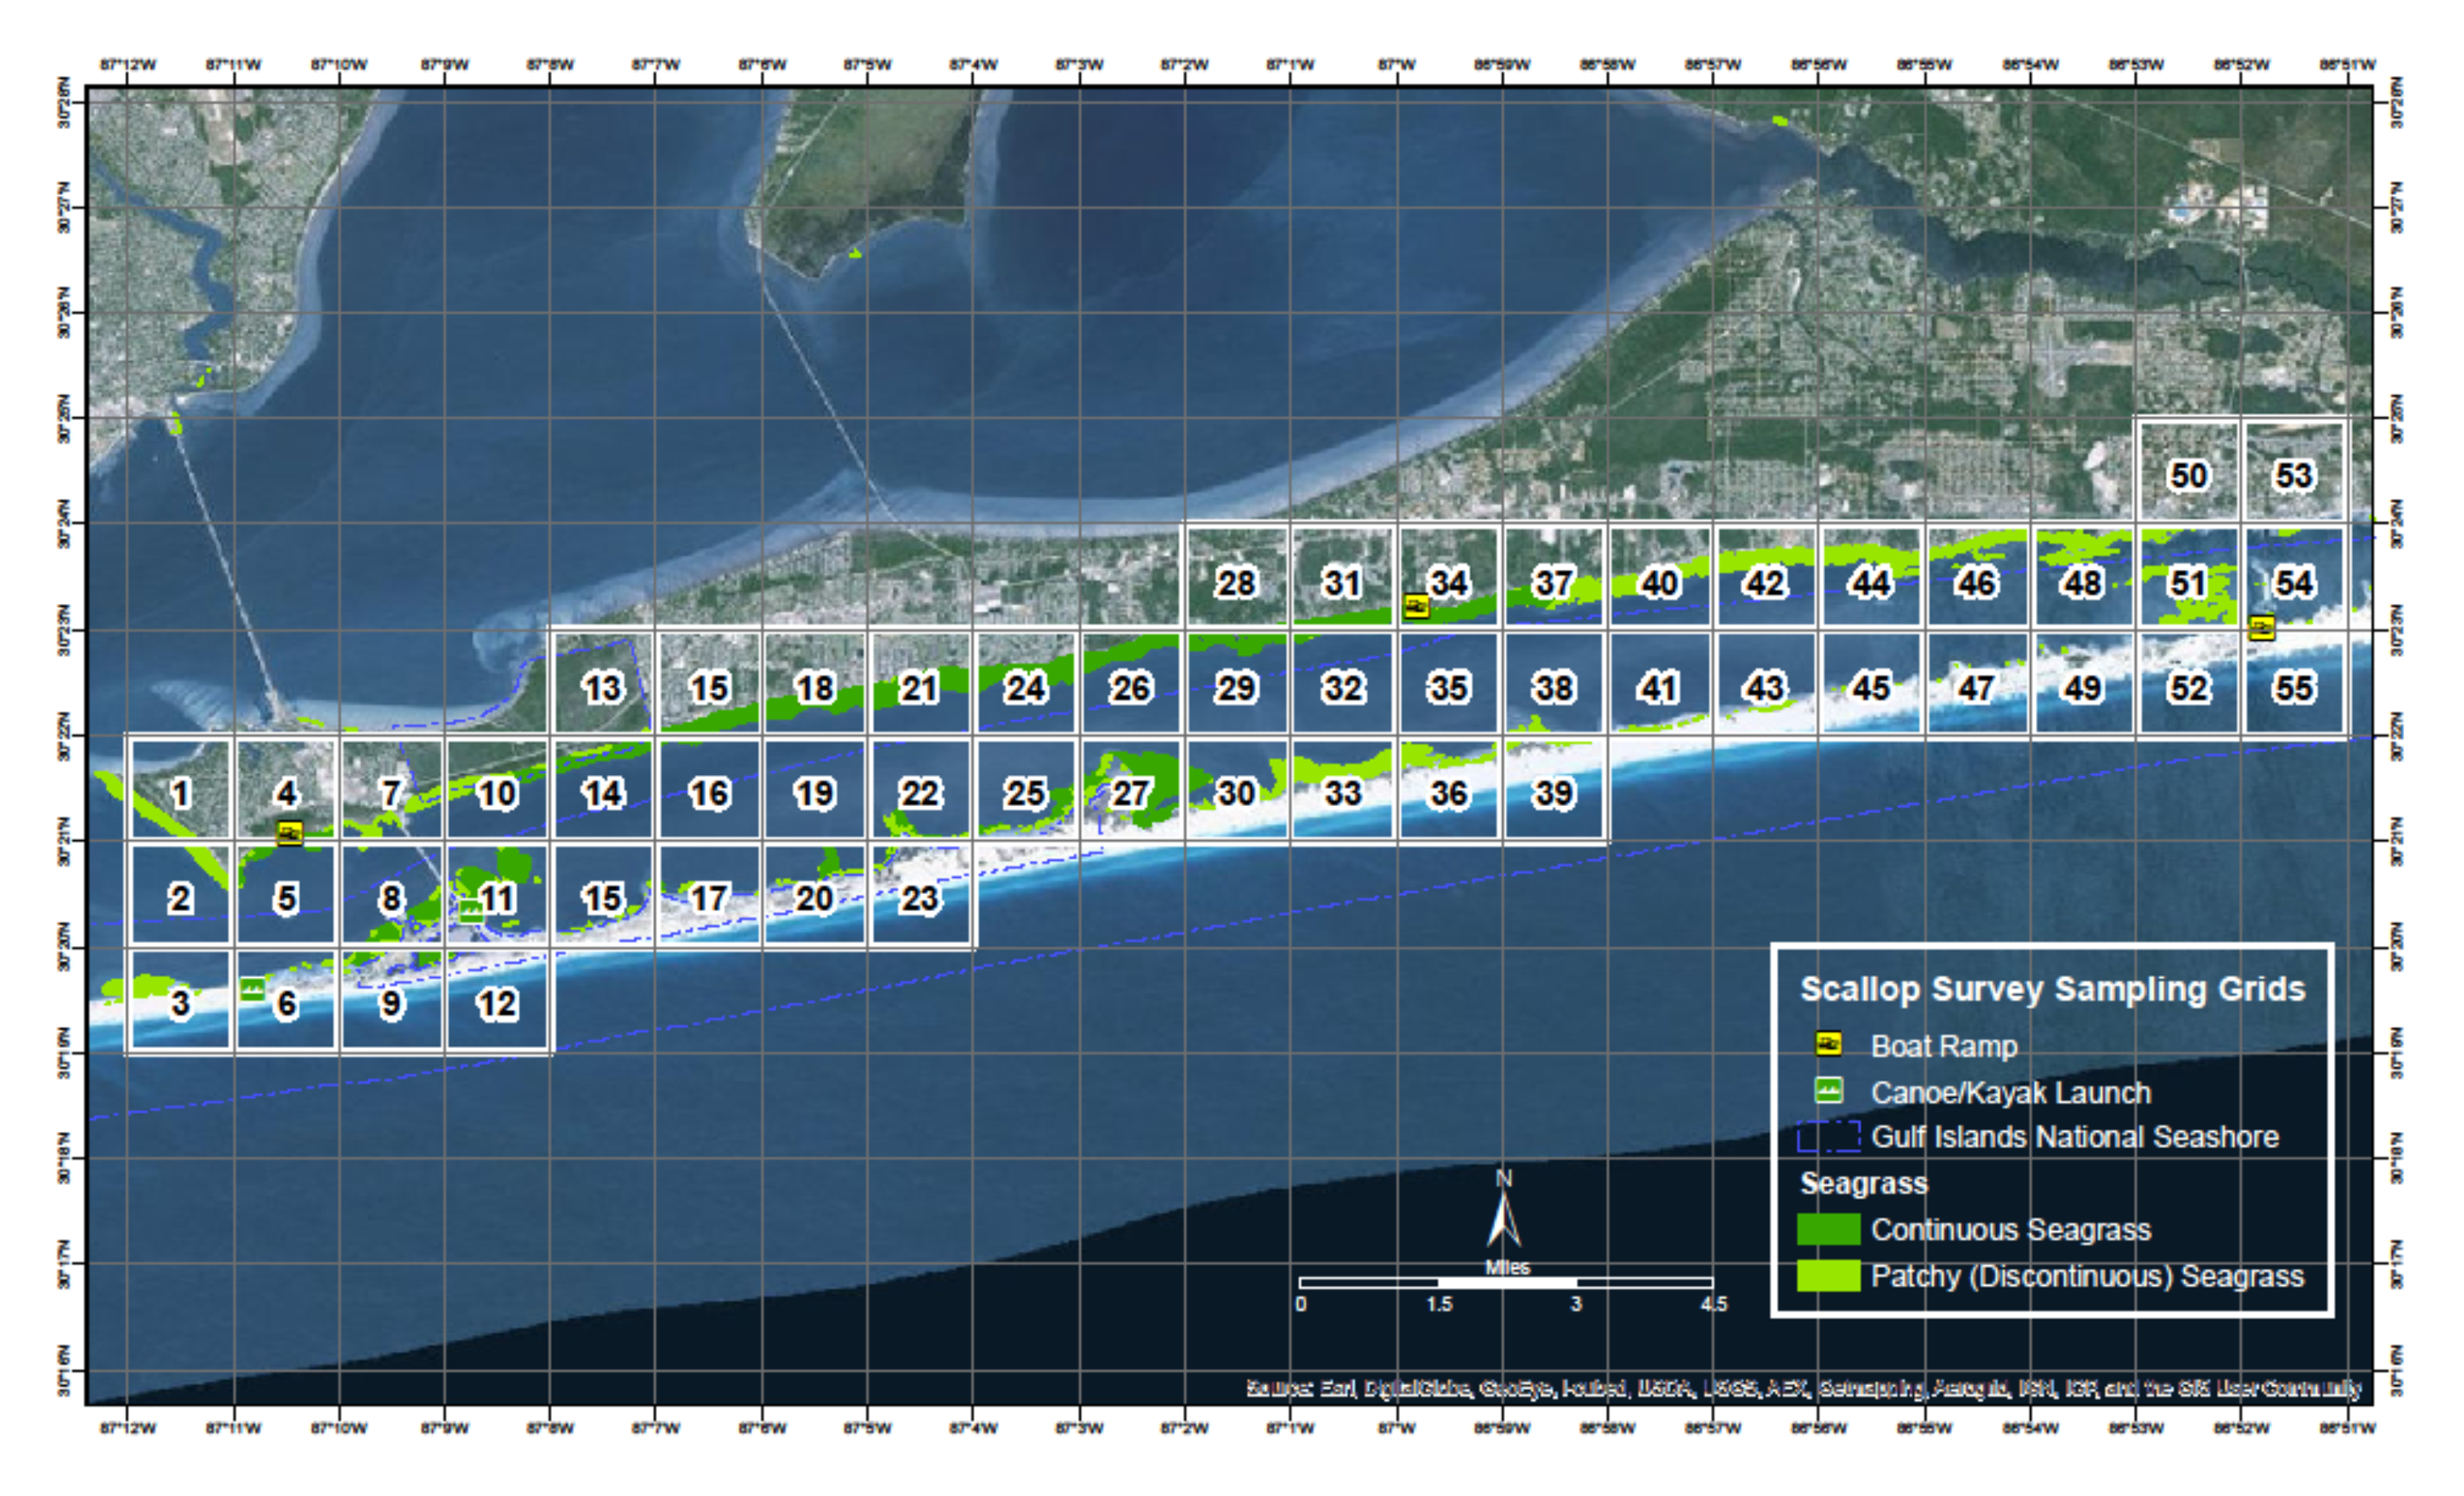
Since 2015 Florida Sea Grant has held the annual Pensacola Bay Scallop Search. Trained volunteers survey pre-determined grids within Big Lagoon and Santa Rosa Sound. Below is the report for both the 2025 survey and the overall results since 2015.
Methods
Scallop searchers are volunteers trained by Florida Sea Grant. Teams are made up of at least three members. Two snorkel while one is the data recorder. More than three can be on a team. Some pre-determined grids require a boat to access, others can be reached by paddle craft or on foot.
Once on site the volunteers extend a 50-meter transect line that is weighted on each end. Also attached is a white buoy to mark the end of the line. The two snorkelers survey the length of the transect, one on each side, using a 1-meter PVC pipe to determine where the area of the transect ends. This transect thus covers 100m2. The surveyors record the number of live scallops they find within this area, measure the height of the first five found in millimeters using a small caliper, which species of seagrass are within the transect, the percent coverage of the seagrass, whether macroalgae are present or not, and any other notes of interest – such as the presence of scallop shells or scallop predators (such as conchs and blue crabs). Three more transects are conducted within the grid before returning.
The Pensacola Scallop Search occurs during the month of July.
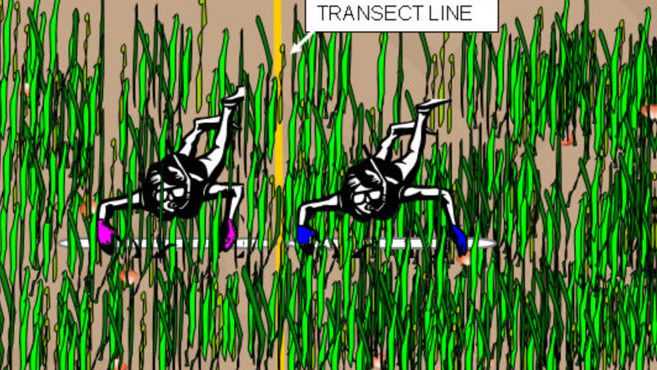
Snorkel transect method.
Image: University of Florida.
2025 Results
138 volunteers on 32 teams surveyed 22 of the 66 1-nautical mile grids (36%) between Big Lagoon State Park and Navarre Beach. 162 transects (16,200m2) were surveyed logging 8 scallops. All live scallops were reported from Santa Rosa Sound this year.
2025 Big Lagoon Results
13 teams surveyed 9 of the 11 grids (81%) within Big Lagoon. 76 transects were conducted covering 7,600m2.

No scallops were logged in 2025 though scallop shells were found. No sea urchins were reported but scallop predators – such as conchs, blue crabs, and rays were. This equates to 0.00 scallops/200m2 and moves Big Lagoon from a vulnerable system last year to a collapsed one this year. All three species of seagrass were found (Thalassia, Halodule, and Syringodium). Seagrass densities ranged from 50-100%. Macroalgae was present in 5 of the 9 grids (56%) and was reported abundant in grid 2.
2025 Santa Rosa Sound Results
19 teams surveyed 13 of the 55 grids (23%) in Santa Rosa Sound. 86 transects were conducted, covering 8,600m2.
8 scallops were logged which equates to 0.19 scallops/200m2. Scallop searchers reported blue crabs, conchs, and rays. All three species of seagrass were found. Seagrass densities ranged from 5-100%. Macroalgae was present in 7 of the 13 grids (54%) and was reported as abundant in 4 of those.
2015 – 2025 Big Lagoon Results
| Year |
No. of Transects |
No. of Scallops |
Scallops/200m2 |
| 2015 |
33 |
0 |
0.00 |
| 2016 |
47 |
0 |
0.00 |
| 2017 |
16 |
0 |
0.00 |
| 2018 |
28 |
0 |
0.00 |
| 2019 |
17 |
0 |
0.00 |
| 2020 |
16 |
1 |
0.12 |
| 2021 |
18 |
0 |
0.00 |
| 2022 |
38 |
0 |
0.00 |
| 2023 |
43 |
2 |
0.09 |
| 2024 |
67 |
101 |
3.02 |
| 2025 |
76 |
0 |
0.00 |
| Big Lagoon Overall |
399 |
104 |
0.52 |
2015 – 2025 Santa Rosa Sound Results
| Year |
No. of Transects |
No. of Scallops |
Scallops/200m2 |
| 2015 |
01 |
0 |
0.00 |
| 2016 |
01 |
0 |
0.00 |
| 2017 |
01 |
0 |
0.00 |
| 2018 |
01 |
0 |
0.00 |
| 2019 |
01 |
0 |
0.00 |
| 2020 |
01 |
0 |
0.00 |
| 2021 |
20 |
0 |
0.00 |
| 2022 |
40 |
2 |
0.11 |
| 2023 |
28 |
2 |
0.14 |
| 2024 |
85 |
32 |
0.76 |
| 2025 |
86 |
8 |
0.19 |
| Santa Rosa Sound Overall |
2591 |
44 |
0.34 |
1 Transects were conducted during these years but data for Santa Rosa Sound was logged by an intern with the Santa Rosa County Extension Office and is currently unavailable.
Discussion
Based on a Florida Fish and Wildlife Research Institute publication in 2018, the final criteria are used to classify scallop populations in Florida.
| Scallop Population / 200m2 |
Classification |
| 0-2 |
Collapsed |
| 2-20 |
Vulnerable |
| 20-200 |
Stable |
Based on this, over the last nine years we have surveyed, the populations in lower Pensacola Bay are still collapsed. Big Lagoon reached the vulnerable level in 2024, but no scallops were found there in 2025, returning to a collapsed state.
There are some possible explanations for low numbers in 2025.
- It has been reported by some shellfish biologists that bay scallops have a “boom-bust” cycle. Meaning that one year their populations “boom” before returning to normal numbers. We could have witnessed this between 2024 and 2025.
- Though we did not monitor water temperatures, July 2025 was extremely hot, and many volunteers reported their sites felt like “bath water”. Collecting efforts on other projects during July reported not capturing anything – no pinfish, hermit crabs – their nets were empty. It is possible that these warm conditions could have caused many organisms to move to deeper/cooler depths. Note here; as the project moved into August temperatures did begin to cool and searchers began reporting fish, conchs, blue crabs, and rays.
The Pensacola Bay area continues to have a collapsed system. The larger populations found in 2024 suggest that there are scallops in the area but may not be enough to increase their population status from collapsed to vulnerable. We will continue to monitor each July.
It is important for locals NOT to harvest scallops from either body of water. First, it is illegal. Second, any chance of recovering this lost population will be lost if the adult population densities are not high enough for reproductive success.
Acknowledgements
We would like to thank ALL 138 volunteers who surveyed this year. We obviously could not have done this without you.
Below are the “team captains”.
Ethan Sadowski John Imhof Kaden Luttermoser
John Wooten Susan Pinard Matt MacGregor
Christian Wagley Sean Hickey Jason Buck
Brian Mitchell Angela Guttman Caitlen Murrell
Samantha Brady (USM) Michelle Noa Kira Benton
Monica Hines Wesley Allen Kelly Krueger
Mikala Drees Jonathan Borowski Michael Currey
Gina Hertz Melinda Thoms Beau Vignes
Bill Garner Robert Moreland Stephanie Kissoon
Nick Roest Leah Yelverton

A team of scallop searchers celebrates after finding a few scallops in Pensacola Bay.

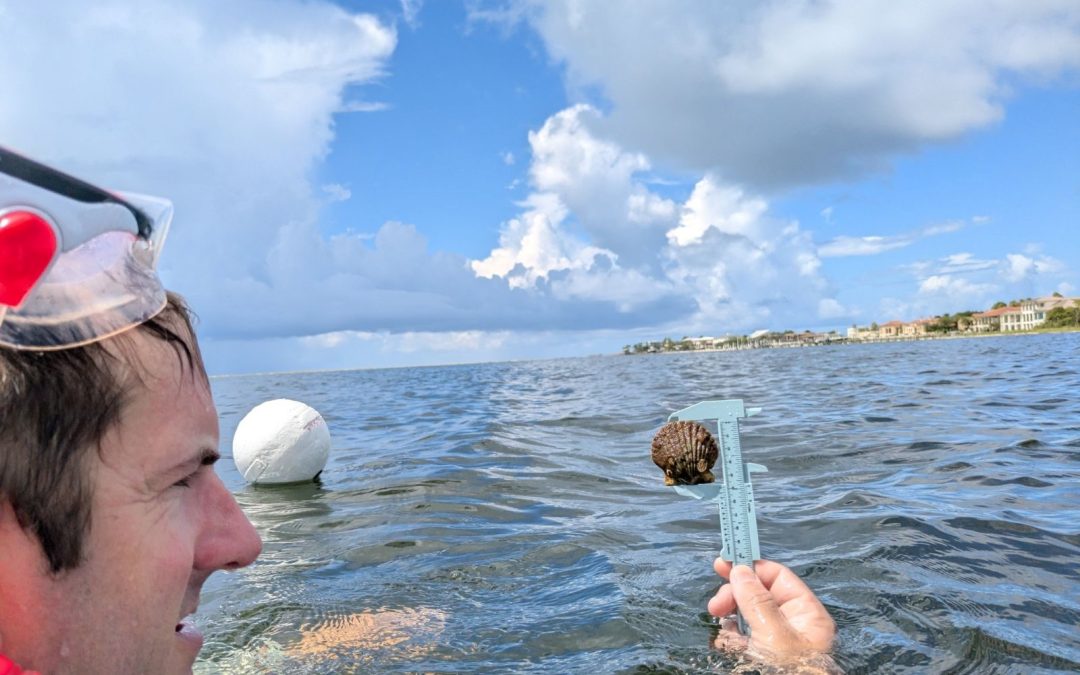
Volunteer measures a scallop he found.
Photo: Abby Nonnenmacher
by Dana Stephens | May 12, 2025
Spring is a time of change. Spring brings changes in our waters as well. Some of these changes are visible on top of the water and cause concern among water users and viewers. Let’s dispel some of these concerns associated with the spring season.
Sometimes, water users and viewers notice what appears to be oil floating on top of the water. Could this be oil? Potentially. Could this not be oil? Most likely. Plants perish, and decomposition occurs, typically during the spring and fall seasons of the year. Much of the decomposition that happens in spring is associated with the initial growth and development of plants. Bacteria living in the soils within and around the water break down the perished plants. These bacteria are decomposing the old plant material. The waste product produced from the bacteria’s decomposition of the old plant material is an oily substance. The oily sheen on the water is a waste product of bacteria. Frequently, the oil accumulates in portions of water where there is little to no water movement. As the decomposition process completes, the oily sheen should lessen over the next few days to weeks. This bacteria-produced oil from decomposition is a natural process.
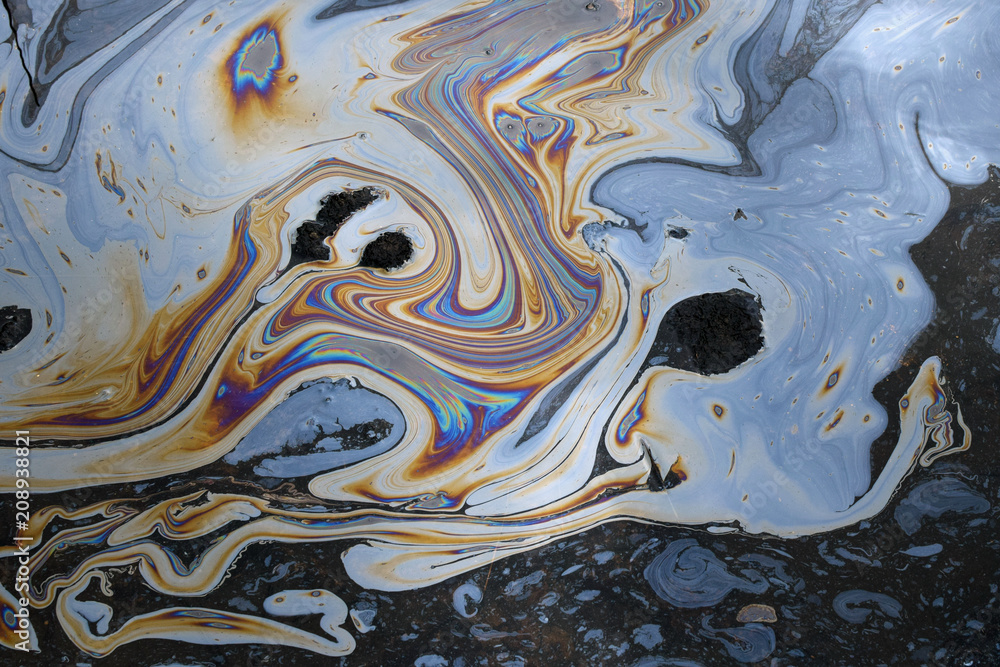
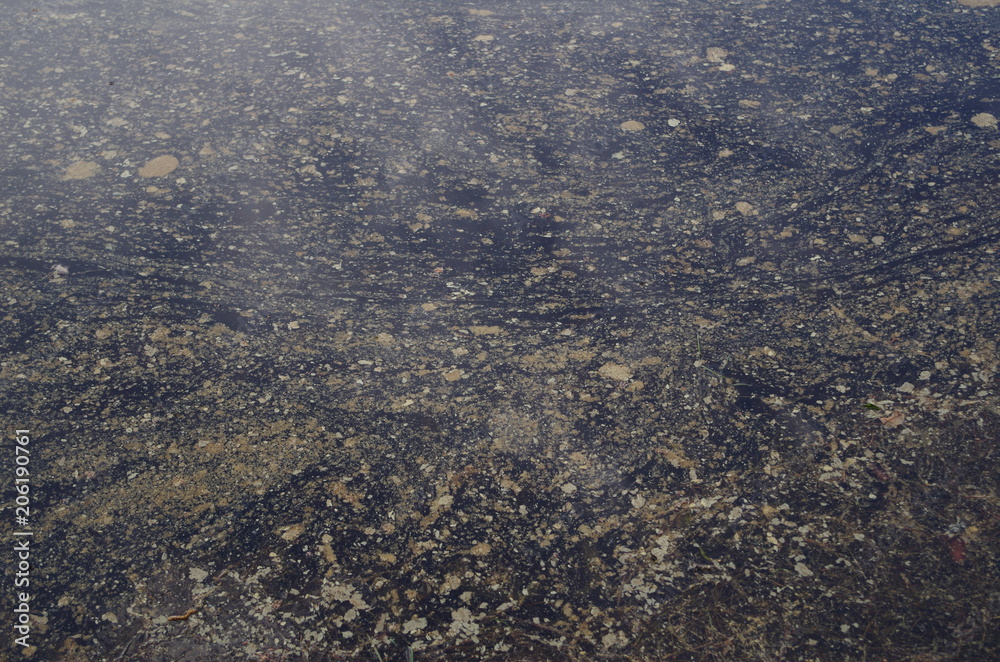
Petroleum-based oil seen on water is not a natural process. Petroleum-based oil could enter water from various sources, such as but not limited to transportation spills, stormwater runoff, and improper disposal of products containing oil. Like the oily substances produced by bacteria during decomposition, petroleum-based oils will float on top of the water and accumulate where there is little to no water movement.
Here are some tips to identify the difference between oils in water:
|
Bacteria-produced Oil |
Petroleum-based Oil |
| Appearance |
Oily sheen on top of water with little to no difference in color throughout |
Oily sheen on top of water with differences in color throughout (may even appear like a rainbow) |
| Touch
(use a stick) |
When disturbed, the sheen breaks away easily with irregular patterns and does not reform. The oil will not adhere to the stick. |
When disturbed, the sheen swirls, elongates, and does reform. The oil may adhere to the stick. |
| Odor
(not always present) |
Strong organic, musty, or earthy smell. |
Volatile organic compounds (VOCs) smelling like gasoline or diesel fuel. |
Another sheen on our waters that is frequent during Florida’s springtime is pollen. Pine, tree, and weed pollen accumulate on top of water, especially in areas with little or no water movement. If the sheen on the water is yellow, orange, or sometimes white, this is most likely due to pollen. Think about how pollen shows on a car in Florida during spring…our waters can show the same to some extent.
Let’s give it a try! See if you can identify the sheens in water in each photo—answers at the bottom of the page.
Photo 1

Photo 2

Photo 3
Photo 4
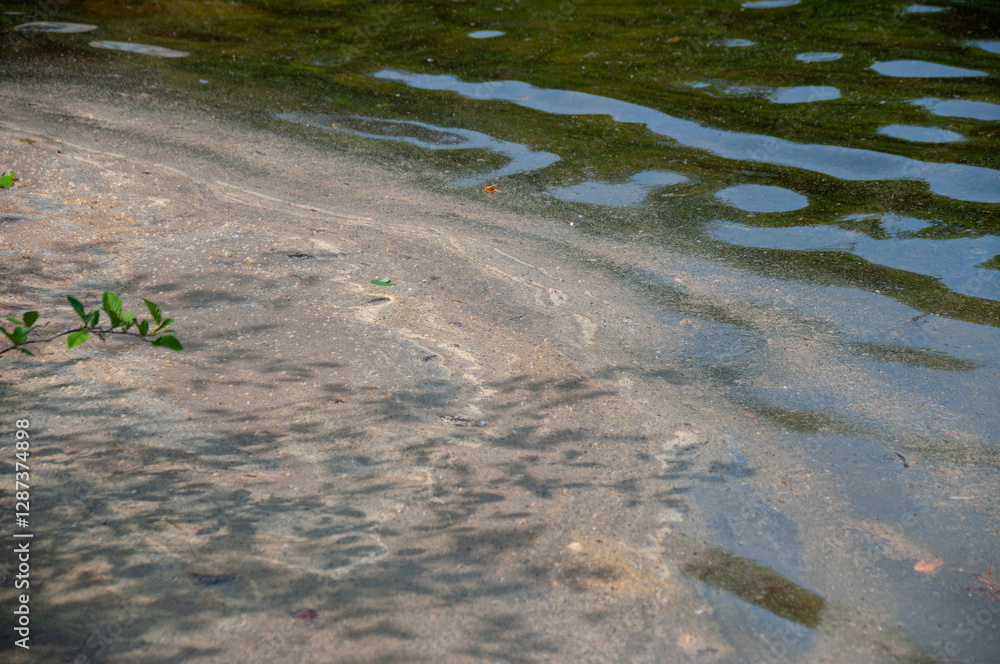
Photo 5

Photo 6
Keep Scrolling For Answers!
.
.
.
.
.
.
PHOTO ANSWERS: Photo 1: Bacteria-produced oil sheen. Photo 2: Pollen sheen. Photo 3: Petroleum-based oil sheen. Photo 4: Pollen sheen. Photo 5: Petroleum-based oil sheen. Photo 6: Mixture of bacteria-produced oil and pollen sheen. Note all photos were obtained from Adobe Stock Photos.
by Dana Stephens | Apr 11, 2025
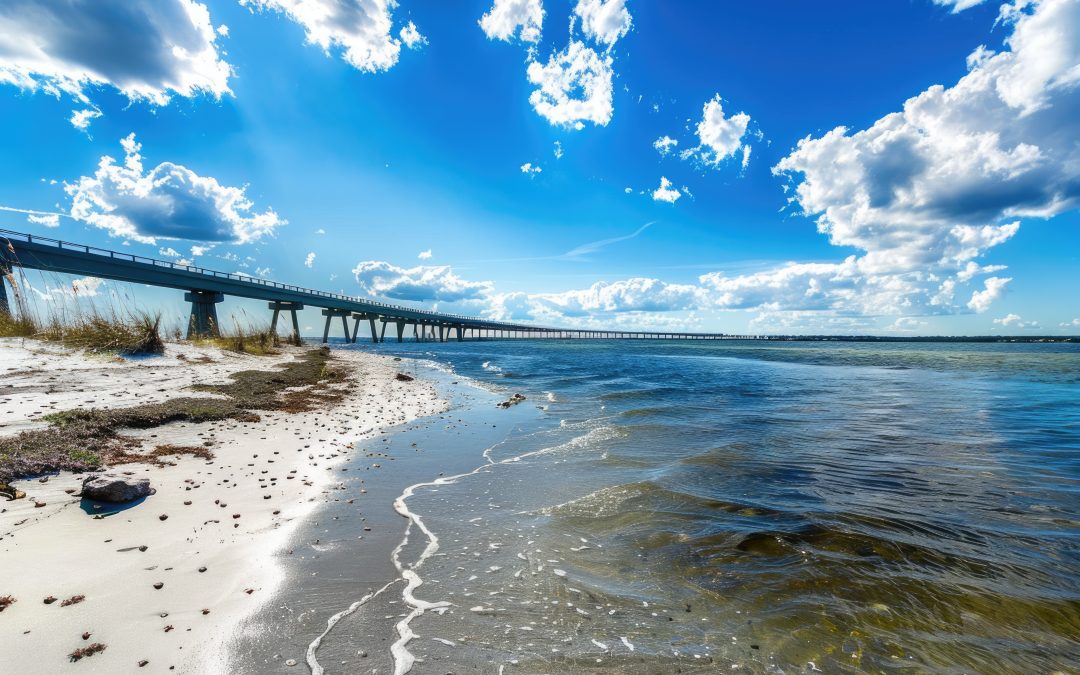
Okaloosa Waterwatch is an opportunity to explore water quality data in selected locations spanning the Okaloosa County portion of the Choctawhatchee Bay.
A site is selected each month, and available water quality data are summarized and explained. The purpose is to understand water quality and the condition of our waters. Thanks to the Choctawhatchee Basin Alliance (CBA), water quality data has been collected frequently (monthly) for many years.
Below are the February and March Okaloosa Waterwatch water quality summaries. February highlights the mid-bay bridge (Niceville) location, and March highlights the entrance to Rocky Bayou (Niceville) location.
Check out the Okalooas Waterwatch YouTube channel for a personalized audio review of the water quality summaries. The YouTube channel is Okaloosa Waterwatch (@OkaloosaWaterwatch) or navigate directly using this link: https://www.youtube.com/channel/UCGPVMsyMiTU5BT9xyrFhuYQ
Please contact Dana Stephens, UF/IFAS Okaloosa County Sea Grant Extension Agent, for more information or to learn more about water quality in Okaloosa County. Email is dlbigham@ufl.edu and office phone is 850-689-5850.
Okaloosa Waterwatch February 2025 (PDF Link)
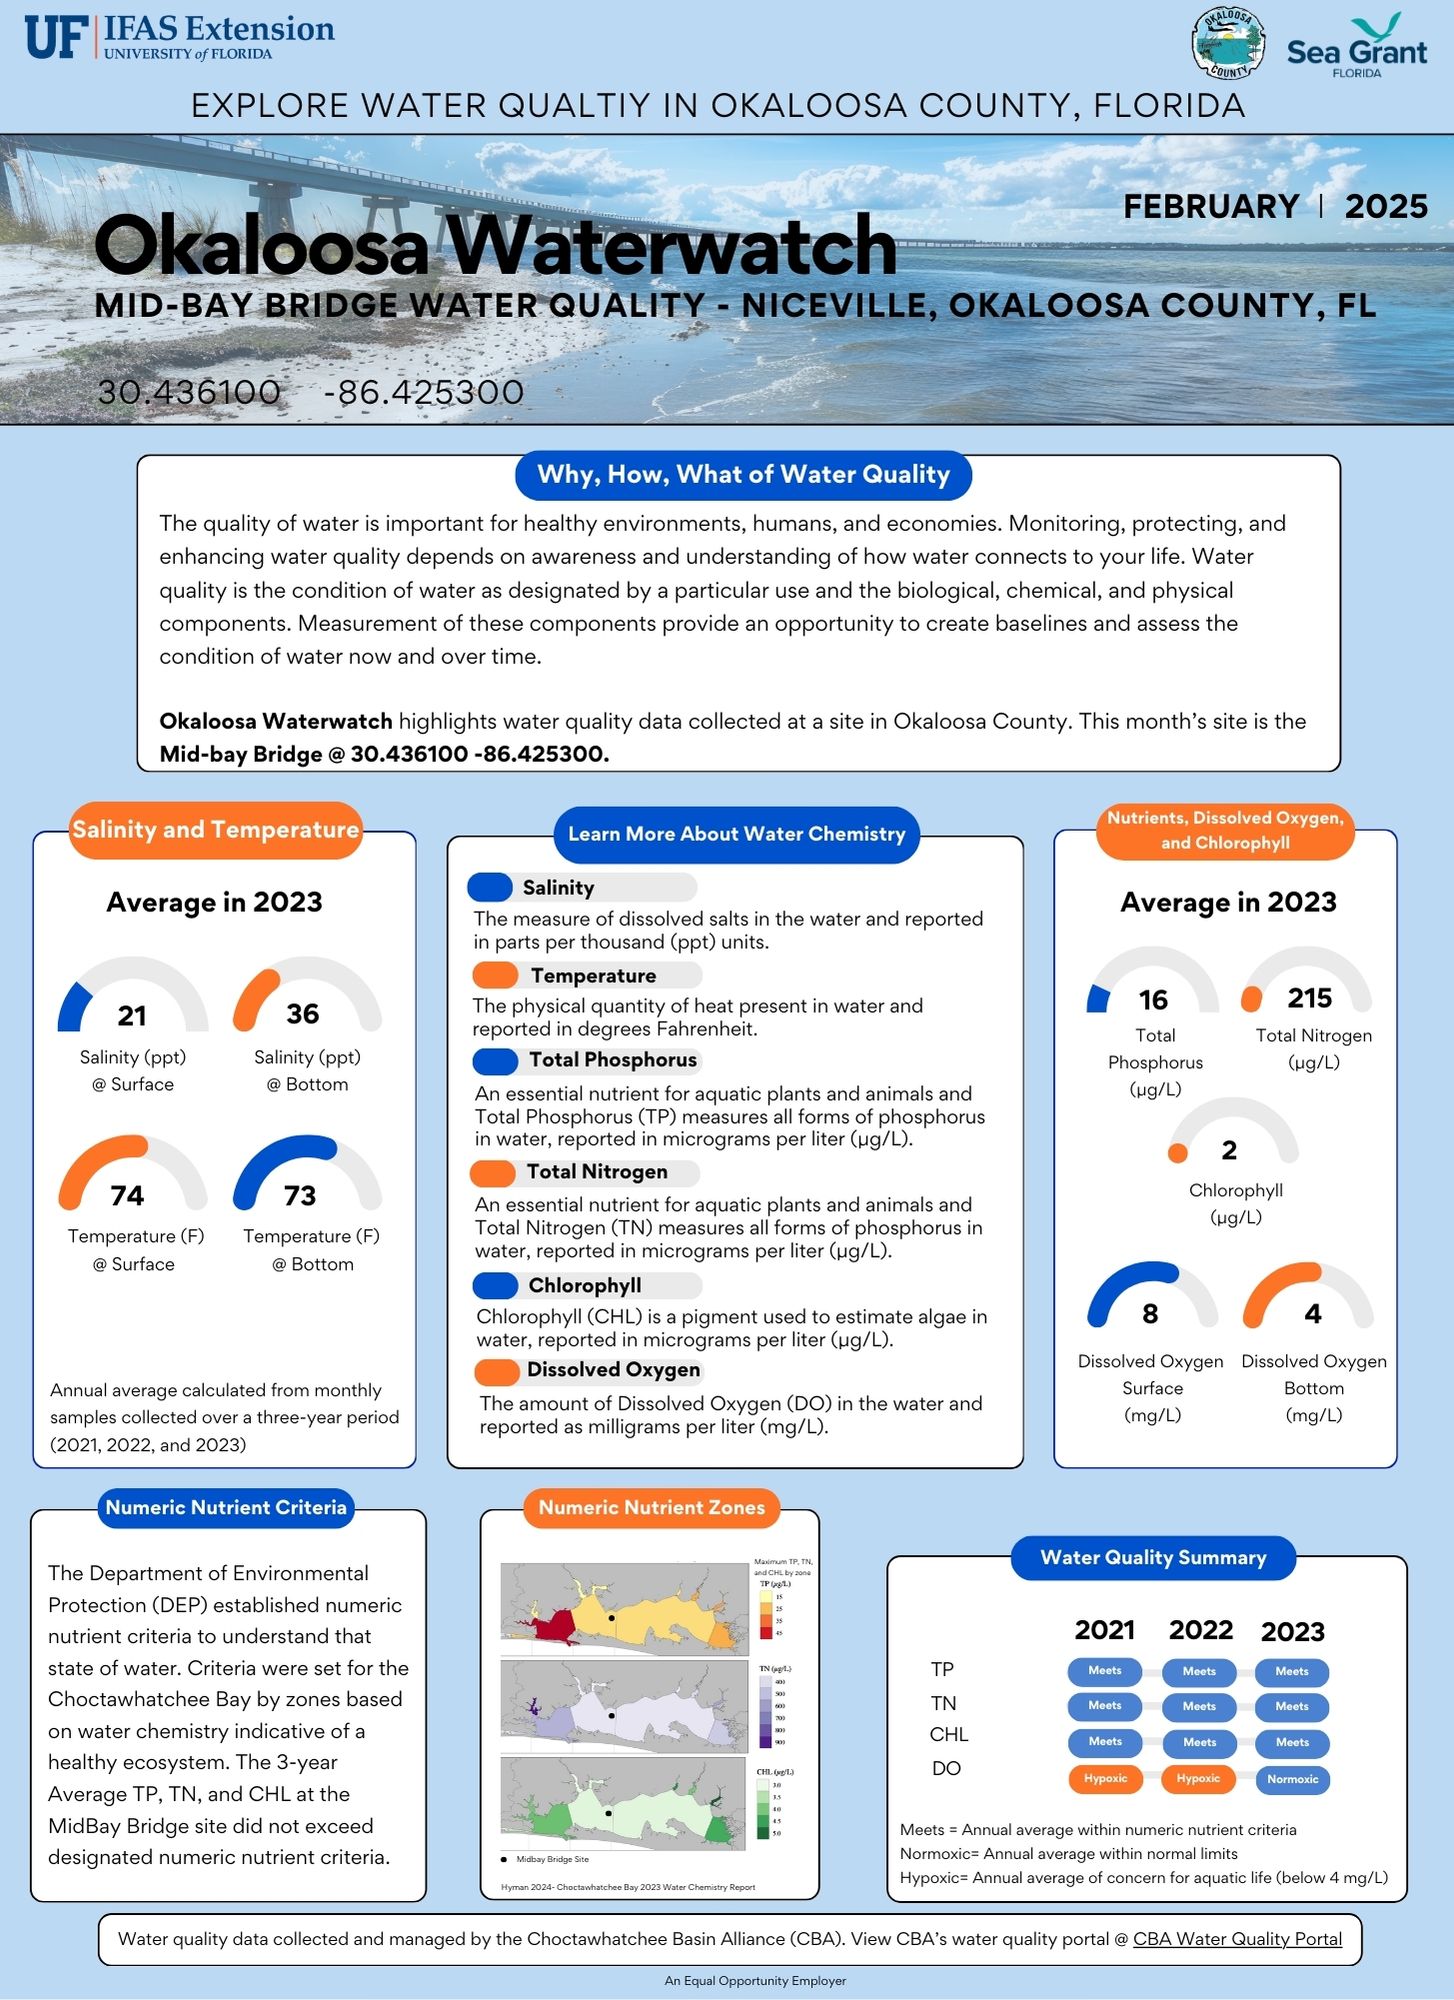
Okaloosa Waterwatch March 2025 (PDF Link)
by Daniel J. Leonard | Dec 20, 2024
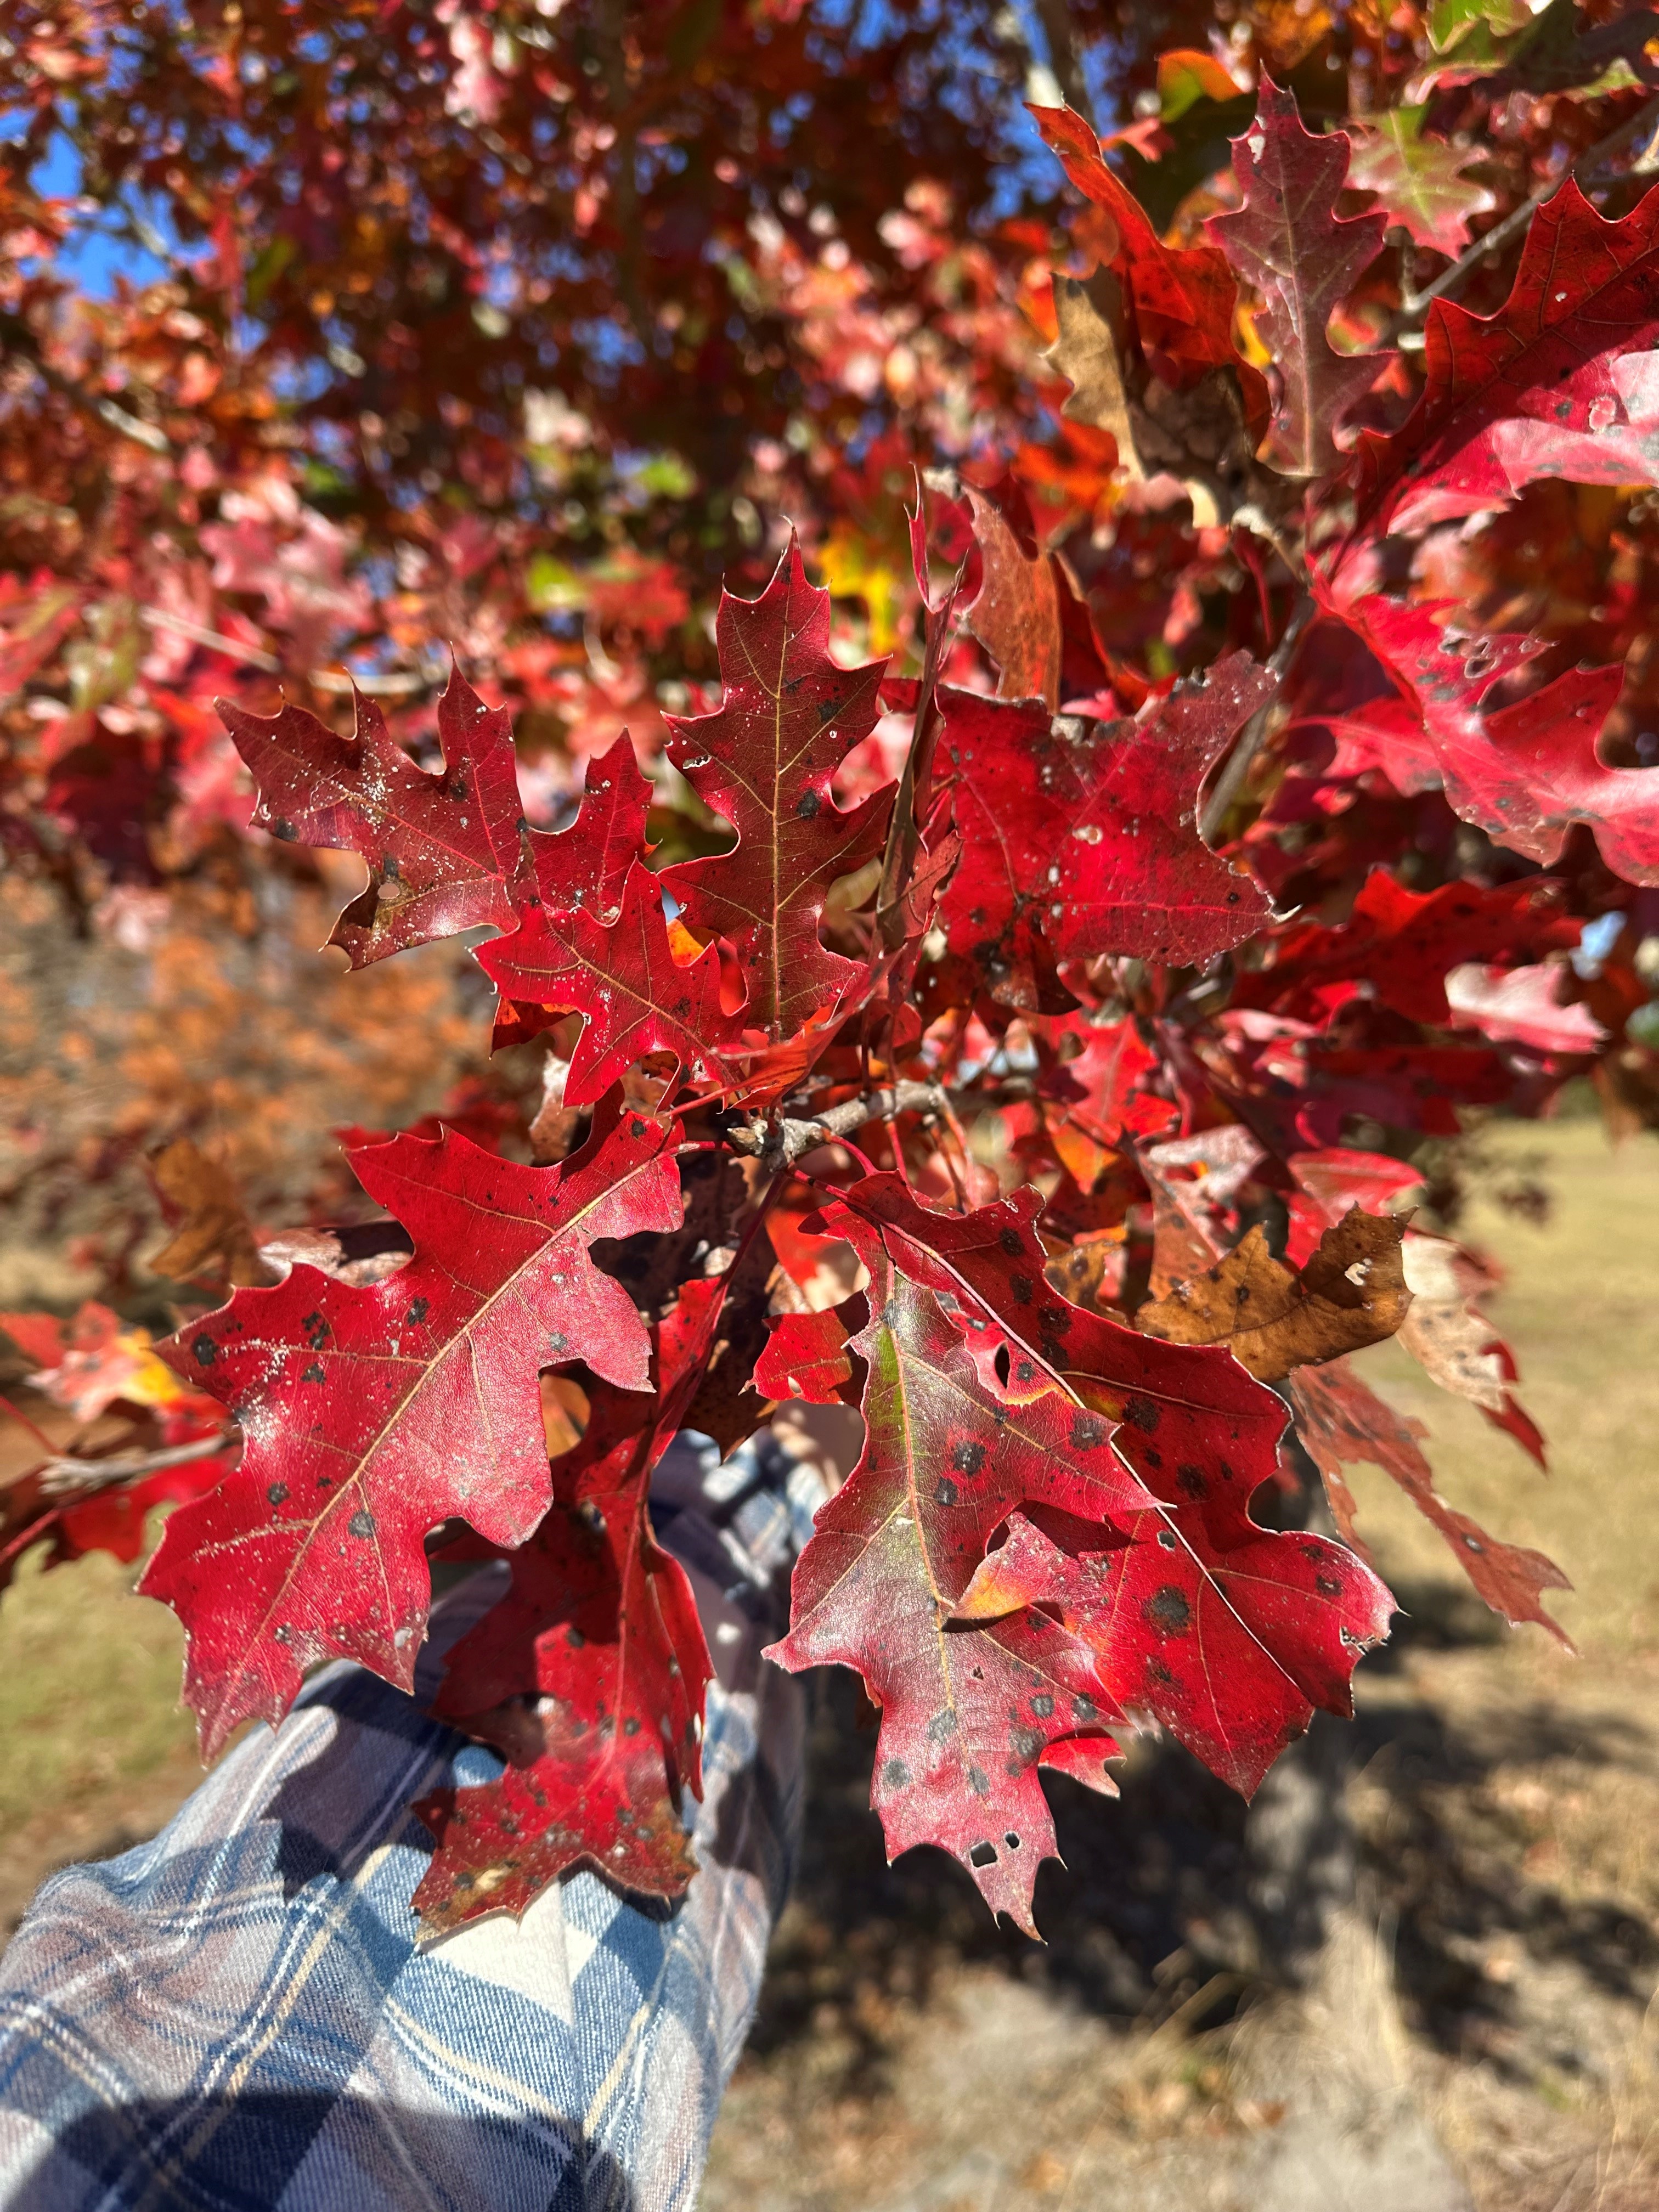
The Panhandle isn’t known for its fall foliage. The best we can normally hope for are splashes of pale yellow amidst a sea of green pine needles, drab brown leaves killed by the first frost, and invasive Chinese Tallow trees taunting us with vibrant colors we know we shouldn’t have. However, in 2024, you’d be forgiven if you forgot you were in Florida and had instead been transported to a more northern clime where leaves everywhere turned brilliant shades of yellow, orange, purple, and red. I’ve heard comments from many folks, and I agree, that this is the best fall color we’ve seen here in a long time – maybe ever. So, why were the leaves so pretty this year? Let’s dive in.
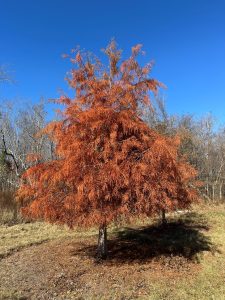
Bald Cypress displaying brilliant burnt orange foliage. Photo courtesy of Daniel Leonard.
What causes leaves to change colors in the fall?
First, what makes leaves of deciduous trees/shrubs (plants that shed their leaves in the winter) change color in the first place? The primary driver of leaf color change is daylength. During the summer, leaves appear green due to the presence of chlorophyll, which reflects green light, absorbs red and blue light, and is responsible for photosynthesis. When days shorten in the fall, plants sense that winter is coming and produce hormones that signal leaves to shut down chlorophyll production. They then initiate construction of a “wall” of cells that seals leaves off from the rest of the plant. When this happens, existing chlorophyll is “used up”, sugars build up in the now sealed off leaves, and other compounds that give leaves color, anthocyanins and carotenoids, take center stage. These compounds allow leaves to exhibit the familiar autumnal hues of yellow, red, orange, purple, and brown. However, plants go through this physiological process of shutting down growth and shedding leaves every year and excellent fall color, like what we experienced this year, doesn’t always result. There has to be more to the fall 2024 story.
Why were leaves so pretty this year?

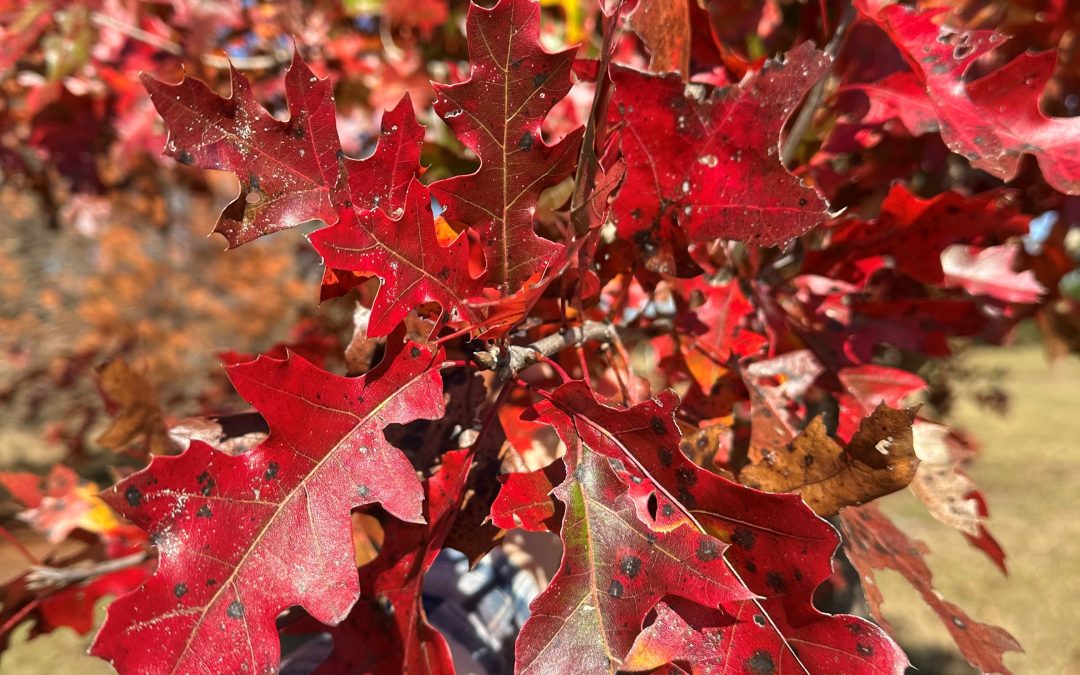
Shumard Oak exhibiting outstanding red fall foliage. Photo courtesy of Daniel Leonard.
A second factor is required for a great fall foliage show – weather. According to the U.S. Forest Service, ideal temperature and moisture conditions must be met for leaf color to be its most intense. Ideal autumn conditions include warm (but not hot) sunny days with cool (but not freezing) nights and adequate (but not excessive) moisture. Too hot and plants become stressed, lessening fall color potential. Too cold, and frost can kill foliage – turning it immediately brown and preventing color development. Too rainy or windy, and leaves can be blown off prematurely. 2024 brought neither extremely hot, extremely cold, or extremely wet conditions, and we were blessed to experience a Goldilocks fall color season.
Did Some Trees Have Better Color than Others?
While pretty much all deciduous trees exhibited their peak color potential this year, there were definitely standouts! Fortunately, many of the prettiest trees this fall also make outstanding landscape trees. Be on the lookout for the following trees in nurseries this winter and consider adding a few to your yard to take advantage of the next Goldilocks fall color year:
- Red Maple (Acer rubrum) – brilliant red fall leaves.
- Florida Maple (Acer floridanum) – yellow/orange.
- Deciduous Oaks (Quercus spp) – generally red to purple. Some species like Sawtooth Oak ( acutissima) are yellow.
- Green Ash (Fraxinus pennsylvanica) – yellow.
- Swamp Tupelo (Nyssa sylvatica) – crimson to purple.
- Sweetgum (Liquidambar styraciflua) – highly variable but generally reds, oranges, and purples.
- Bald Cypress (Taxodium distichum) – burnt orange.
For more information about fall color, which trees and shrubs produce great fall color and perform well in landscapes, or any other horticultural topic, contact your local UF/IFAS County Extension office. Happy Gardening!
by Ray Bodrey | Nov 21, 2024
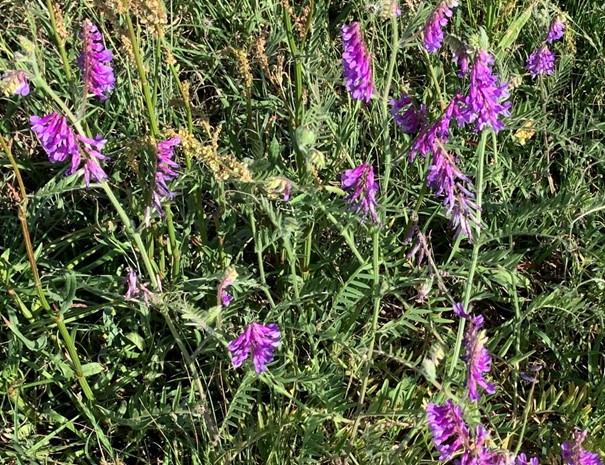
Recently Jennifer Bearden, our Agriculture & Natural Resource Agent in Okaloosa County wrote a great article on “Common Wildlife Food Plot Mistakes”. The following information is a mere supplement in establishing food plots. Planting wildlife forages has become a great interest in the Panhandle. North Florida does have its challenges with sandy soils and seasonal patterns of lengthy drought and heavy rainfall. With that said, varieties developed and adapted for our growing conditions are recommended. Forage blends are greatly suggested to increase longevity and sustainability of crops that will provide nutrition for many different species.
Hairy Vetch – Ray Bodrey
In order to be successful and have productive wildlife plots. It is recommended that you have your plot’s soil tested and apply fertilizer and lime according to soil test recommendations. Being six weeks from optimal planting, there’s no time like the present.
Below are some suggested cool season wildlife forage crops from UF/IFAS Extension. Please see the UF/IFAS EDIS publication, “A Walk on the Wild Side: 2024 Cool-Season Forage Recommendations for Wildlife Food Plots in North Florida” for specific varieties, blends and planting information. https://edis.ifas.ufl.edu/pdffiles/AG/AG13900.pdf
Winter legumes are more productive and dependable in the heavier clay soils of northwest Florida or in sandy soils that are underlain by a clay layer than in deep upland sands or sandy flatwoods. Over seeded white clover and ryegrass can grow successfully on certain flatwoods areas in northeast Florida. Alfalfa, clovers, vetch and winter pea are options of winter legumes.
Cool-season grasses generally include ryegrass and the small grains: wheat, oats, rye, and triticale (a human-made cross of wheat and rye). These grasses provide excellent winter forage and a spring seed crop which wildlife readily utilize
Brassica and forage chicory are annual crops that are highly productive and digestible and can provide forage as quickly as 40 days after seeding, depending on the species. Forage brassica crops such as turnip, swede, rape, kale and radish can be both fall- and spring-seeded. Little is known about the adaptability of forage brassicas to Florida or their acceptability as a food source for wildlife.
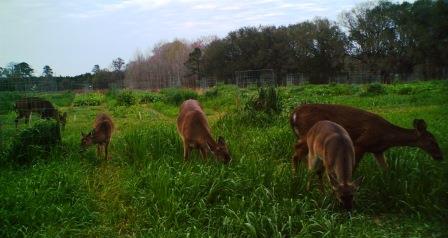
Deer taking advantage of a well maintained food plot. Photo: Mark Mauldin
For more information, contact your local county extension office.
UF/IFAS Extension is an Equal Opportunity Institution.
by Sheila Dunning | Oct 4, 2024
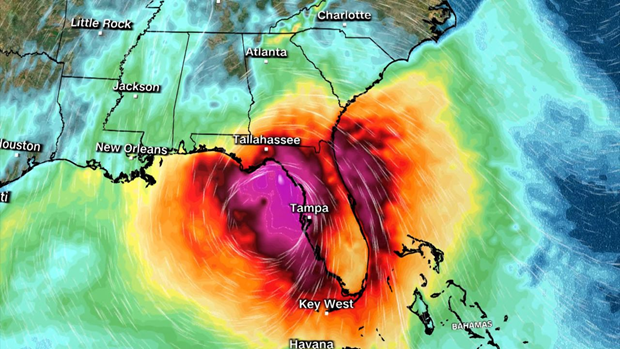
Coastal wetlands are some of the most ecologically productive environments on Earth. They support diverse plant and animal species, provide essential ecosystem services such as stormwater filtration, and act as buffers against storms. As Helene showed the Big Bend area, storm surge is devastating to these delicate ecosystems.
Hurricane Track on Wednesday evening.
As the force of rushing water erodes soil, uproots vegetation, and reshapes the landscape, critical habitats for wildlife, in and out of the water, is lost, sometimes, forever. Saltwater is forced into the freshwater wetlands. Many plants and aquatic animal species are not adapted to high salinity, and will die off. The ecosystem’s species composition can completely change in just a few short hours.
Prolonged storm surge can overwhelm even the very salt tolerant species. While wetlands are naturally adept at absorbing excess water, the salinity concentration change can lead to complete changes in soil chemistry, sediment build-up, and water oxygen levels. The biodiversity of plant and animal species will change in favor of marine species, versus freshwater species.
Coastal communities impacted by a hurricane change the view of the landscape for months, or even, years. Construction can replace many of the structures lost. Rebuilding wetlands can take hundreds of years. In the meantime, these developments remain even more vulnerable to the effects of the next storm. Apalachicola and Cedar Key are examples of the impacts of storm surge on coastal wetlands. Helene will do even more damage.
Many of the coastal cities in the Big Bend have been implementing mitigation strategies to reduce the damage. Extension agents throughout the area have utilized integrated approaches that combine natural and engineered solutions. Green Stormwater Infrastructure techniques and Living Shorelines are just two approaches being taken.
So, as we all wish them a speedy recovery, take some time to educate yourself on what could be done in all of our Panhandle coastal communities to protect our fragile wetland ecosystems. For more information go to:
https://ffl.ifas.ufl.edu/media/fflifasufledu/docs/gsi-documents/GSI-Maintenance-Manual.pdf
https://blogs.ifas.ufl.edu/news/2023/11/29/cedar-key-living-shorelines/