For many who grew up in the Pensacola area October meant flounder gigging season. This once popular past time involved going out at night along the shores of Santa Rosa Sound with flounder lights and gigs seeking a local favorite flounder. Everyone has their favorite recipe for this fish but in this article, we are going to focus on the fish – maybe something you did not know about it.
In the northern Gulf of Mexico, flounder are flatfish with the two eyes on the left side of the head. Locally, flatfish with eyes on the right side are called soles. We do have native soles, but all species are too small to be a food option. If you are not familiar with the “two eyes on one side of the head” idea, yes – flounder hatch from the egg looking like a normal fish, an eye on each side of the head. But earlier in development one eye slides across to the other side. This is a weird transformation and there are probably videos online, so you see how this happens – check them out. The reason for this transformation is to improve depth perception. Eyes close together give the animal binocular vision. Binocular vision does not have a wide viewing range, can basically see what is in front of it but not so much what is behind it, but it does give the animal good depth perception, it can tell how far away the prey actually is, and this is important when hunting.
Once the eyes have shifted to the left side of the head, flounders lose the pigments on the side without eyes, which becomes white, and the fish lays on its side – white side down. The cells on the “eye side” have chromatophores that allow the fish to change color to match the sand on the bottom. Another important feature of being a successful hunter. Most of know they will bury themselves in this sand as well. With their binocular vision, camouflaged body, and sharp teeth, they lie in wait to ambush predators.
You may also be surprised at how many different kinds of flounder are found in the northern Gulf of Mexico. There are 21 species listed, and they range in size from the small Spiny Flounder which can reach an average length of 3 inches, to the Southern Flounder which attains a length of 3 feet. The Gulf flounder and Southern flounder are two species that are popular seafood targets, but any decent sized flounder will do.
Flounder are found in a variety of habitats ranging from shallow seagrass beds nearshore, near structure just offshore, to artificial reefs and the base of bridges, to depths of 1200 feet in the Gulf of Mexico. Many species spend the warmer months in the estuaries moving offshore when the weather cools down to spawn. Hard northerners can trigger a mass migration and a great time for commercial and recreational fishermen alike.
It is flounder season. Whether you prefer to catch your own or buy from the local seafood market I think will enjoy one of the variety of ways to prepare this fish.
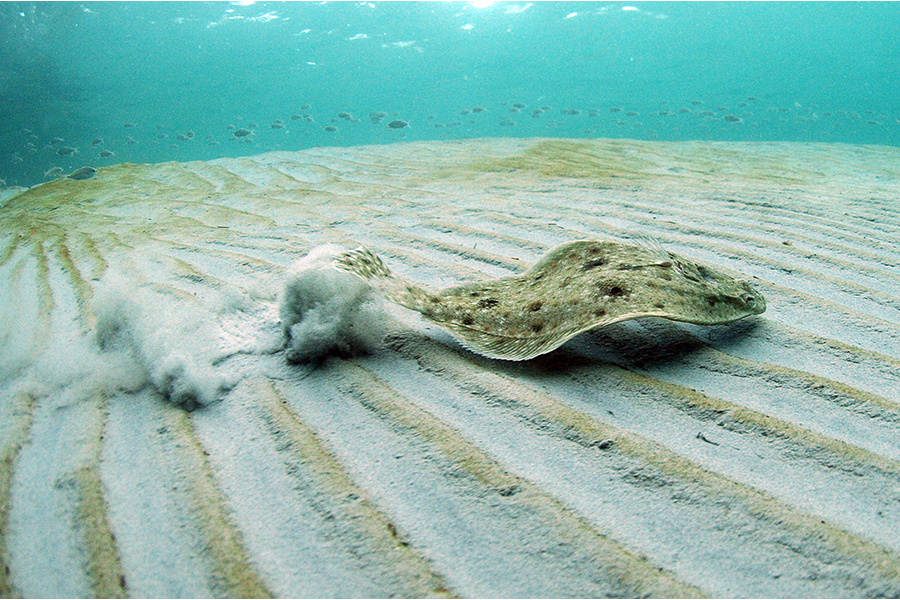
A flounder scurrying across the seafoor.
Photo: NOAA
Bay scallops (Argopecten irradians) have been an important part of the economy of many gulf coast communities within the Florida Big Bend for decades. It was once abundant in all gulf coast counties of the state but beginning in the 1960s populations in many bays began to decline to levels where they are all but nonexistent. The cause of this decline has been associated with many factors including a decline in water quality, a decline in suitable habitat (sea turtle grass beds – Thalassia), and overharvesting. Most likely the cause included all of these. Since the collapse of both the commercial and recreational fishery, Gulf coast communities have been trying to address all three of the stressors above. Multiple monitoring projects are ongoing in the Pensacola Bay area and one of those is the Great Scallop Search.
The Great Scallop Search was developed by Sea Grant Agents in Southwest Florida and expanded, through Florida Sea Grant, to Northwest Florida. In each location volunteers snorkel a 50-meter transect line searching for live bay scallops, as well as monitoring the status of the seagrass habitat. Since 2015 317 volunteers have logged 634 hours surveying 407 50-meter transects in 106 grids in Big Lagoon or Santa Rosa Sound. In that time 4 live scallops have been logged, though we hear anecdotal reports of additional scallops being found in these bodies of water.
Survey Method
Volunteers select and survey one of 11 grids in Big Lagoon, or one of 55 grids in Santa Rosa Sound. Once on site, the volunteers anchor and record preliminary information on the data sheet provided. Two snorkelers enter the water and swim on opposite sides of a 50-meter transect line searching for live scallops. Any live scallop found is measured and returned. The species and density of the seagrass is recorded as well as the presence/absence of macroalgae on that seagrass. Four such transects are surveyed in each grid.
2023 Results
2023
SRS
BL
Total
Other
# of volunteers
72
No significant difference between 2022 and 2023
# of grids surveyed
8
8
16
Slight decrease from 2022. 16 of the 66 grids (24%) were surveyed.
# of transects surveyed
26
51
77
A decrease from 2022. More surveys were conducted in Big Lagoon than Santa Rosa Sound.
Area surveyed (m2)
2600
5100
7700
1.9 acres
# of scallop found
2
2
4
Four live scallops are a record for this project. It equals the sum of all other live scallops since the project began.
Scallop Size (cm)
4.5, 5.0
4.0, 4.5
Surveys with Seagrass
Halodule
5
12
17
17/21 surveys – 81%
Thalassia
8
11
19
19/21 surveys – 90%
Syringodium
0
2
2
2/21 surveys – 10%
Grass Density
100% grass
3
9
12
12/21 surveys (57%) were 100% grass
90%
1
0
1
Note: Volunteers typically select area for transects
75%
3
1
4
with a lot of grass.
70%
1
0
1
50%
3
9
12
5%
1
0
1
Macroalgae
Present
4
4
8
Absent
2
10
12
12/21 surveys (57%) had no macroalgae.
Abundant
2
2
4
Sediment Type
Mud
0
1
1
Sand
7
8
15
15/21 surveys (71%) were sandy.
Mixed
1
4
5
21 surveys were conducted covering 16 grids. 8 grids were surveyed in each body of water.
A total of 77 transects were conducted covering 7,700 m2 and four live scallops were found.
Two of the scallops were found in Big Lagoon and two in Santa Rosa Sound.
All scallops measured between 4-5cm (1.6-2”).
The number of live scallops found this year equaled the total number found over the last eight years.
Most of the transects included a mix of Halodule and Thalassia seagrass ranging from 100% coverage to 5%. The majority of the transects were between 50-100% grass. Four transects had 100% Thalassia. Three of those were in Santa Rosa Sound, one was in Big Lagoon. The diving depth of the volunteers ranged from 0 meters (0 feet) to 2.4 meters (8 feet). Macroalgae was present in 8 of the 21 surveys (38%) but was not abundant in most.
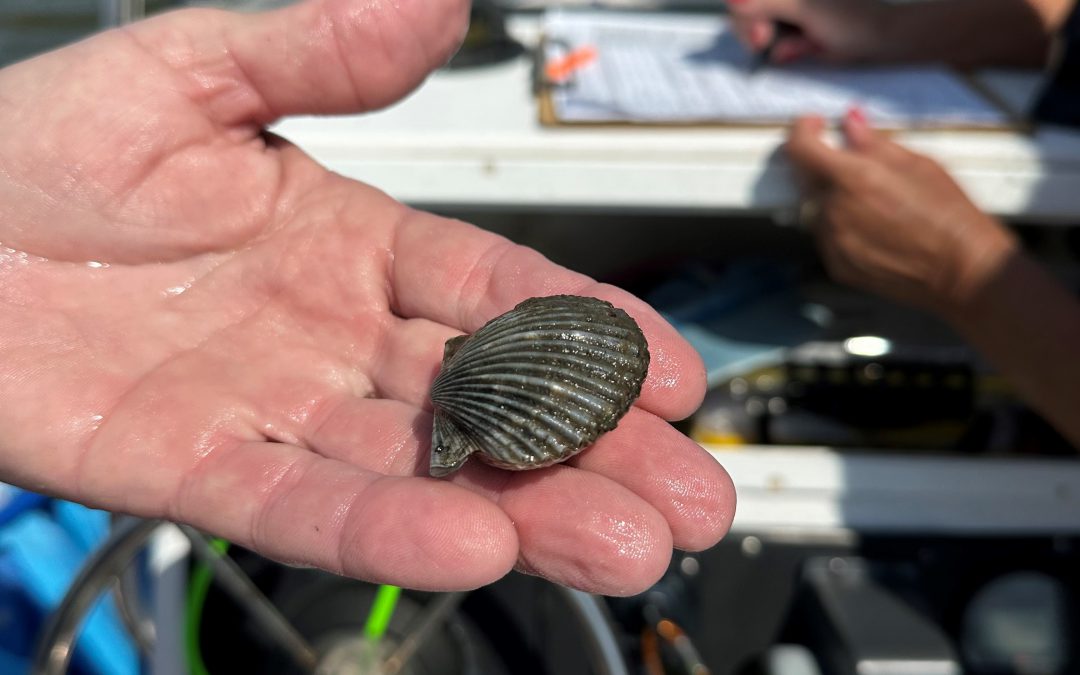
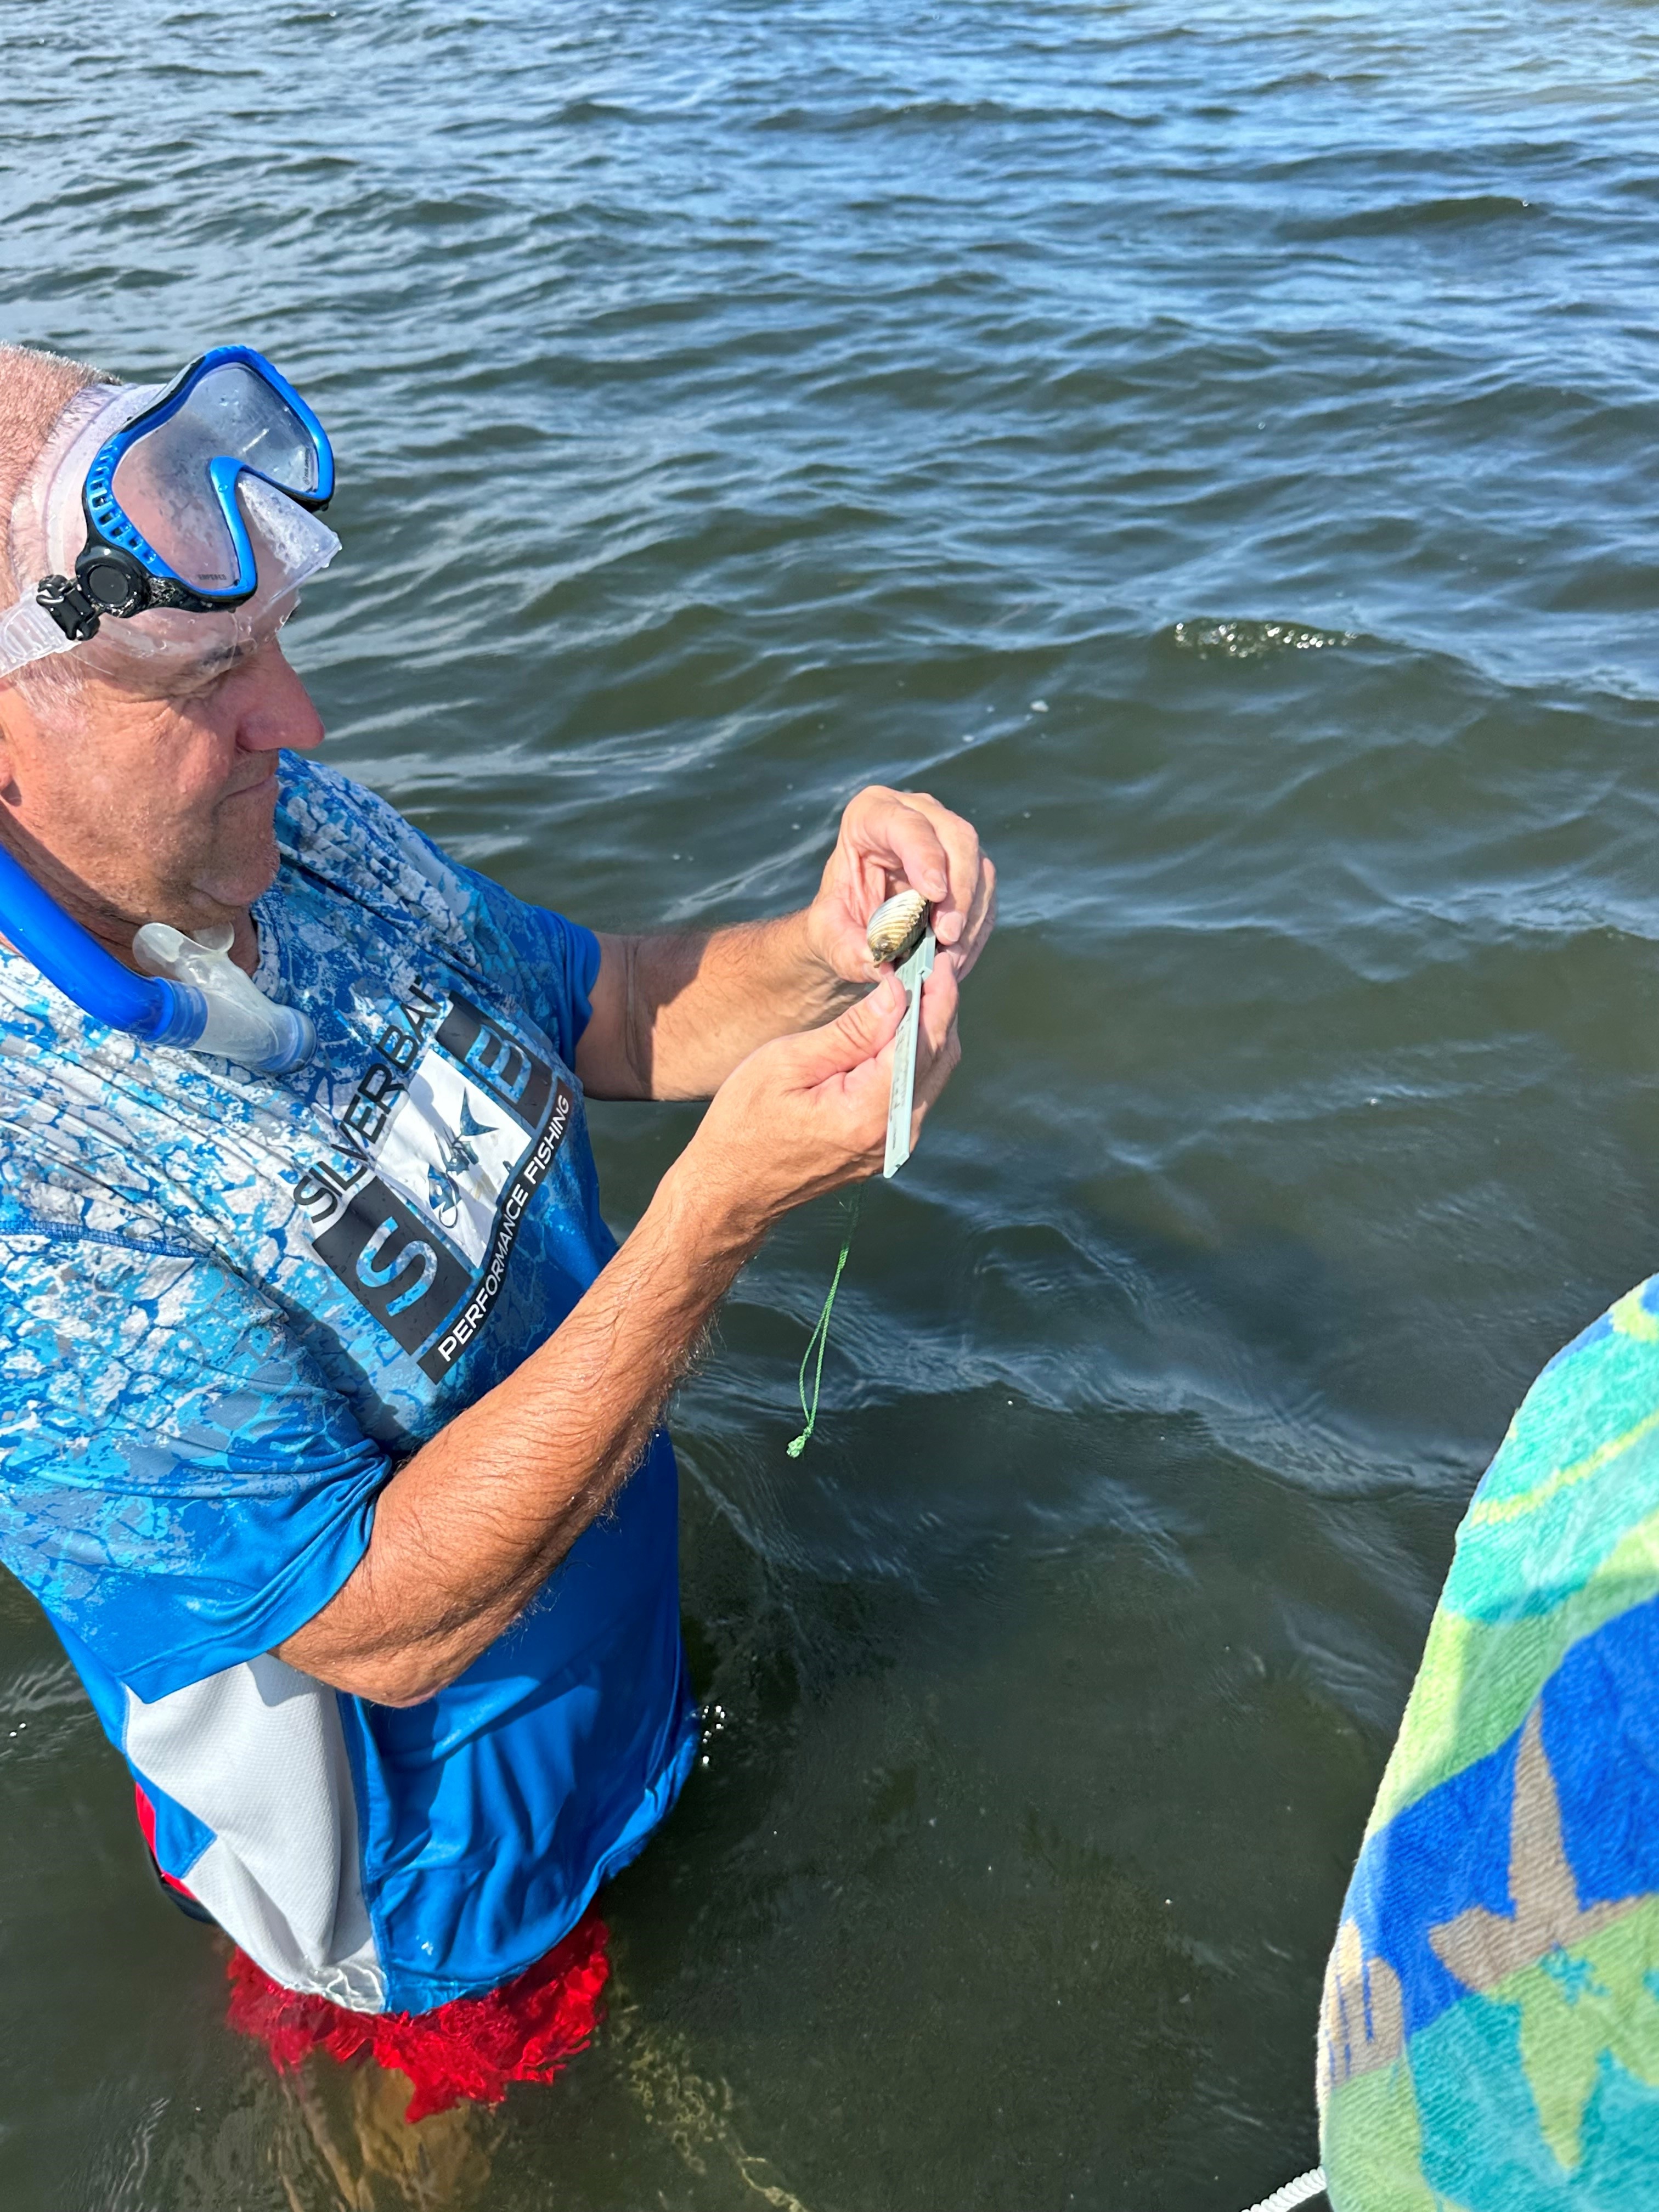
Volunteer measuring one of the four collected bay scallops in 2023 from Pensacola Bay.
Photo: Gina Hertz.
Summary of Project
Year
Volunteer
Grids Surveyed
Transects Surveyed
Live Scallops Found
2015
87
28
101
0
2016
96
31
111
1
2017
5
4
16
0
2018
20
7
32
0
2019
13
6
20
0
2020
5
2
16
1
2021
17
6
24
0
2022
74
22
87
2
2023
72
16
77
4
TOTAL
317
407
8
MEAN
35
14
45
0.4
To date we are averaging 35 volunteers each event, surveying 14 of the 55 possible grids (25%). We are averaging 45 transects each year (4500 m2), have logged 407 transects (40,700 m2) and have recorded 8 live scallops (< than one a year).
Discussion
Based on the results since 2016 this year was a record year for live scallops. Whether they are coming back on their own is still to be seen. Being mass spawners, bay scallop need high densities in order to reproduce successfully, and these numbers do not support that. The data, and comments from volunteers, suggest that the grasses look good and dense. Thalassia, a favorite of the bay scallop, appear to be becoming more abundant. This is a good sign.
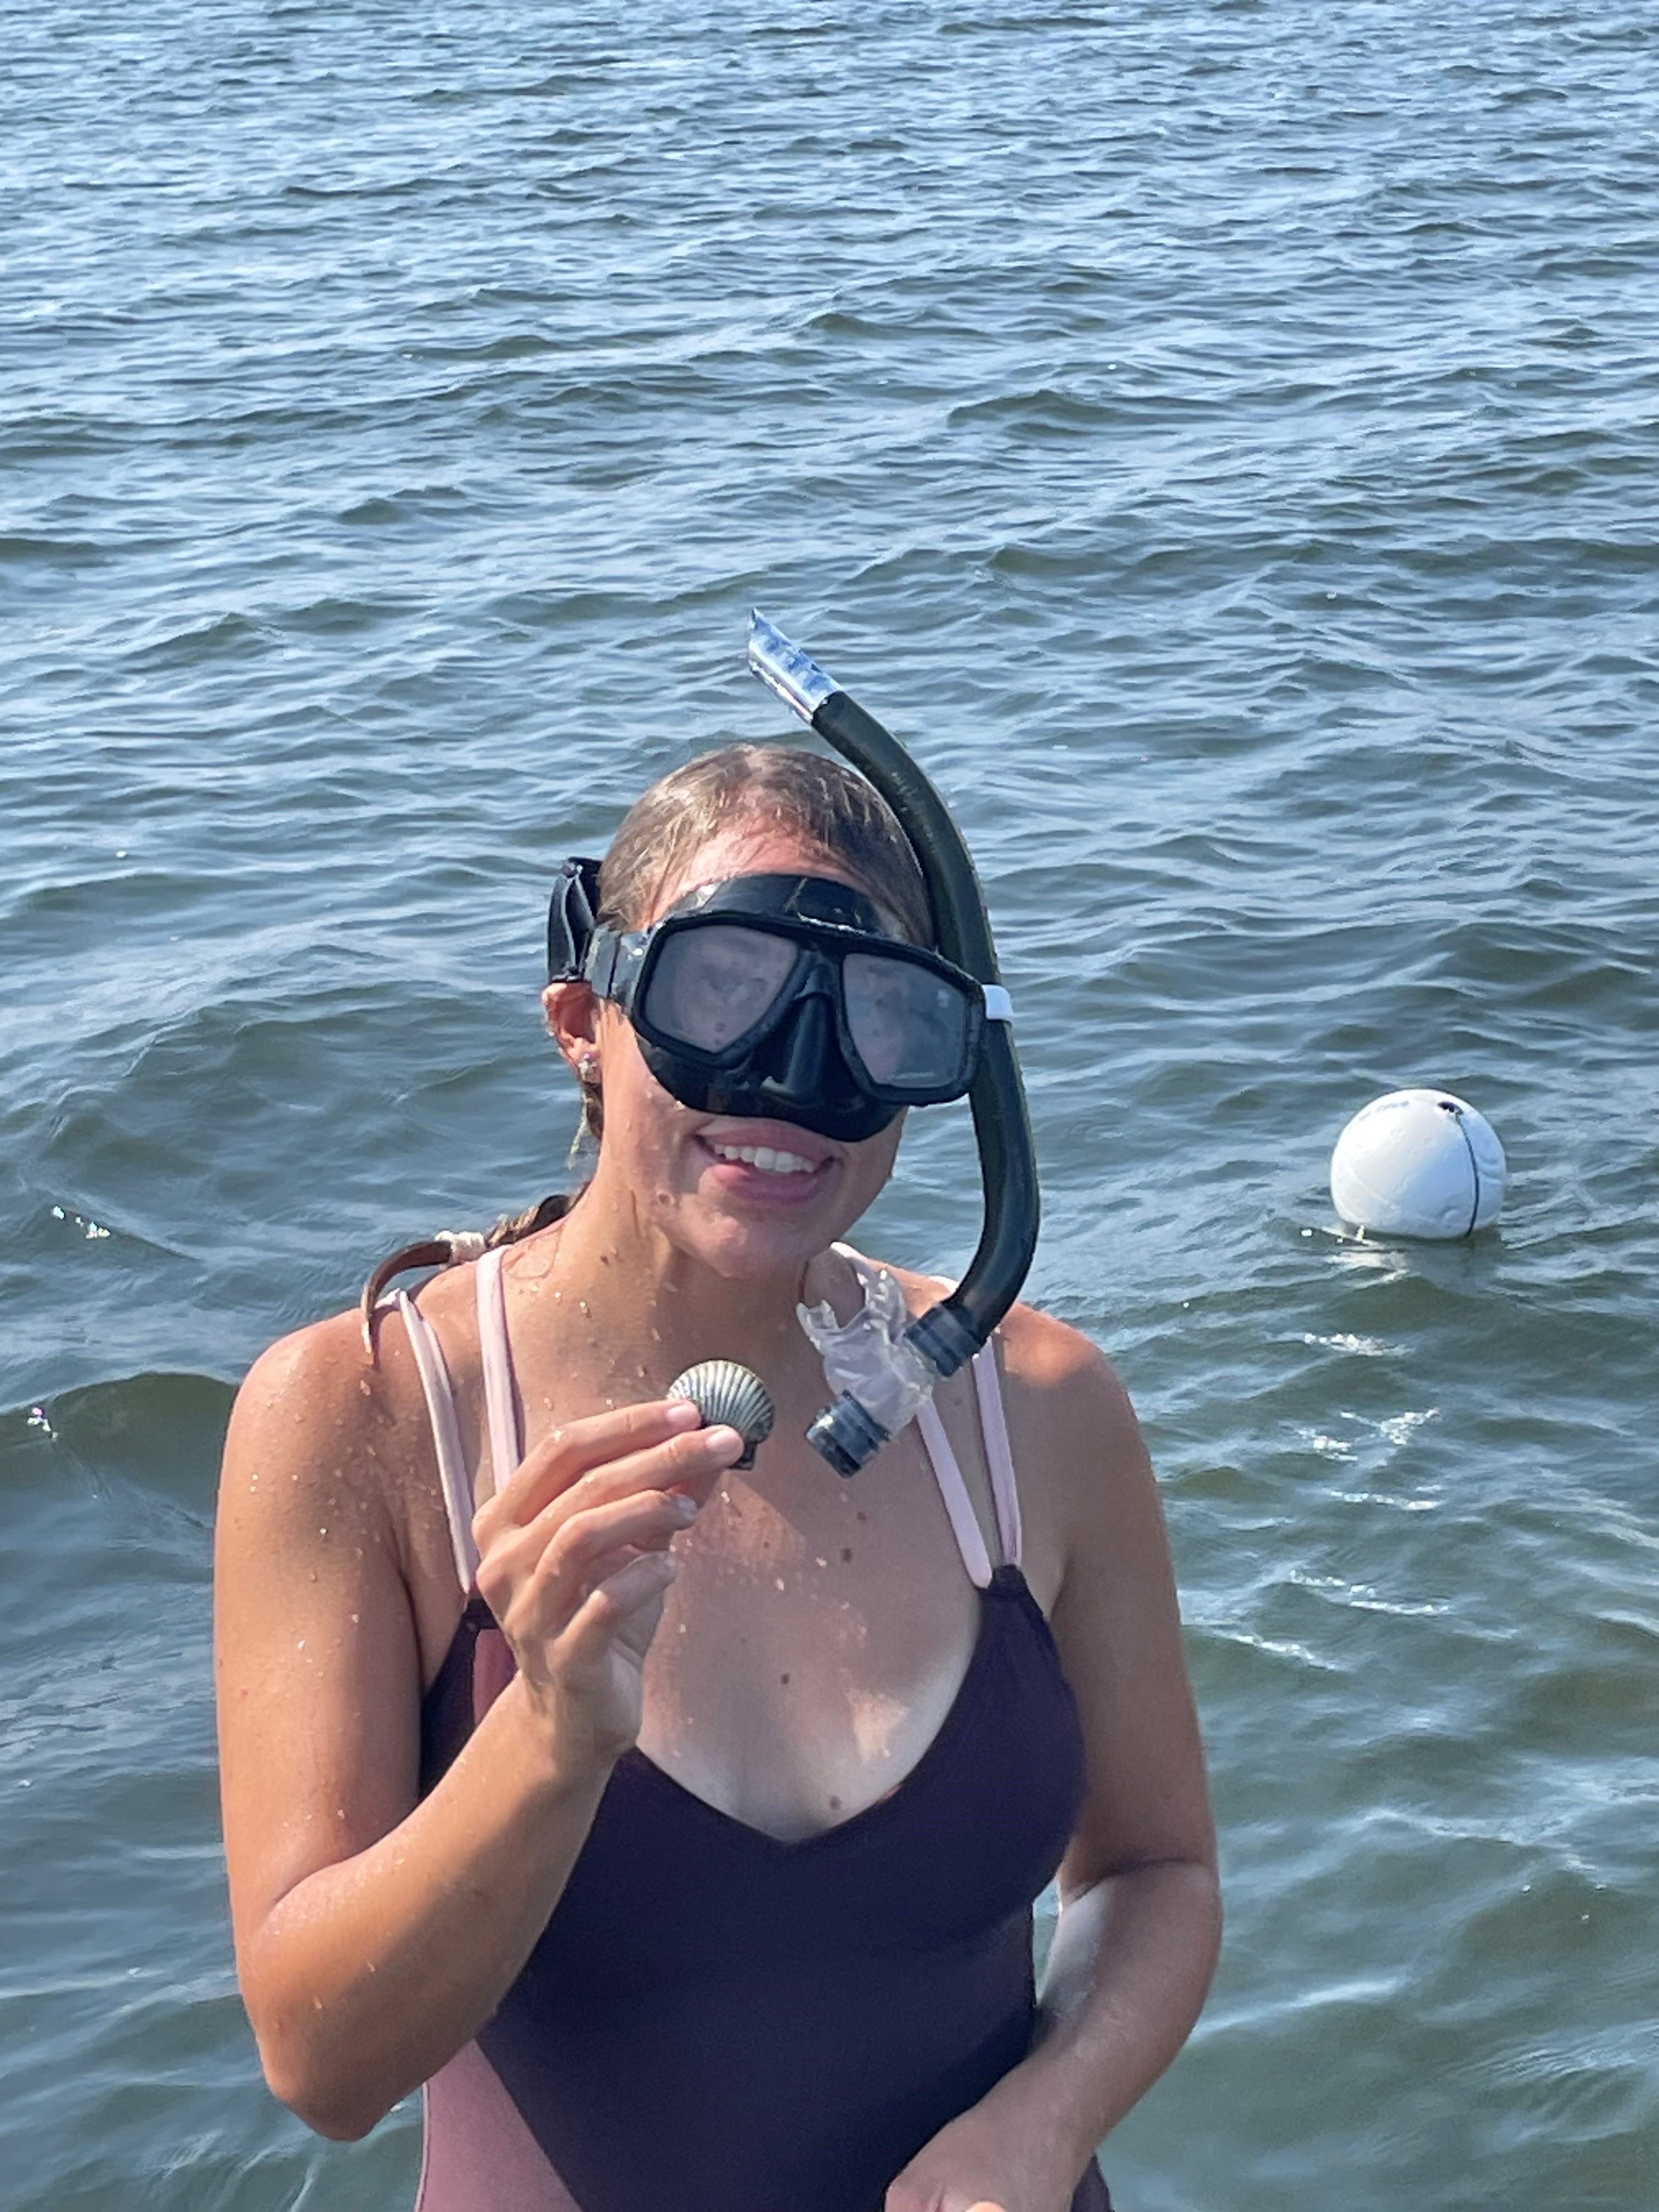
Though small and few, bay scallops are trying to hold on in Pensacola Bay.
Photo: Gina Hertz
It’s a national program where volunteers gather at a public space to help remove invasive weeds. In many cases they target one specific species. This year in Escambia County we plan to target beach vitex on Pensacola Beach. If there is not an event in your community, you can still participate by removing invasive weeds from your own private property. Here is how…
Target one specific species. Maybe Chinese tallow, Japanese climbing fern, or other possible invasive weeds in your community. If you are not sure which weeds are invasive, check with your local county extension office.
Read how to best manage. Each species may use different methods and herbicides to treat. Maybe you do not want to use herbicides, not a problem, by visiting the website of the University of Florida’s Center for Aquatic and Invasive Plants, you can find fact sheets that will give you not only the different herbicides that can be effective, but other non-herbicide management ideas.
Decide what you are going to do with the weeds afterwards. Fragments and seeds from these weeds can generate new populations. You make sure you dispose of the plant properly to not create a bigger problem.
Pick a nice day, collect all your supplies, and do it.
Let us know! Contact me (Rick O’Connor roc1@ufl.edu) and let us know which species you removed and how much.
If you are in Escambia County and want to participate in our event this year, we will be removing beach vitex from public areas on Pensacola Beach. You will need gloves, loppers or clippers, and a 5-gallon bucket. Here is our schedule…
Oct 4 12:00pm Quietwater Boardwalk. Meet at the seashell.
Oct 12 12:00pm The Bike Path near the Sugar Bowl. Meet at parking lot 27A (Allen Levin Way).
Oct 18 12:00pm The sewer lift station on Via DeLuna just west of the west entrance into
Sugar Bowl.
Oct 25 12:00pm Bike Path near Portofino. Meet at parking lot 27B.
If you plan to come to one of these, let me know! Rick O’Connor at roc1@ufl.edu.
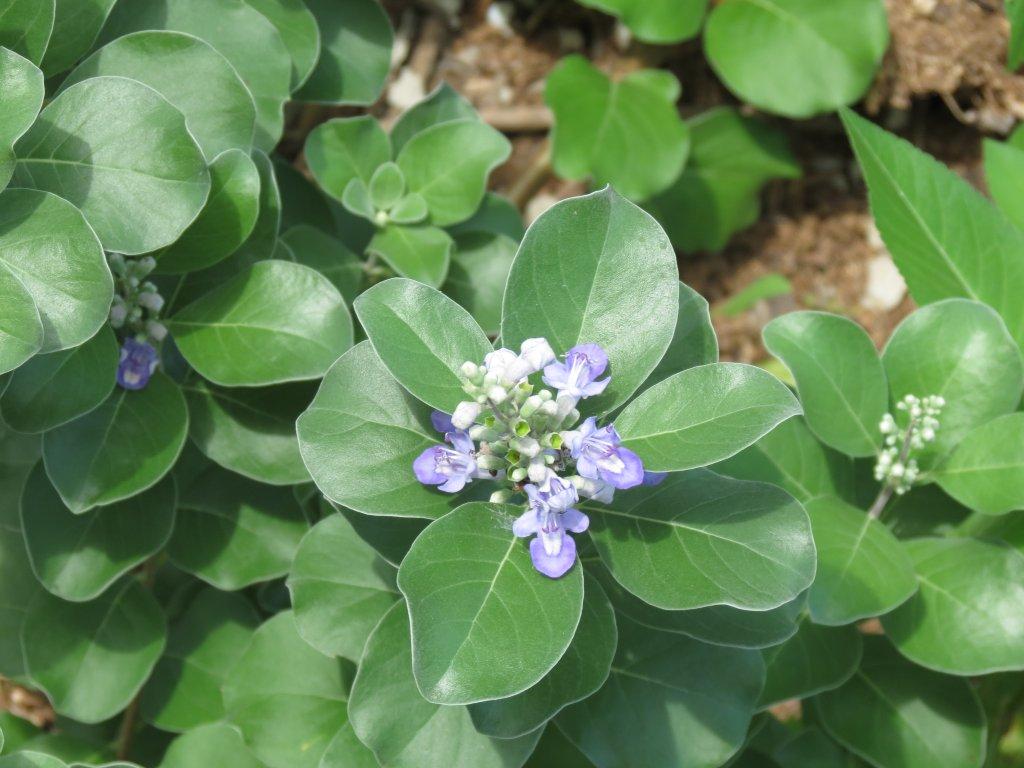
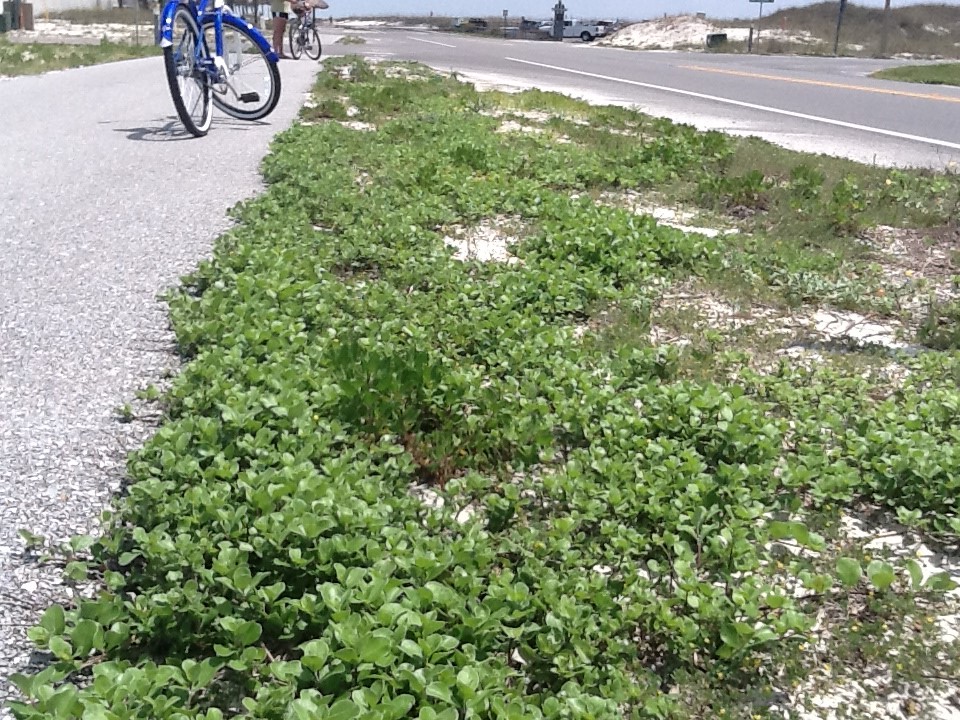
Vitex beginning to take over bike path on Pensacola Beach. Photo credit: Rick O’Connor
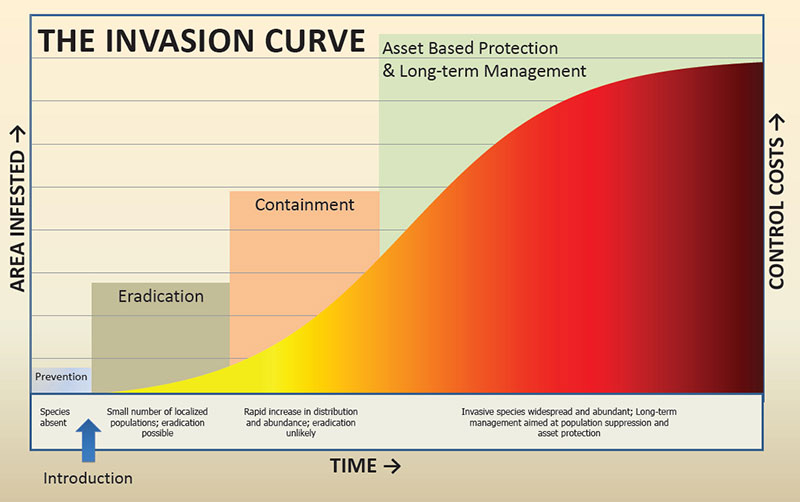
Miami is ground zero for invasive species in this state. But the Florida panhandle is no stranger to them. Where they are dealing with Burmese pythons, melaleuca, and who knows how many different species of lizards – we deal with Chinese tallow, Japanese climbing fern, and lionfish. The state spends hundreds of thousands of dollars each year battling and managing these non-native problem species. By definition, invasive species cause environmental and/or economic problems, and those problems will only get worse if we do not spend the money to manage them. Those who work in invasive science and resource management know that the most effective way to manage these species is to detect them early and respond rapidly.
The Invasive Species Curve
Invasive species have made their way to the coastal waters and dunes of the barrier islands in the Florida panhandle. Beach vitex, Brown anoles, and Chinese tallow are found on most. Recently on Perdido Key near Pensacola, we found a new one – cogongrass.
Cogongrass (Imperata cylindrica) was accidentally introduced to the Gulf coast via crates of satsumas entering the port of Mobile in 1912. It began to spread from there and has covered much of the upland areas of the southeastern U.S. It has created large problems within pasture lands, where livestock will not graze on it, and in pine forest where it has decreased plant and animal biodiversity as well as made prescribed burning a problem – it burns hot, hot enough to actually kill the trees. The impacts and management of this plant in that part of the panhandle has been known for a long time. The Department of Agriculture lists it as one of the most invasive and noxious weeds in the country.
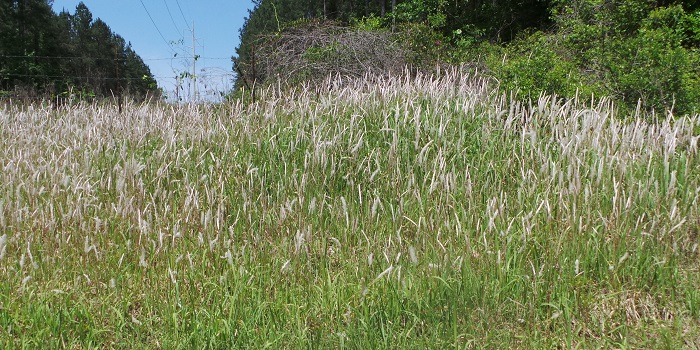
Cogongrass seedheads are easily spotted in spring.
Photo credit: Mark Mauldin
Two years ago cogongrass was discovered growing around a swimming pool area at a condo on Perdido Key. To be considered an invasive species you must (a) be non-native to the area – cogongrass is certainly non-native to our barrier islands, (b) have been introduced by humans (accidentally or intentionally) – strike two, we THINK it was introduced by mowers. This is a common method of spreading cogongrass, mowing an area where it exists, then moving those mowers to new locations without cleaning the equipment. We do not know this is how it got to the island, but the probability is high. Third, it has to be causing an environmental and/or economic problem. It certainly is north of the I-10, but it is not known what issue it may cause on our barrier islands. Could it negatively impact protected beach mice and nesting sea turtle habitat? Could alter the integrity of dunes to reduce their ability to hold sand and protect properties. Could it overtake dune plants lowering both plant and animal diversity thus altering the ecology of the barrier island itself? We do not know. What we do know is that if we want to eradicate it, we need to detect it early and respond rapidly.
According to EDDMapS.org – there are 75 records of cogongrass on the barrier islands, and coastal beaches of the Florida panhandle. This is most likely under reported. So, step one would be to conduct surveys along your islands and beaches. Florida Sea Grant and Escambia County of Marine Resources are doing just that. EDDMaps reports five records on Perdido Key and four at Ft. Pickens. It most likely there is more. A survey of the northeast area of Pensacola Beach (from Casino Beach east and north of Via De Luna Drive) has found two verified records and two unverified (they are on private property, and we cannot approach to verify). Surveys of both islands continue.
The best time to remove/treat cogongrass is in the fall. The key to controlling this plant is destroying the extensive rhizome system. In the upland regions, simple disking has been shown to be effective if you dig during the dry season, when the rhizomes can dry out, and if you disk deep enough to get all of the rhizomes. Though the rhizomes can be found as deep as four feet, most are within six inches and at least a six-inch disking is recommended. Depending on the property, this may not be an option on our barrier islands. But if you have a small patch in your yard, you might be able to dig much of it up.
Chemical treatments have had some success. Prometon (Pramitol), tebuthurion (Spike), and imazapyr have all had some success along roadsides and in ditches north of I-10. However, the strength of these chemicals will impede new growth, or plantings of new plants, for up to six months. There are plants that are protected on our islands and on Perdido Key any altering of beach mouse habitat is illegal. We certainly do not want to kill plants that are holding our dunes. If you feel chemical treatment may be needed for your property, contact the county extension office for advice.
Most recommend a mixture of burning, disking, and chemical treatment. But again, this is not realistic for barrier islands. Any mechanical removal should be conducted in the summer to remove thatch and all older and dead cogongrass. As new shoots emerge in late summer and early fall herbicides can then be used to kill the young plants. Studies and practice have found complete eradication is difficult. It is also recommended not to attempt any management while in seed (in spring). Tractors, mowers, etc. can collect the seeds and, when the mowers are moved to new locations, spread the problem. If all mowing/disking equipment can be cleaned after treatment – this is highly recommended.
Step one would be to determine if you have cogongrass on your property, then seek advice on how to best manage it. For more information on this species, contact your local extension office.
The Gulf of Mexico Sea Grant Science Outreach Team is proud to announce four new outreach items that are applicable throughout the US and showcases marine microplastics and homeowners’ insurance:
Marine Microplastics Primer for Extension Professionals – This publication is intended to serve as a guide for extension professionals to aid in answering questions about microplastics that they have encountered or may encounter in the future. The publication can be accessed at https://gulfseagrant.org/wp-content/uploads/2023/08/MASGP-23-051.pdf.
Property Insurance Basics – Confused about homeowners’ insurance and what it covers or know people who are? The outreach team has created a publication to share basic information about insurance to help property owners make informed decisions about the amounts and types of protection for their homes. Access to the publication can be found https://gulfseagrant.org/wp-content/uploads/2023/08/MASGP-23-015.pdf.
What is Risk Rating 2.0 and how will it affect my flood insurance?–FEMA has updated their risk rating approach through a new pricing method. This change is the biggest change to the way flood insurance premiums are calculated since 1968. Want to learn more about this new system and how it will affect your flood insurance? Click https://gulfseagrant.org/wp-content/uploads/2023/08/What-is-Risk-Rating-2.0.pdf to access our publication.