by Laura Tiu | Jun 6, 2025
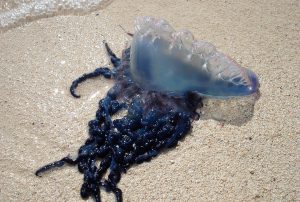
The colonial Portuguese man-of-war.
Photo: NOAA
I love summer; going to the beach, snorkeling, kayaking and grilling in the backyard. But summer comes with its own share of challenges. One of my least favorite summer guests is bugs. The list of bugs I dislike is long, but I’d like to focus on a few that like to torment us all.
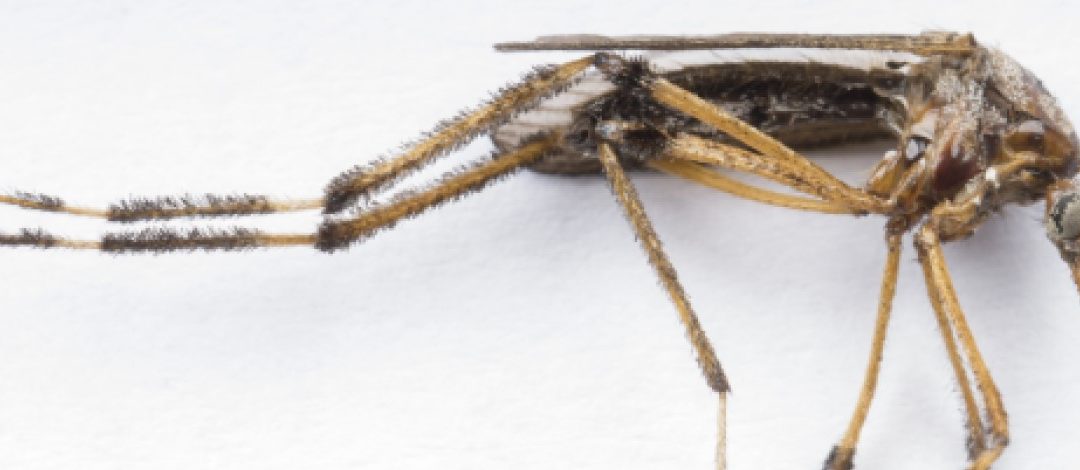
Mosquitos are one of summer’s bad actors. Mosquito lay their eggs and their larvae mature in both manmade and natural water-holding containers such as bird baths, plants, bucket, used tire and holes in trees. Some mosquitos just bite while others carry disease. The easiest way to get rid of mosquitos is to get rid of any water-holding containers in the area.
Ants, in particular fire ants, are another unwelcome summer arrival. This invasive species is aggressive, and their painful stings can injure both humans and animals. Fire ant nests look like large mounds of dirt and typically have multiple openings. You must kill the queen to completely eliminate a colony. Even if the queen is killed, surviving ants may inhabit the mound or make a new mound until they die off. Some treatments that may work to get rid of these pests include baits, pesticides and boiling water.
Many biting flies, yellow flies are my least favorite, persistently attack man and animals to obtain a blood meal. Like mosquitoes, it is the female fly that is responsible for inflicting a bite. These biting flies like shady areas under bushes and trees and wait for their victim to pass by. They typically attack during daylight hours, a few hours after sunrise and two hours before sunset. Currently there are no adequate means for managing populations. Traps are sometimes effective in small areas such as yards, camping sites, and swimming pools.
In the water, jellyfish are the most common summer pest. While not bugs, their reputation for stinging people puts them in a similar category with the above-mentioned pests. Sea lice, actually the larval form of the thimble jellyfish, is a common near shore pest, while Portuguese Man-O-War and the box jellyfish can give a very painful sting. Another type, comb jellies, are not true jellyfish and do not sting. I you get stung, rinse the sting site with large amounts of household vinegar, or jelly-fish-free ocean water, for at least 30 seconds. Do not rub sand or apply any pressure to the area or scrape the sting site.
The University of Florida – IFAS has several good publications with information about these pests and more detail on how to manage them. Check out these publications if you, like me, have had your fill of summer pests.
Florida Container Mosquitos: https://edis.ifas.ufl.edu/publication/IN1315
Ant Control – https://sfyl.ifas.ufl.edu/lawn-and-garden/sustainable-fire-ant-control/
Yellow Flies – https://edis.ifas.ufl.edu/publication/IN595
Jellyfish – http://nwdistrict.ifas.ufl.edu/nat/tag/jellyfish/
by Rick O'Connor | May 12, 2025
With 8 billion humans on this planet there is a need for a lot of space and resources. In this modern world we can get lost in which resources we really NEED and those that we really WANT. We all need a space to live, but we do not necessarily need a 5000 ft2 home, with a pool and manicured lawn – those are wants. But we do need food – and lot of it.
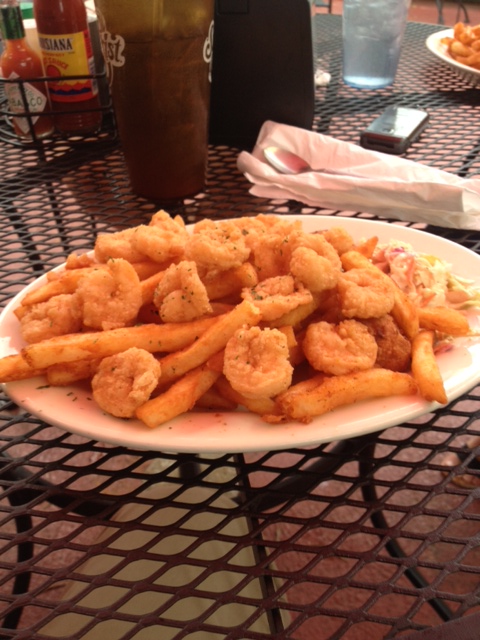
The most popular seafood species – Shrimp.
Thousands of years ago humans fed themselves through hunting and gathering. We hunted, as many do today, for a food source but killed only what they needed – they had no means to store/preserve food in a mobile society such as they had. Groups of humans began to settle into one general location and moved towards and different lifestyle – early agriculture. They would plant seeds and keep livestock to feed on through the course of the year. Many would grow crops but continued to hunt for their meat. They developed methods of smoking and salting meat to preserve it longer. They created large bins where crops could be stored, but most were still growing and gathering the food for their families alone.
As these small sessile communities became larger (growing population) the fields became larger and fed not just their family, but all of the families. Residents would take their livestock to the community “commons” where they could graze – since space to do so at your home was not available.
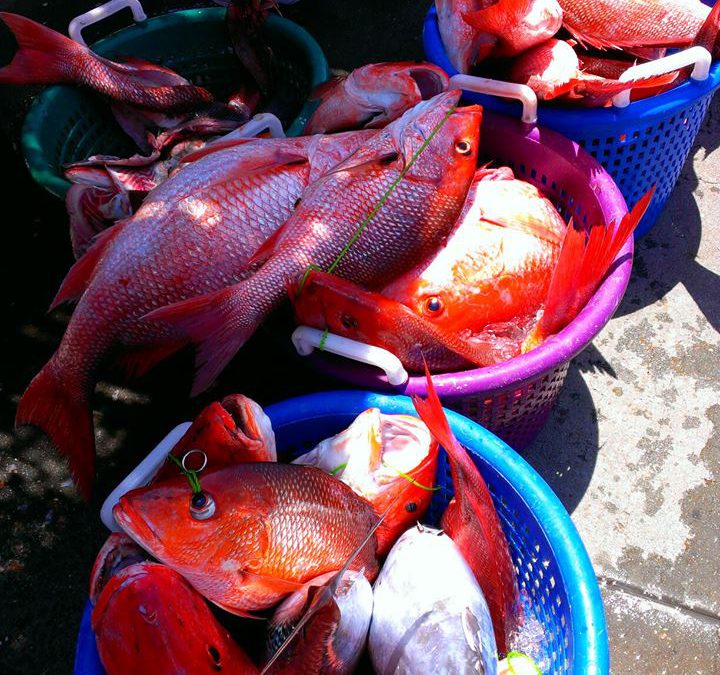
Those who lived on the coast could utilize another resource – marine resources – shell and finfish as well as seaweeds. As with farming, most fishermen began by harvesting for their families, but as the population grew, they began to harvest for others. In both cases – as populations grew, the number of farmers and fishermen grew, and the space and resource needed to sustain the growing communities grew as well.
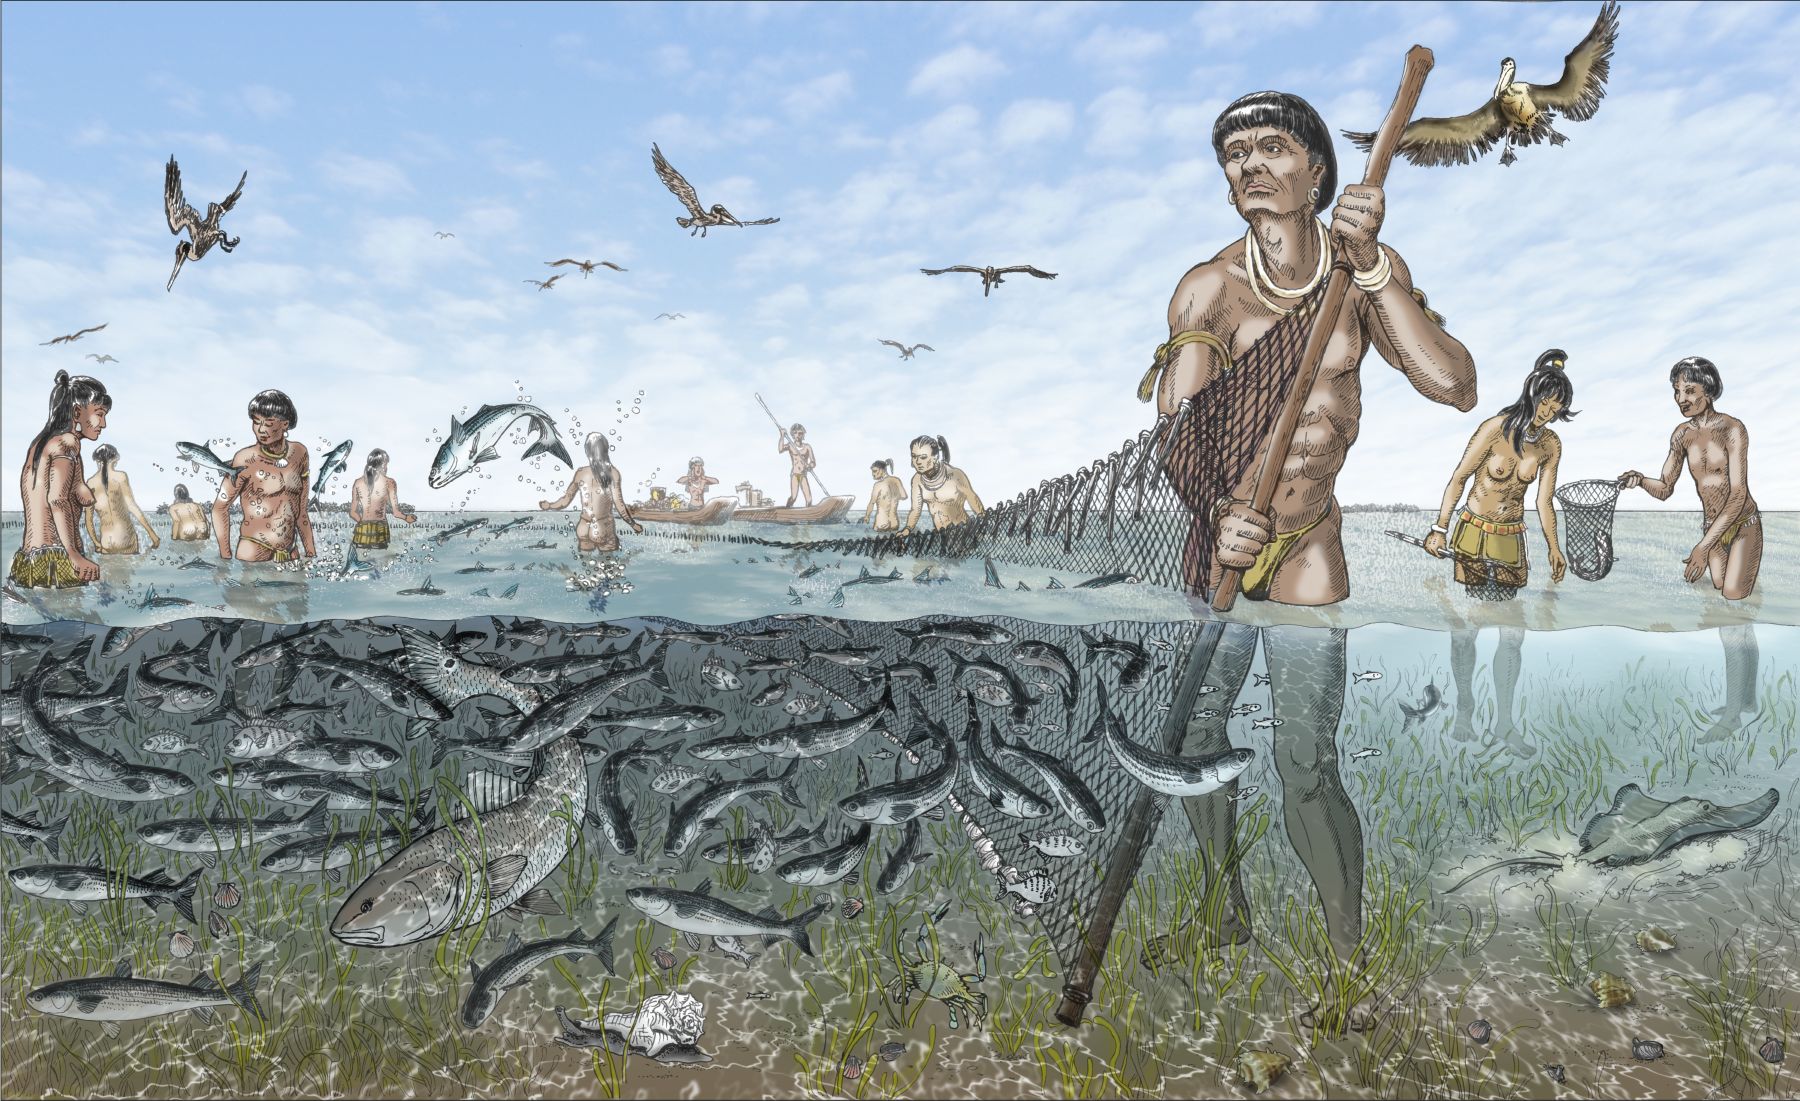
Early fishing.
Image: University of Florida
During the industrial revolution of the 19th century humans begin to develop technologies and methods that could expand farming and fishing to harvest more, more efficiently, and at a faster rate. The world was experiencing a growth in the production of all sorts of products, growth in food production increased as well. With mechanized farming and fishing, we could feed more, the human population could sustain more, and so the population grew. The exponential growth in the human population – what many refer to as the “J” curve – is closely associated with the industrial revolution – which could provide more resources to sustain this growth.
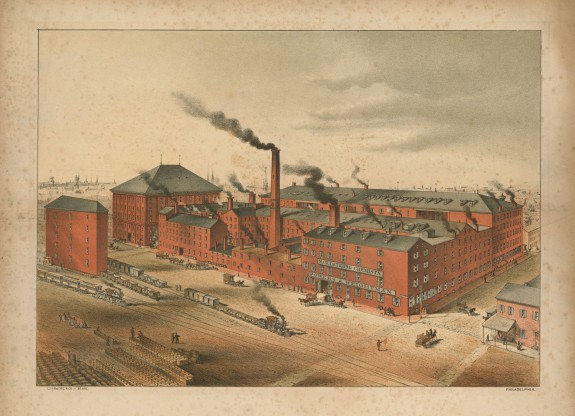
Industrial Revolution.
Image: Encyclopedia of Philadelphia.
The agriculture world began what has been called the “green revolution”. Large expansive fields, growing large amounts of crops, utilizing new machines that could keep up the work. Rice and wheat were staples – grown all over the world. Corn followed. Large expanses in land were cleared to grow these crops as well as graze cattle to help with the demand for meat. Large farms needed mechanized equipment to harvest, process, and transport these food products to markets far away from the farms themselves. Commercial fishing fleets were provided technologies that aided them with locating their target species faster, removing large amounts of fish into larger vessels quicker, and keeping them cold longer at sea to increase harvest yield. They too would need processing plants and transportation to get their products to markets far away from the sea.
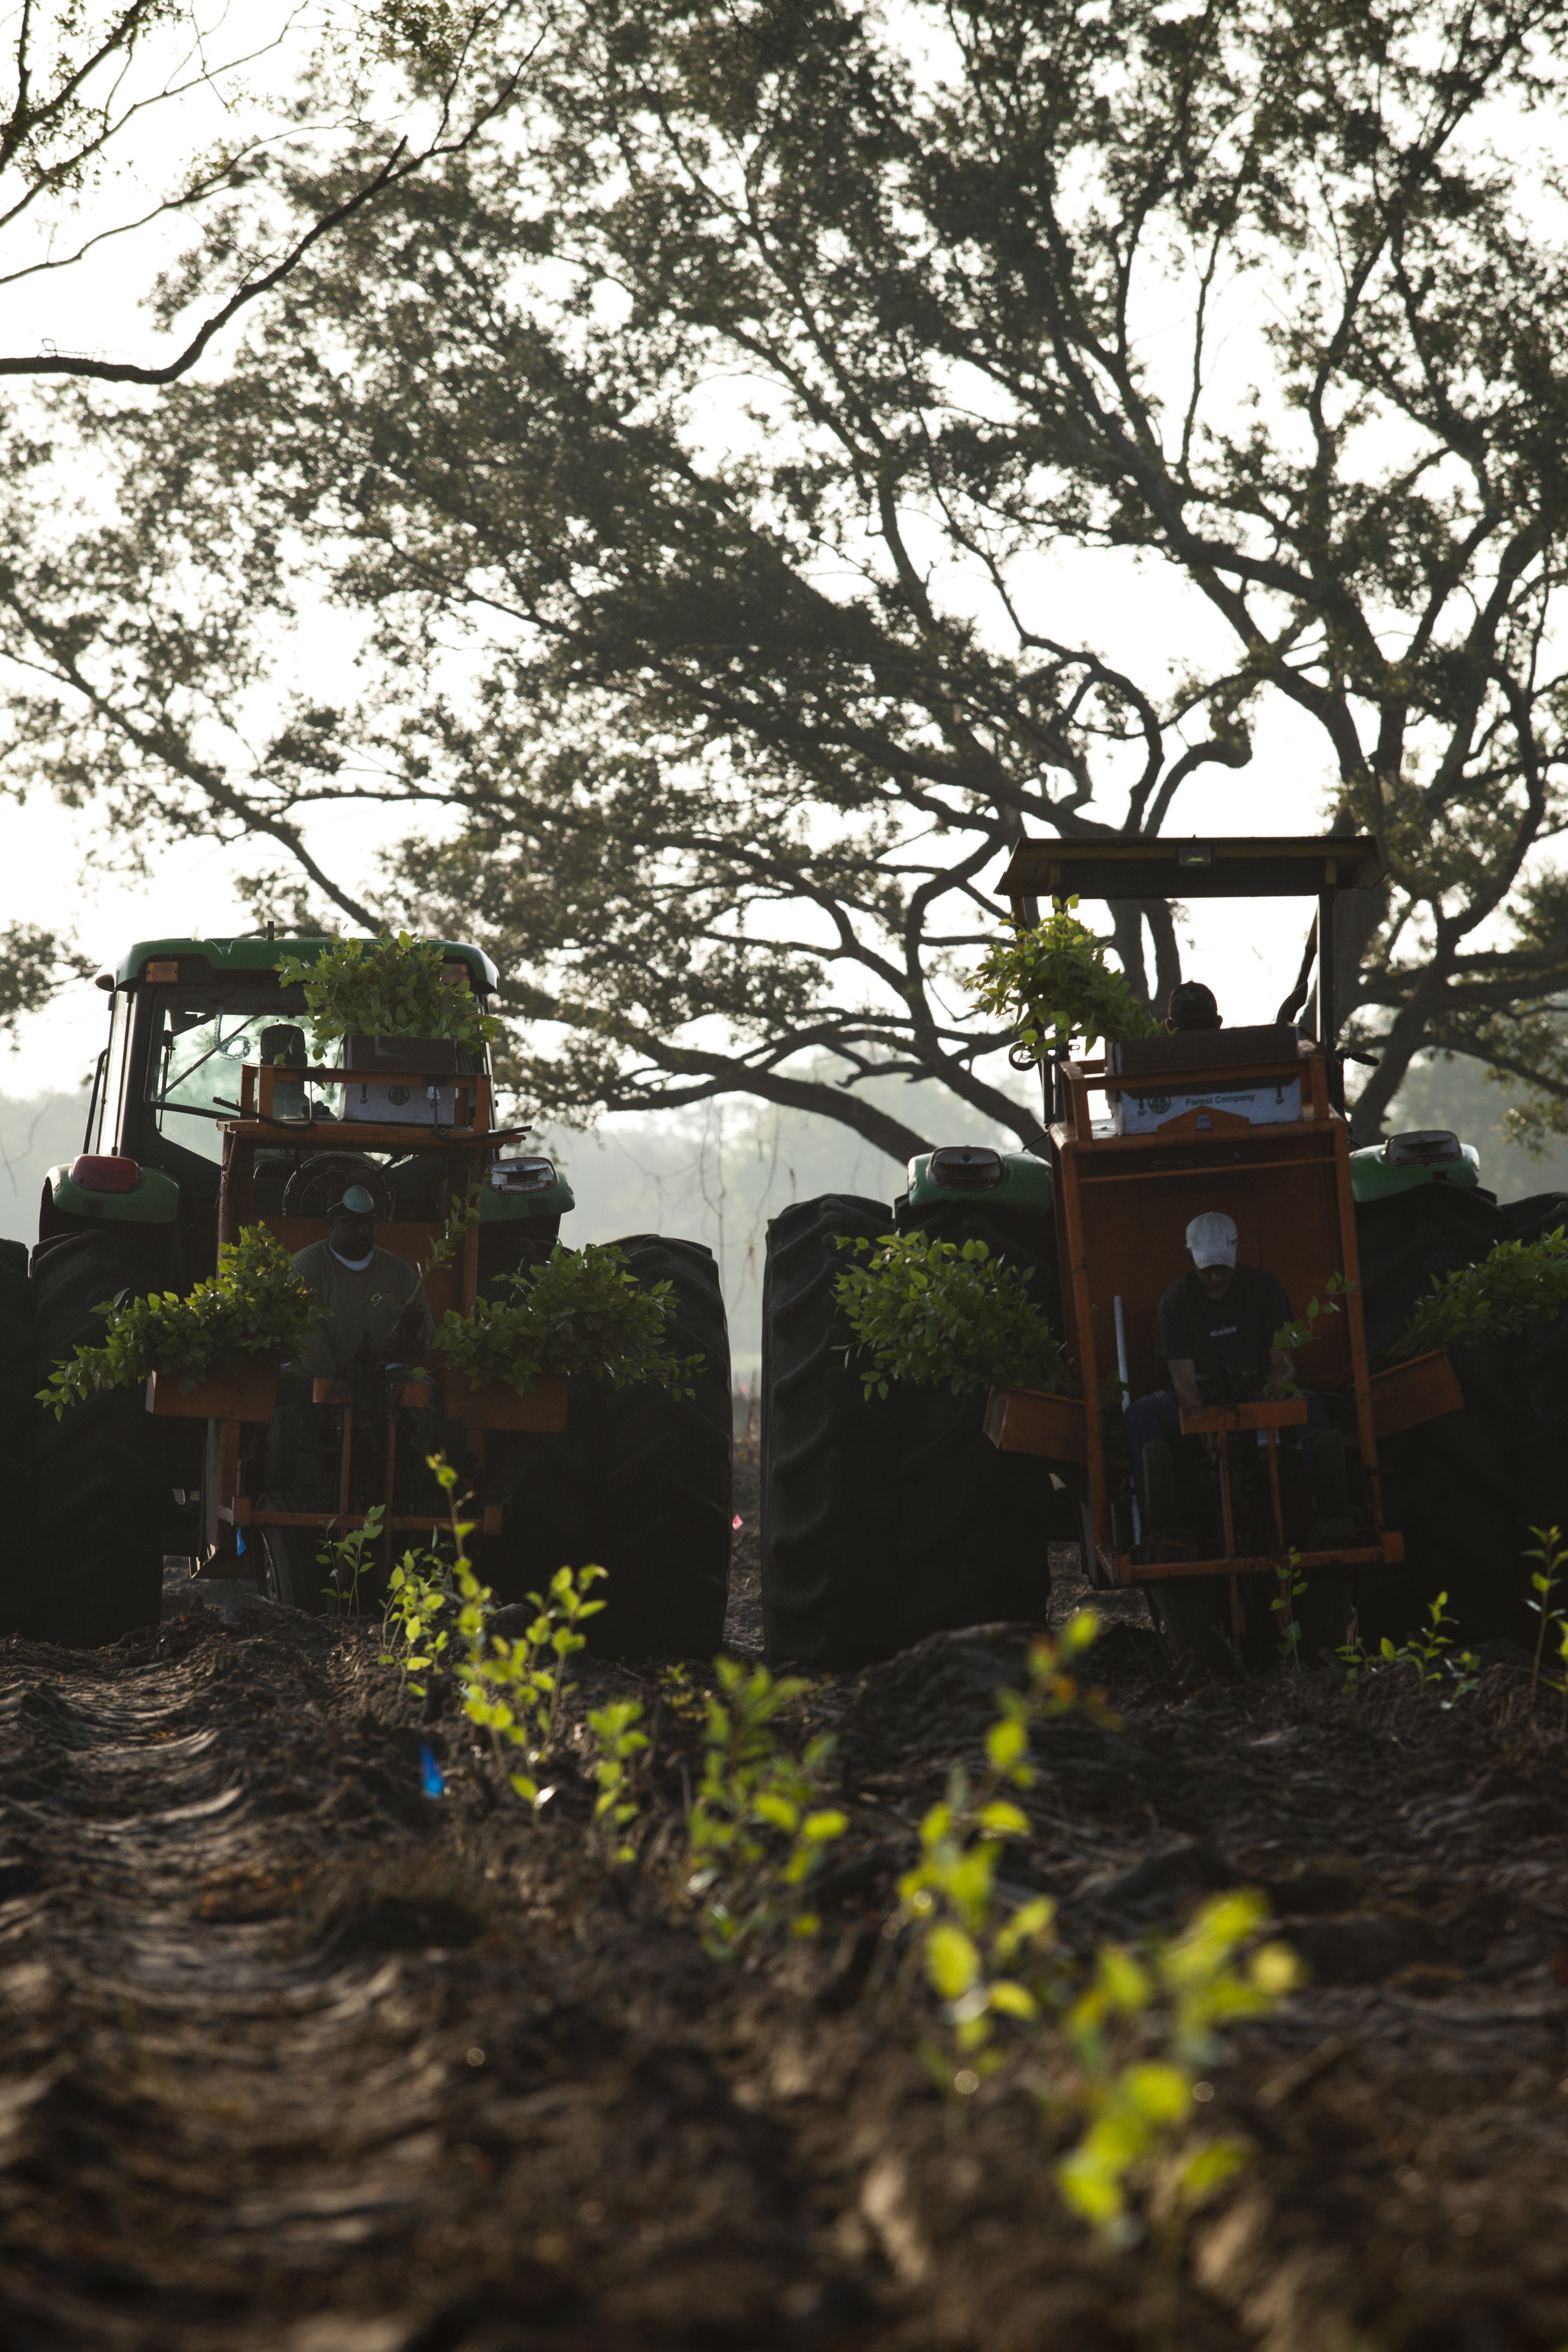
Tractors planting rows of eucalyptus trees. Biomass crops, biofuel, sustainability. UF/IFAS Photo by Tyler Jones.
We began a system to feed a growing human population, and we were very successful. And as the human population continued to grow, the need for better technologies was needed – and delivered. According to the textbook I used when I was teaching this course, we were producing enough food to feed the human population, but there were three problems… (1) we were removing these resources faster than they could replace themselves. (2) when you consume resources you produce waste – this is true even in photosynthesis. As we produced more food, we were also producing more waste. And (3) one in every six people in the developing countries were still not getting enough to eat.
With agriculture they had moved to large area farms where they could plant large numbers of crops, which were harvested as frequently as possible. The stress on the soil became a problem by removing the nutrients at faster rates than mother nature could replace them. To add to the problem most fields grew the same crops, thus removing specific nutrients at a faster rate – compounding the problem. Farmers were literally working the fields to death.
Livestock moved to larger factory farms with large processing plants for larger numbers of cattle, chicken, and pigs. There was not enough space to free range cattle as they had done prior to the green revolution. So, now they were commercially fed, and this could be done in a smaller space with large numbers of animals in such. Crowding creatures like this can enhance the spread of disease and produces large amounts of waste that must be managed.
In the commercial fishing world, they were removing fish faster than nature could replace them. Many fishing grounds went “silent” as the fish populations declined forcing fleets to find new waters or new target species to harvest. We began to overfish the oceans.
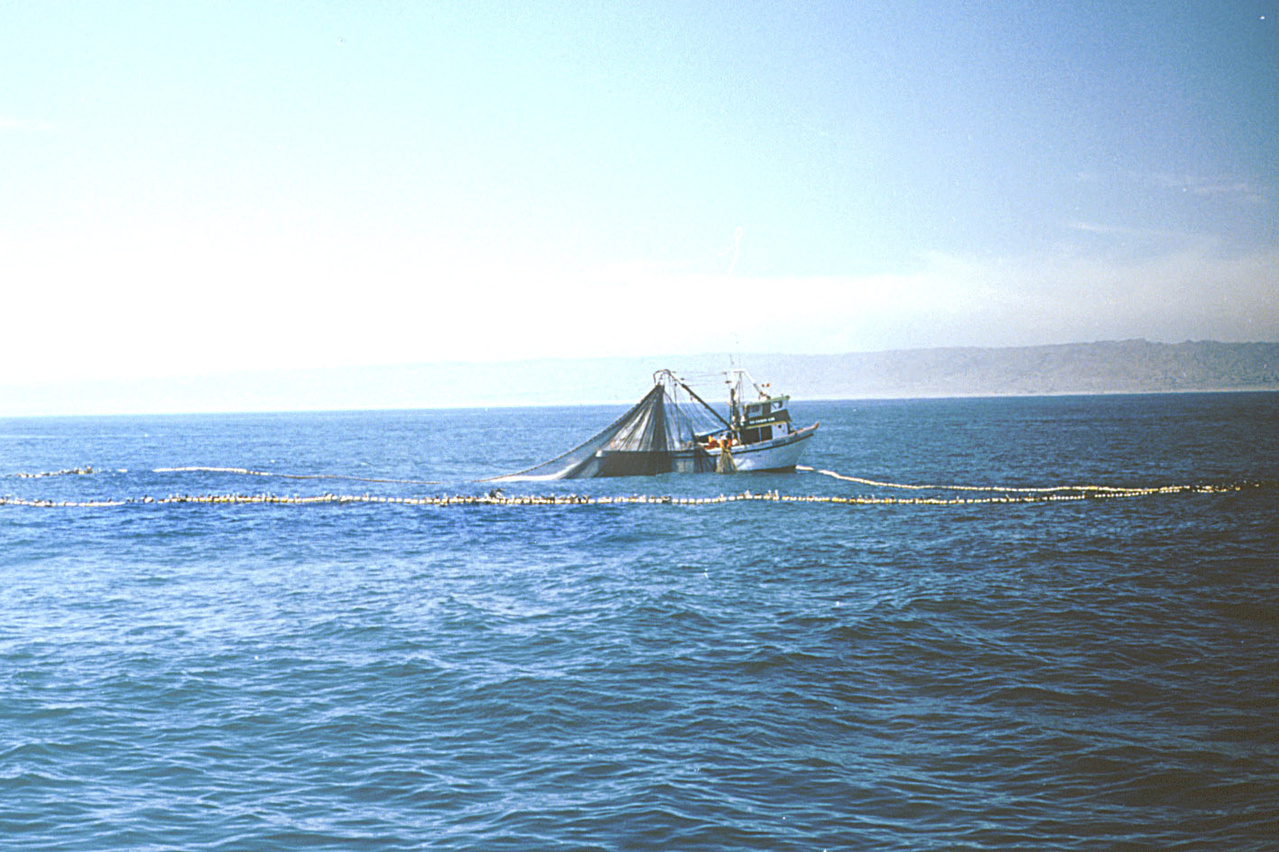
Purse seining in the Pacific Ocean.
Photo: NOAA
Man’s ingenuity had developed a mechanized system for feeding their population – and it worked well. But it developed some problems both for the system and food production and for the environment as well. In the next few articles, we will look at how we are trying to resolve those problems.
by Rick O'Connor | May 2, 2025
Many of the creatures we have written about in this series to this point are ones that very few people have ever heard of. But that is not the case with jellyfish. Everyone knows about jellyfish – and for the most part, we do not like them. These are the gelatinous blobs with trailing tentacles filled with stinging cells that cause pain and trigger the posting of the purple warning flags at the beach. They are creatures that many place in the same class as mosquitos and venomous snakes – why do such creatures even exist. But exist they do and there are plenty in the northern Gulf – more than you might be aware of.
Jellyfish are common on both sides of the island. This one has washed ashore on Santa Rosa Sound.
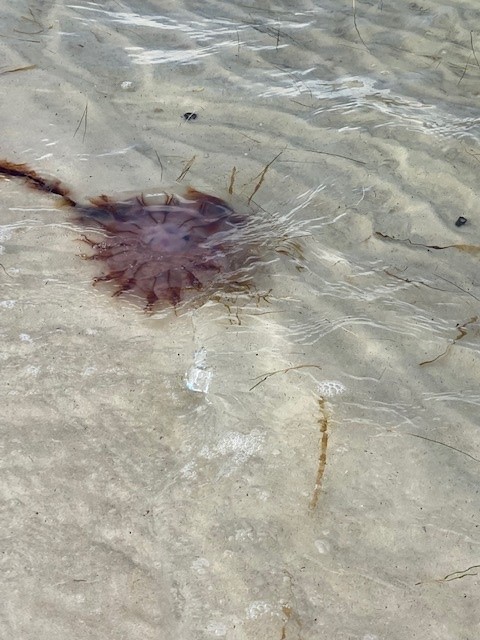
The ones we are familiar with are those that are gelatinous blobs with trailing tentacles – called medusa jellyfish. These include the common sea nettle (Chrysaora). Sea nettles have bells about 4-8 inches in diameter (though they are larger offshore). The bell has extended triangle markings that appear red and tentacles that can extend several feet beneath/behind the bell. The tentacles are armed with nematocyst – cells that contain a coiled “harpoon” which has a drop of venom at the tip. They use these nematocyst to kill their prey – which include small fish, zooplankton, and comb jellies. But they are also triggered when humans bump into them producing a painful sting. Their prey is digested in a sack-like stomach called the gastrovascular cavity and waste is expelled through their mouth, because they lack an anus. Though these animals can undulate their bells and swim, they are not strong enough to swim against currents and tides – and thus are more planktonic in nature.
Another familiar jellyfish is the moon jelly (Aurelia). These are the larger, saucer shaped jellyfish that resemble a pizza with a clover leaf looking structure in the middle. They can reach 24 inches in diameter across the bell which is often seen undulating trying to swim against the current and tide. Their tentacles are very short – extending from the rim of the bell – but there are four large oral arms that are quite noticeable. The oral arms also possess nematocyst for killing prey. Their prey includes mostly zooplankton and other jellyfish. Like their cousins the sea nettles, moon jellies are planktonic in nature and are often found washed ashore during high energy days. Some say the pain from this jellyfish is minimal, others feel a lot of pain.
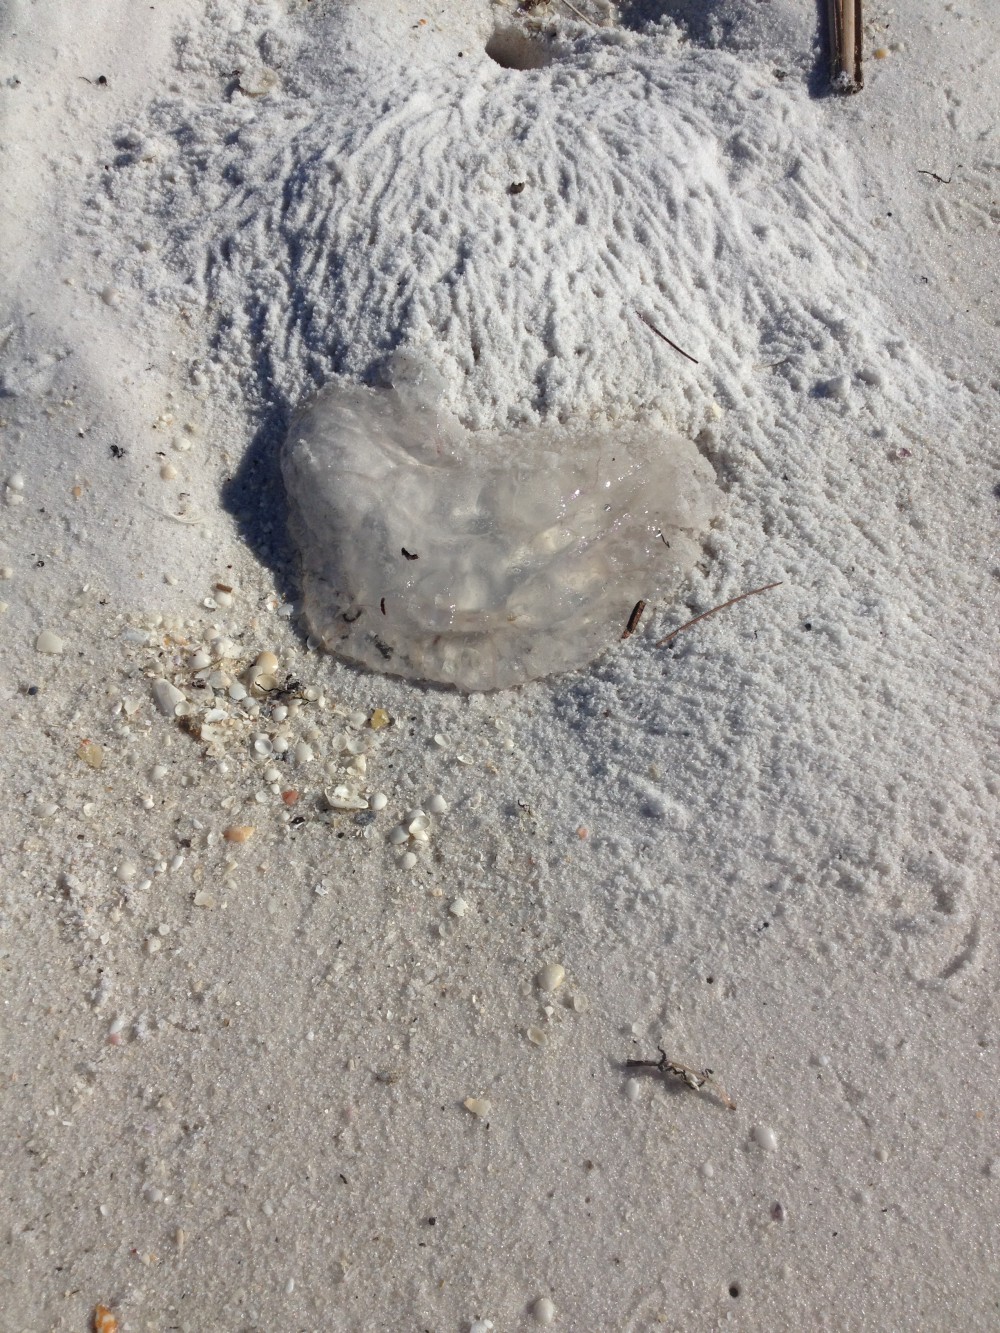
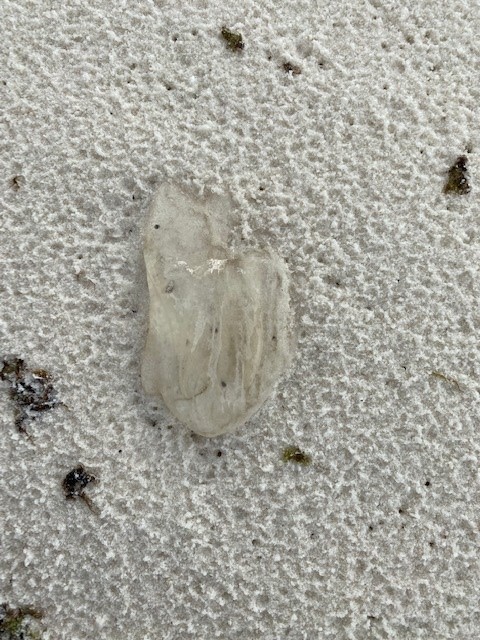
The remnants of moon jellyfish near a ghost crab hole.
Photo: Rick O’Connor
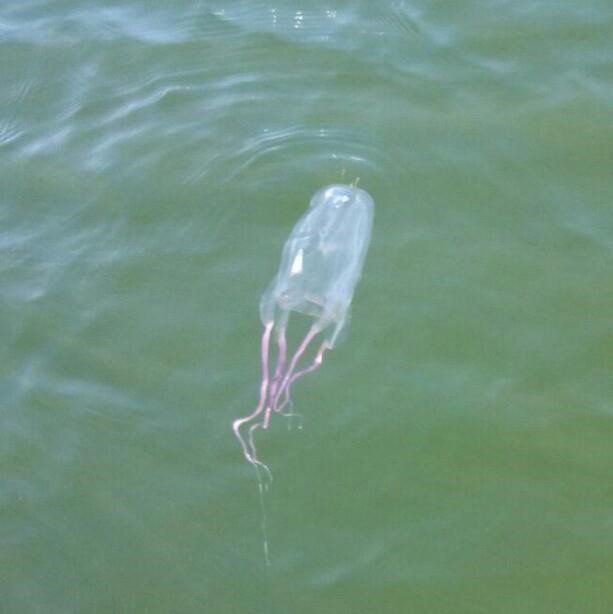
Though there are many others, our final familiar jellyfish would be the Portuguese man-of-war (Physalia). If you have never seen one, you most likely have heard of them. These are easy to identify. They produce a bluish colored gas filled balloon like sack that floats on the surface and extends above water to act as a “sail”. This gas filled sack is called a pneumatophore and helps move the animal across the Gulf. Extending down from this pneumatophore are numerous purple to blue to clear colored tentacles. You would think the pneumatophore would be the bell of the jellyfish and the tentacles of similar design as to the ones we mentioned above – but that would be incorrect. The tentacles are actually a colony of small polyp jellyfish connected together – it is not a true jellyfish (as we think of them). The stomachs of these individual polyps are connected and as one kills and feeds, the food passes throughout the colony to nourish all. In order to feed the whole colony, you need larger prey. To kill larger prey, you need a more toxic venom, and PMOW do have a very strong toxin. The sting from this animal is quite painful – though rare, it has even killed people. This jellyfish should be avoided. As with other jellyfish, they often wash ashore, and their stinging cells can still be triggered. Do not pick them up.
There is another form of jellyfish found here that is not as well known. They may be known by name, but not as jellyfish. They are called polyp jellyfish and instead of having an undulating bell with tentacles drifting behind, they are attached to the seafloor (or some other structure) and extend their tentacles upward. They look more like flowers and do not move much. Examples of such jellyfish include the tiny hydra, sea anemones, and corals. As with their medusa cousins, they do have nematocysts in their tentacles and can provide a painful sting, though some produce a mild toxin, and the sting is not as painful as other jellyfish. Many of these polyp jellyfish are associated with coral reefs. Though coral reefs are common in tropical waters, they do occur to a lesser extent in the northern Gulf.
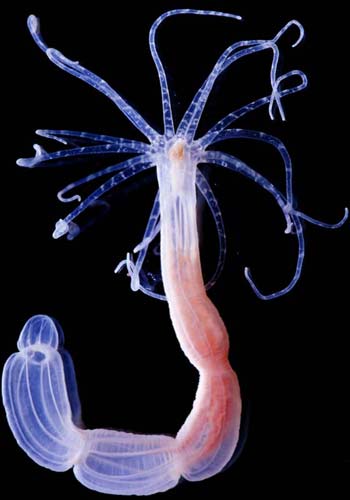
The polyp known as Hydra.
Photo: Harvard University.
We will complete this article with a group of jellyfish that do not have nematocysts and, thus, do not sting – the comb jellies. Though many species of comb jellies have trailing tentacles, the local species do not. When I was young, we called them “football jellyfish” because of their shape – and the fact that you could pick them up and throw them to your friends. I have also heard them called “sea walnuts” because of their shape. A close look at this jellyfish you will see eight grooves running down its body. These grooves are filled with a row of cilia, small hairlike structures that can be moved to generate swimming. The cilia move in a way that they resemble the bristles of a comb we use for combing our hair. You have probably taken your thumb and run it down your comb to see the bristles bend down and back into position – sort of like watching the New York Rockettes high kick from one end of their line to the other – this is what the cilia look like when they are moving within these grooves – and give the animal its common name “comb jelly”. Since they do not have nematocysts, they are in a different phylum than the common jellyfish. They feed on plankton and each other and can produce light – bioluminescence – at night.
Though not loved by swimmers in the northern Gulf, jellyfish are interesting creatures and beautiful to watch in public aquaria. They have their bright side.
Comb jellies do not sting and they produce a beautiful light show at night.
References
Atlantic Sea Nettle. Aquarium of the Pacific. https://www.aquariumofpacific.org/onlinelearningcenter/species/atlantic_sea_nettle1.
Moon Jellyfish. Animal Diversity Web. University of Michigan Museum of Zoology. https://www.aquariumofpacific.org/onlinelearningcenter/species/atlantic_sea_nettle1.
by Rick O'Connor | May 2, 2025
There are numerous websites that show the human population numbers changing “real time” – the last single digit constantly changing – possibly as fast as 4 new humans every second. How do we slow this down?
As we mentioned in the last article, other creature populations respond by either slowing/stopping reproduction or having members of the population disperse to new territories to reduce the pressure on the resources. Sometimes conflict is the response. There was one study where researchers had a space with a fixed area. Within this they place a small population of rats. They provided the rats with “X” amount of food and “X” amount of water each day. At first, the amount of food and water was more than enough to support them. As the population increased (and rats have a high growth rate) the researchers did not increase the amount of food and water – there began to be conflicts within the population – they began to fight – sometimes killing each other.
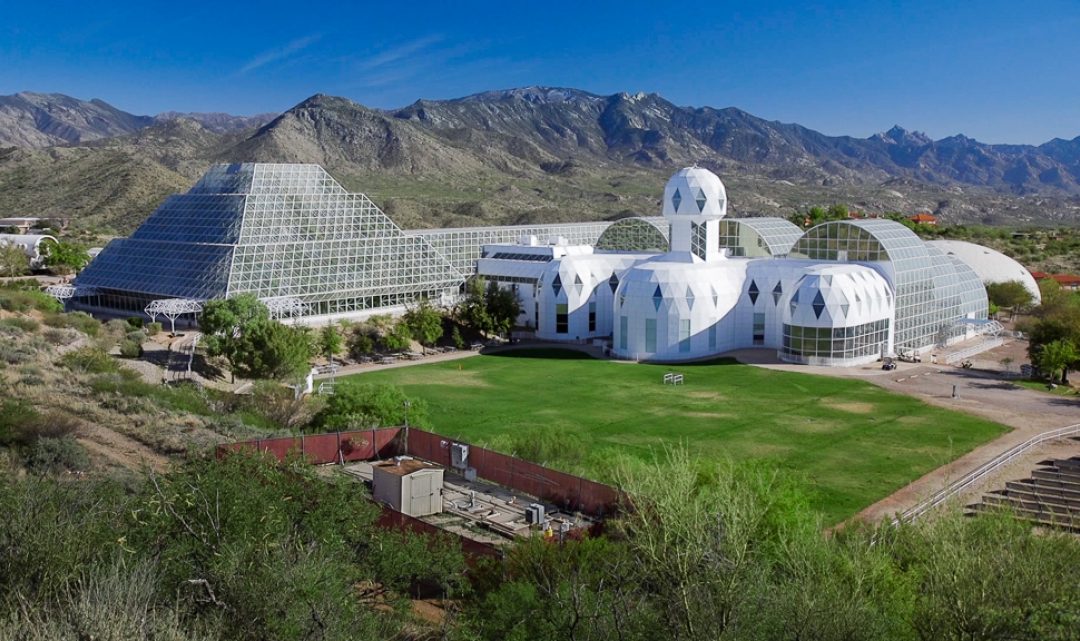
Homo sapiens have already dispersed to every corner of the planet. There are a few islands, and the continent of Antarctica, we have not colonized – but there is little space for us to disperse more. During my life I have heard discussions about colonizing the ocean floor and the moon. People have talked about sending humans to Mars to deal with the overflow. There have been experiments and trials to determine whether we could do this. I know one marine scientist who lived on the bottom of the Caribbean for several months with others to “test” whether this would work. He mentioned the crowded space did begin to wear on them. He said at one point they were using masking tape to mark off individual’s space – even for their toothbrush. I read about someone who lived in a cave for one year to see if they could live on the bottom of the ocean with only artificial light for the same amount of time. There is the famous Biosphere 2 Project where they placed humans within a closed system to determine where we could inhabit Mars. Humans have already spent much time in space orbiting Earth. In each case there were physical and psychological problems. It is still to be determined whether these dispersal ideas will work.

Biosphere 2
Photo: University of Arizona
If dispersal is not the answer, then slowing population growth would be the next thing to address. Many developed countries have slowed their growth. Much of this has to do with more people going into professions that require college degrees – others are getting married later in life and having fewer children. Much of it has to do with the role change for women. More women are going to college and becoming professionals themselves – delaying marriage and the number of children even further. The growth rate in Europe has slowed dramatically. It has not surpassed 1% since 1961 and has slowed each year since. The reasons can be attributed to those just mentioned – but Europe also has limited space. Asia’s population growth rate has also declined, reaching less than 1% in 2016 – though it varies from one country to another. South America also began a decline in the 1960s and is currently below 1%. But the story in Africa is a little different. Though there has been a decline in the growth rate, it did not start until around 2015 and is still above 2%.
The idea of “just stop having kids” is not as simple as you might think. I was asked when I was teaching this course “Why are the birth rates are so high in developing countries where resources are already stretched?” It is a fair question, but you must also understand how life works in some of these countries. Many have large families to help run the farm or business, they cannot afford to hire labor. I had a student from such a country in a class for one semester and he agreed. He said his father ran a garage and his mother ran the restaurant attached to it. His brothers and sisters were the employees. In some cultures, particularly in the developing world, women are not going to school. The children take care of the elderly and so families need to have employed sons to take care of them. Knowing that health programs are not what they are in the developed world, parents will have several sons to make sure at least one survives long enough to land a good career and be able to support them. Daughters do not help – so, they will continue to have children until this need is met. In many of these cultures the daughters are expected to marry into money to help take care of them in their old age – and in some cases the daughters are expected to have sons as well – as early, and as many, as possible to prepare.
China had their famous “one-child only” policy, which began in 1979. The purpose was to slow their growth rate and stabilize their enormous population. Under this plan Chinese families were to have only one child, with fines assessed for any additional children. Similar to other cultures, a couple would be expected to take care of both parents, and both sets of grandparents. Under the one-child policy, this became a huge burden for a single couple. In 2009 China changed the policy to where couples who had no siblings could have two children at no penalty. There was the added problem of your only child being a female. Females would be married off to another family leaving no one to support her parents. China did relax the laws in such cases to allow extra children in hopes of having a son. Under this new policy in 2016 there were 17.9 million babies born in China – a record for the 21st century. The growth rate has declined some since. Some of this has to do with the cost of raising a child in China.
I used to show a film to my students addressing this issue. In one part it showed an elementary school in Japan from the outside. The camera slowly circled the school until you see the front door – the camera goes in. As you go down the hallways, the classrooms are empty – until you reach this one classroom. Within in sits a single 5th grade boy – he is the only student in the entire school. This showed how dramatic the population decline in Japan had become. The problem here was similar to China’s – who would take care of the elderly. This system is different though that in Japan the elderly are often taken care by a “social security” type system. Young employed people pay a tax that supports the care of the elderly. With no young workers, there are no taxes, and elderly care became a problem. This system had to be changed.
One response to this problem has been paying families to have more children. In some countries this has been in direct payments to the parents, in others it has been in the form of free childcare, paid time off for family needs, etc. According to one report – this has not helped – birth rates continue to decline. Part of this is a social issue, today’s young generation is not as interested in having large families, or families at all. In the United States there has been a drop in birth rates, but this has not impacted us as much due to immigrants moving in and filling that niche. This may be changing now.
The human population story is a very complicated and interesting one. From a “natural history” side we understand the need to slow the growth rate. From a cultural/economic one, we understand why/how this can be problematic. Either way the large number of humans on the planet are stressing our resources. The next few articles in this series will look at what resources we need to survive and how we are managing them.
References
Worldometer. https://www.worldometers.info/world-population/.
Annual Population Growth Rate of Europe; 1950-2023. Statista. https://www.statista.com/statistics/1251591/population-growth-rate-in-europe/#:~:text=The%20population%20of%20Europe%20decreased,and%20between%202020%20and%202023..
Population Growth in Latin America and the Caribbean Falls Below Expectations and Region’s Total Population Reaches 663 Million in 2024. The United Nations. https://www.cepal.org/en/pressreleases/population-growth-latin-america-and-caribbean-falls-below-expectations-and-regions.
Population Growth Rate in Africa From 2000 to 2023. Statista. https://www.statista.com/statistics/1224179/population-growth-in-africa/.
Two Child Policy. Wikipedia. https://en.wikipedia.org/wiki/Two-child_policy#:~:text=From%202016%20to%202021%2C%20it,for%20exceeding%20them%20were%20removed..
North, A. 2024. You Can’t Even Pay People to Have Kids. Population Connection. https://populationconnection.org/article/you-cant-even-pay-people-to-have-more-kids/#:~:text=Other%20countries%20have%20tried%20direct,of%20around%20%2430%2C000%20to%20newlyweds.
by Rick O'Connor | Apr 11, 2025
Following the textbook I used when I was teaching environmental science there were 6.7 billion humans on the planet in 2011. I remember when we hit 6 billion. There was a lot made of it in the media. Currently (2025) we are at 8 billion. The textbook I used was published in 2011 – which means we have seen a growth of 2 billion people over 14 years – that’s a net gain of 143 million each year – 12 million each month – 400,000 a day – 17,000 an hour – 275 each minute – a net gain of 4 humans every second. Our population growth rate is astounding.
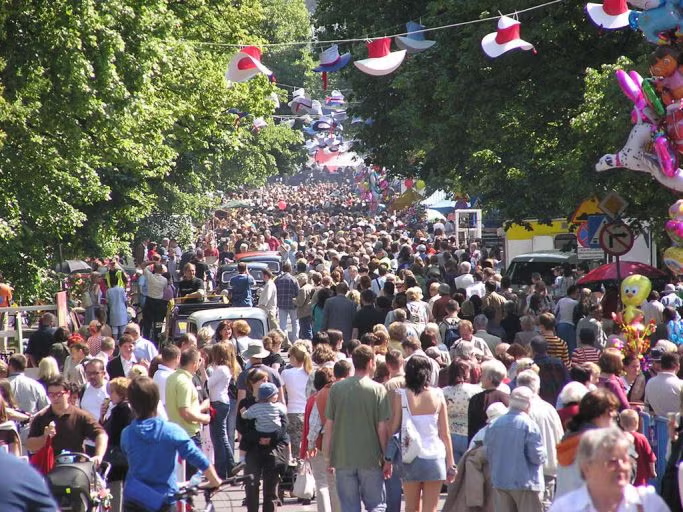
There are nearly 8 billion people on the planet today.
Photo: University of Central Florida
The calculation used to measure population change over time is relatively simple.
Population change = (births + immigration) – (deaths + emigration)
The natural history of creatures on our planet follows the same basic principle. There is a correlation between the number of offspring produced and the amount of parental care provided. The goal of each parent of any species is to have at least one of your offspring reach sexual maturity. Those who give very little parental care – trees, grasses, sea turtles, jellyfish, etc. – will produce large numbers of offspring knowing that over 90% will not make it – many will not make it past the first few days. Those who produce few offspring – songbirds, manatees, and gorillas – provide parental care to assure at least one makes it. Some will provide parental care for a few days, or a few weeks, others will provide it for a few years. BUT even those who show parental care typically produce 2-3 offspring knowing that a couple will not survive.
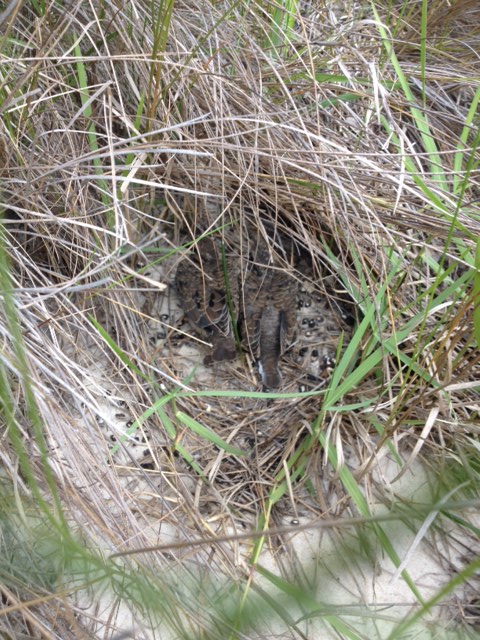
This nest of birds has three chicks. Not all will survive.
Photo: Rick O’Connor
This is a piece of the population control story. It does not benefit any species to have an overpopulation problem. I had to take an oral examination to complete my graduate degree. You are in a chair facing a long table full of professors who are asking you all sorts of questions. One question was “who is a rhinoceros’ greatest competitor?” Being very nervous I was bumbling and fumbling in my brain trying to figure WHO would be their biggest problem… and then – it came to me… another rhinoceros. They want the same space, the same resources, and the same mates as you. Competition begins day one. Over population is a problem for everyone. Other things that effect the number of newborns from reaching sexual maturity are predators and disease. In some species even the parents (typically the father) may be a predator – and will kill their own offspring (polar bears).
Placing humans in this model – we will see that typically there is only one offspring produced. Parents must do all they can to help this offspring reach sexual maturity. For Homo sapiens females reach sexual maturity between the ages of 8 and 13, 9 and 14 for males. In many cultures this is when the parent’s job is over and the child either enters an apprenticeship or gets married. Most cultures do not recognize “adulthood” until the age of 18. So… your job as a parent is to make sure they reach that age.
For most of our history environmental factors played a role in controlling population growth – namely disease. 200+ years ago, many children did not survive childbirth or died early from diseases. But things have changed.
It took from the time humans arrived on the planet to 1927 for us to reach 2 billion humans. It took less than 50 years to add the next 2 billion (1974), and only 25 years at add the next 2 billion (1999). The textbook I used stated we will reach 7 billion by 2012 – we reached it in 2011. They are expecting 9.7 billion by the year 2050.
What happened? What changed to create such a large exponential growth in the human population? The answer lies on both sides of the population change equation – more births are making it to puberty and less people are dying. Modern medicine has done miracles in improving overall human health on both ends – and this is wonderful news, but it does come with a cost. As with any species population – there is only so much space and resources. When the population of a species begins to stress this – many creatures will cease (or slow) reproduction. Another answer we see is dispersal – members of the population will move to new locations and build new populations reducing the stress on the resources. As we mentioned in a previous article – they will spread across the landscape until they reach a barrier that stops them from going further. But in nature the role of predators and disease has not gone away as it has with humans. The current growth rate for humans is 1.1% but has been slowly declining since the 1960s.
This brings up the question of carrying capacity (K) – the maximum number of individuals a population’s space and resources can support. As we mentioned, when K is reached in the natural world species either slow reproduction, disperse, or both. But what IS the carrying capacity for humans on this planet? The textbook I used mentioned there was no consensus on this. Some were saying as low as 2 billion – which we know was not accurate, though some would say some parts of the world are already in a population crisis. Others say it may be as high as 30 billion. A quick search on the internet finds the following…
- The AI response states somewhere between 9-10 billion.
- The Australian Academy of Science states it could be between 500 million and 1 trillion.
- The Population Connection states it is between 500 million and 1 sextillion (21 zeros).
Bottom line – we do not know – it depends on which model you use and how you view/term a functioning population. When I was teaching the class, most models stated somewhere between 10-15 billion.
As we mentioned, when you are reaching carrying capacity – most will either slow/stop reproduction or disperse. In our next article, we will look at how humans might address this problem.
References
Miller, G.T., Spoolman, S.E. 2011. Living in the Environment. Brooks/Cole Cengage Learning. Belmont CA. pp. 674.
Puberty and Precocious Puberty. Eunice Kennedy Shiver Institute of Child Health and Human Development. https://www.nichd.nih.gov/health/topics/puberty.
Population. United Nations. https://www.un.org/en/global-issues/population.
Human Population Growth. Libretexts. https://bio.libretexts.org/Bookshelves/Introductory_and_General_Biology/General_Biology_(Boundless)/45%3A_Population_and_Community_Ecology/45.04%3A_Human_Population_Growth/45.4A%3A_Human_Population_Growth.
How Many People Can the Earth Actually Support? Australian Academy of Science. https://www.science.org.au/curious/earth-environment/how-many-people-can-earth-actually-support.
What is the Carrying Capacity of Earth? The Population Connection. https://populationconnection.org/blog/carrying-capacity-earth/.
by Rick O'Connor | Mar 28, 2025
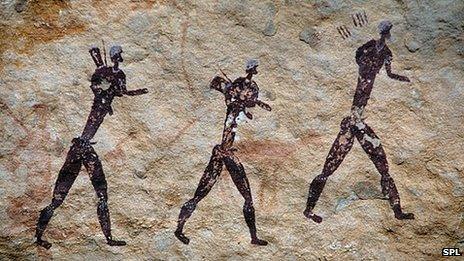
Evidence suggests that Homo sapiens’ initial population originated in east Africa – though some think we may have originated in southern Africa, and others from northwest Africa. It is believed this occurred about 300,000 years ago. The first humans were hunter gathers and fed primarily on small prey and plants – we are omnivorous. With the development of stone tools early humans could feed on larger prey and take a different position in the food chain.
Evidence suggest that humans originated in Africa and began their dispersal across the planet from there.
Image: BBC.
Populations of all creatures increase and decrease due to the number of births, deaths, immigration, and emigration within their populations (we will focus more on the human population in the next article). As populations grow, competition for needed resources increases. One response to this competition is dispersal – the movement of members of a population to a new location where resources can be found. This is different than migration in that in dispersal the members do not return – they have moved away.
Evidence suggests that humans began dispersing from Africa very early. It was thought at first humans did move into southern Africa, but there was a mass movement north into the Middle East. From here humans began to move east along southern Asia to India and beyond to southeast Asia. There is evidence of “island hopping” as they made their way across Indonesia and eventually to Australia. Later groups from southern Asia dispersed north into northern Asia. From here there were two movements – one into Europe and another across an exposed landmass connecting Asia to North America – remember the Earth continues to go through slow change over time. At one time there was a land bridge that connected the two continents and allowed humans, and other species, to cross. Humans began to spread across North America and – with the emergence of a land bridge in Central America – reached South America. There are those who also believe – based on language and culture – some Polynesian humans reached South America by boat. To test this idea an expedition sailed from Polynesia to South America on a balsa wood raft called Kon Tiki in the 1940s. This same team attempted to sail from Africa to South America to show this could have been a dispersal route as well using boat materials from that time – but that expedition failed. However they reached South America, they did – and humans had dispersed to cover all landmasses except Antarctica. This still holds true – there are no native populations of humans on the Antarctic continent – only visitors.
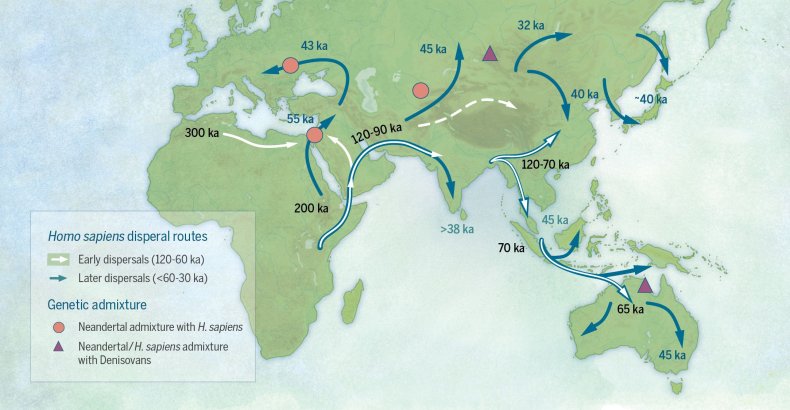
This shows possible dispersal routes of humans out of Africa.
Image: Newsweek.
Within each region of the planet where humans have inhabited, we find physical and cultural differences. The physical difference – which we call races today – were adaptations to the environment where they lived. There languages, tools and building practices, songs and instruments, and religions were all born from the area where they lived. Many of these populations were isolated from each other – and so their cultures became quite different. As these populations grew and expanded, they would come in contact with each other. Many times, these different cultures, or tribes, would fight for resources and space. As our imaginations and technologies grew, some cultures were able to cover more territory and conflicts increased.
Today there are about 8 billion humans on the planet. Some areas are more densely populated than others. Based on the website Worldometer – we are gaining a new human almost every second.
Over history, most species have had a slower population growth – if growing at all. Numbers are kept under control by predators, disease, and environmental conditions that impede, or restrict, reproduction. But not with humans. In the next article we will look closer at the cause of the human population explosion.
References
Pavid, K. 2018. Rethinking Our Human Origins in Africa. Science News. Natural History Museum. https://www.nhm.ac.uk/discover/news/2018/july/the-way-we-think-about-the-first-modern-humans-in-africa.html.
Pobinar, B. 2013. Evidence for Meat-eating by Early Humans. Nature Education Knowledge. (46)1. https://www.nature.com/scitable/knowledge/library/evidence-for-meat-eating-by-early-humans-103874273/#:~:text=Tooth%20morphology%20and%20dental%20microwear,Ungar%202000%3B%20Luca%20et%20al..
Dorey, F., Blaxland, B. 2020. The First Migrants Out of Africa. Australian Museum. https://australian.museum/learn/science/human-evolution/the-first-migrations-out-of-africa/.
Kon Tiki Expedition. Wikipedia. https://en.wikipedia.org/wiki/Kon-Tiki_expedition.
Worldometer. https://www.worldometers.info/world-population/.

