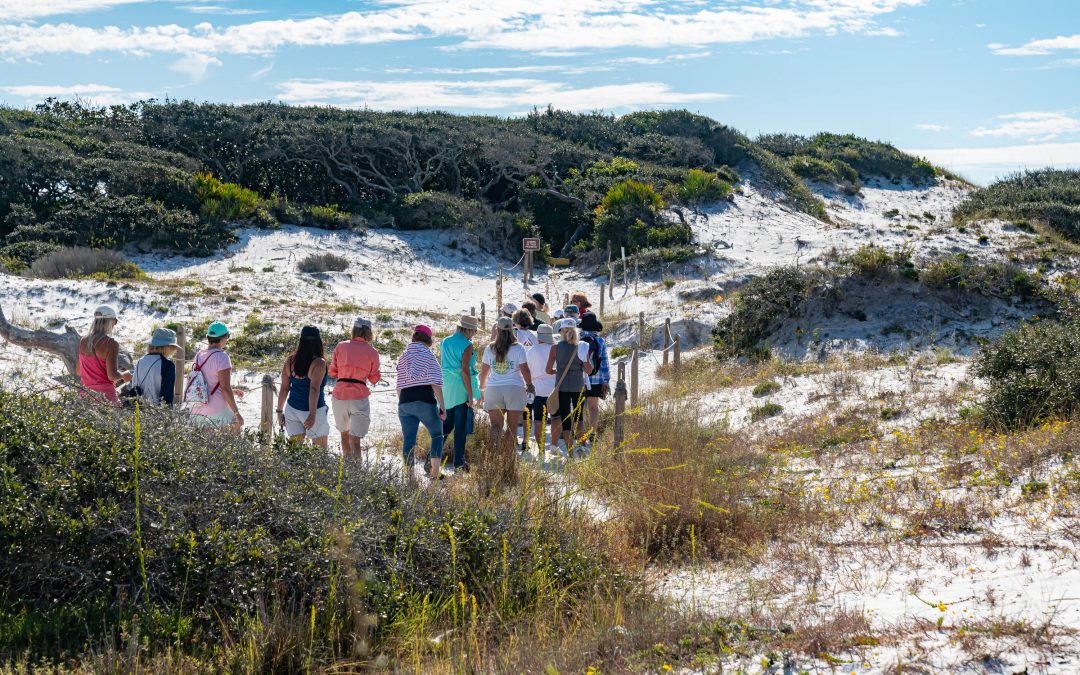
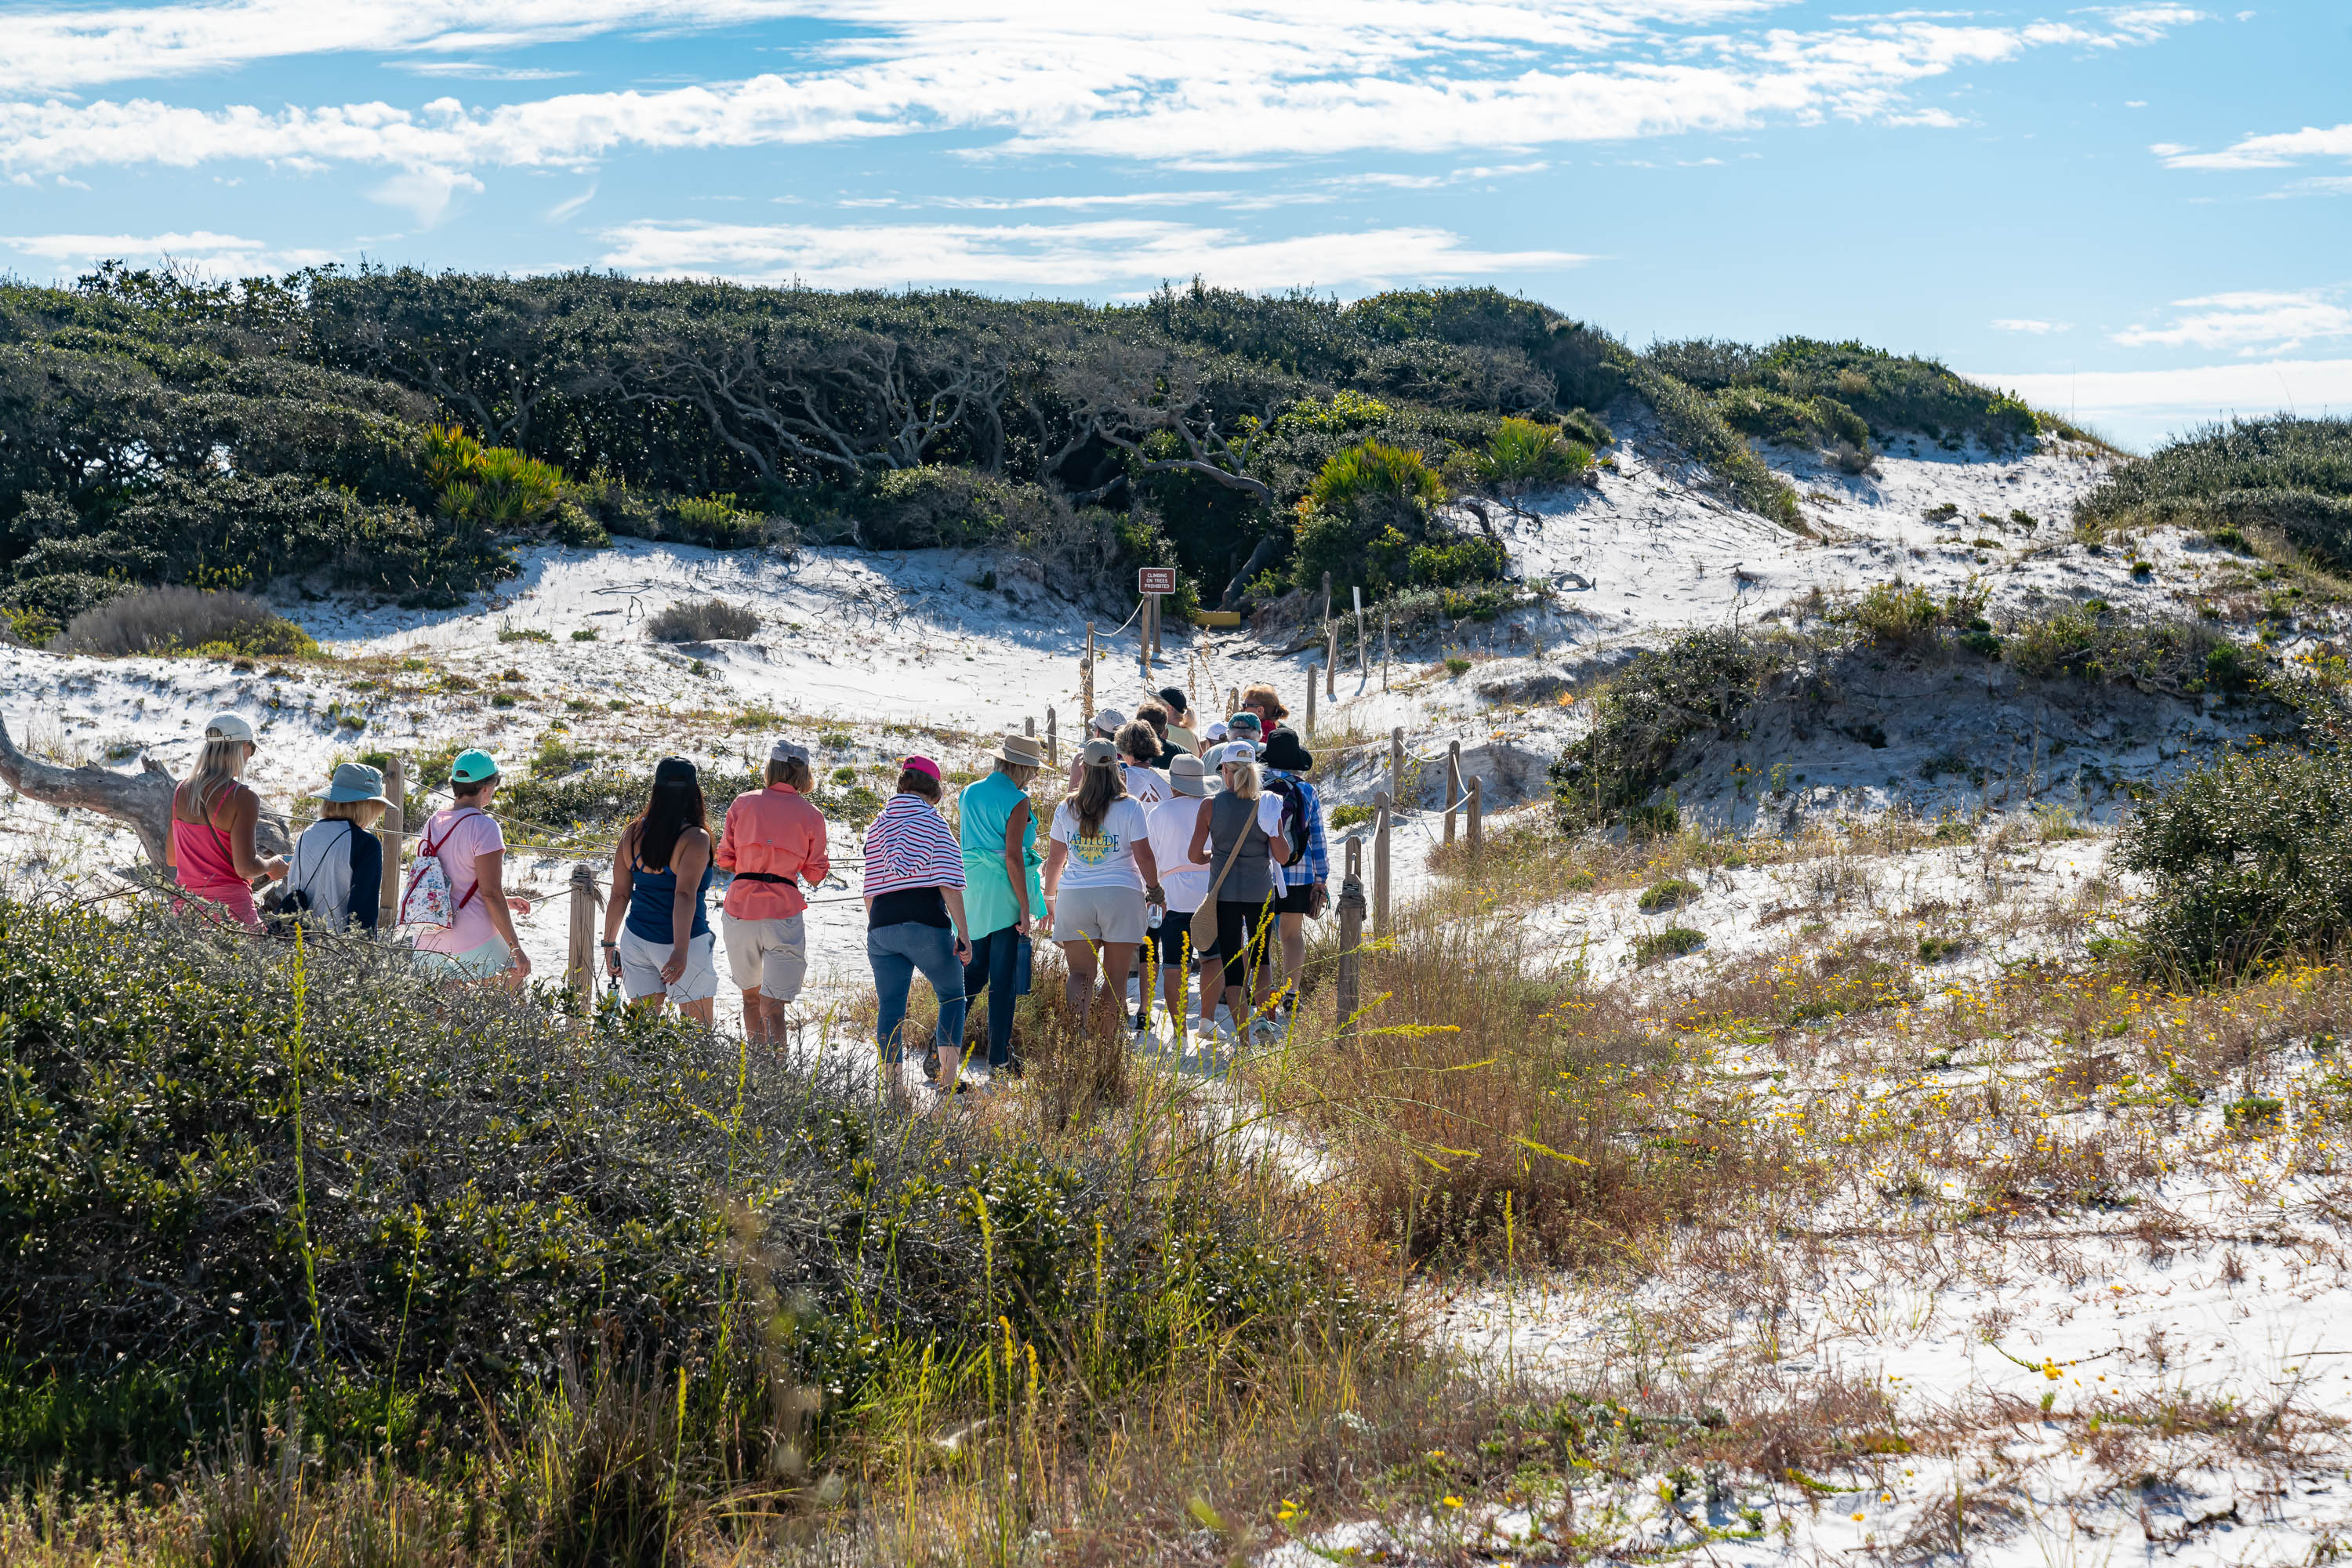
Walton County in the Florida Panhandle has 26 miles of coastline dotted with 15 named coastal dune lakes. Coastal dune lakes are technically permanent bodies of water found within 2 miles of the coast. However, the Walton County dune lakes are a unique geographical feature found only in Madagascar, Australia, New Zealand, Oregon, and here in Walton County.
What makes these lakes unique is that they have an intermittent connection with the Gulf of Mexico through an outfall where Gulf water and freshwater flow back and forth depending on rainfall, storm surge and tides. This causes the water salinity of the lakes to vary significantly from fresh to saline depending on which way the water is flowing. This diverse and distinctive environment hosts many plants and animals unique to this habitat.
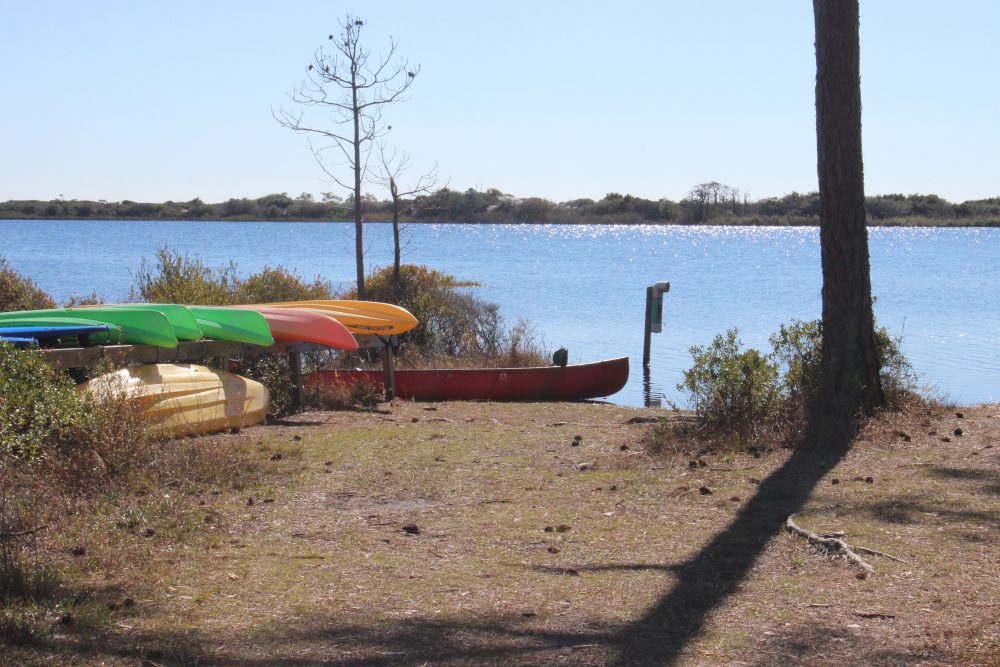
There are several ways to enjoy our Coastal Dune Lakes for recreation. Activities include stand up paddle boarding, kayaking, or canoeing on the lakes located in State Parks. The lakes are popular birding and fishing spots and some offer nearby hiking trails.
The state park provides kayaks for exploring the dune lake at Topsail. It can be reached by hiking or a tram they provide.
Walton County has a county-led program to protect our coastal dune lakes. The Coastal Dune Lakes Advisory Board meets to discuss the county’s efforts to preserve the lakes and publicize the unique biological systems the lakes provide. Each year they sponsor events during October, Dune Lake Awareness month. This year, the Walton County Extension Office is hosting a Dune Lake Tour on October 17th. Registration will be available on Eventbrite starting September 17th. You can check out the Walton County Extension Facebook page for additional information.
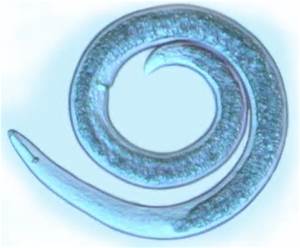
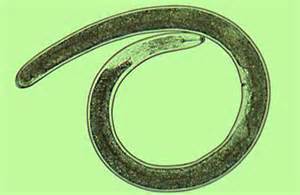
Roundworms differ from flatworms in that… well… they are round. You might recall from Part 1 of this series that flatworms were flat which helps with exchange of materials inside and out of the body. Flatworms were acoelomates – they lack an interior body cavity and thus lack internal organs. So, gas exchange (etc.) must occur through the skin. And a flat body increases the surface area in order to do this more efficiently.
A common nematode. Photo: University of Florida
But roundworms are round, which reduces this surface area and reduces the efficiency of material exchange through the skin. Though gas exchange through the skin does happen, it is not as efficient. So, there is the need for internal organs and that means there is a need for an internal body cavity to hold these organs. But with the roundworms there is only a partial cavity, not a complete one, and the term pseudocoelomate is used for them. Though the round body has adaptations to deal with gas exchange, it is a better shape for burrowing in the soil and sediment.
There are about 25,000 described species of roundworms, though some estimate there may be at least 500,000. They are placed in the Phylum Nematoda and are often called nematodes. Nematodes live within the interstitial spaces of soil, sediment, and benthic plant communities. They have been found in the polar regions, the tropics, the bottom of the sea, and in deserts – they are everywhere. They are usually in high numbers. One square meter of mud from a beach in Holland had over 4,000,000 nematodes. Scientists have estimated that an acre of farmland may have at least 1 billion of them. A decomposing apple on the ground in an orchard had about 90,000 nematodes. So, they are found everywhere and usually in great abundance. There are parasitic forms as well and they attack almost all groups of plants and animals. Food crops, livestock, and humans have made this group of nematodes a concern in our society.
Like many pseudocoelomates, nematodes have an anterior end with a mouth, but no distinct head – rather two tapered ends. Most of the free-living nematodes are less than 3mm (0.1in), but some soil nematodes can reach lengths of 7mm (0.3in) and there are marine nematodes that can reach 5cm (2in.) – it is a group of small worms.
Roundworms usually need water in order to move, even the soil species. They typically wriggle and undulate, similar to a snake, when moving and under a microscope they wriggle quite fast. In aquatic habitats they may swim for a short distance, and a few terrestrial species can crawl through dry sand.
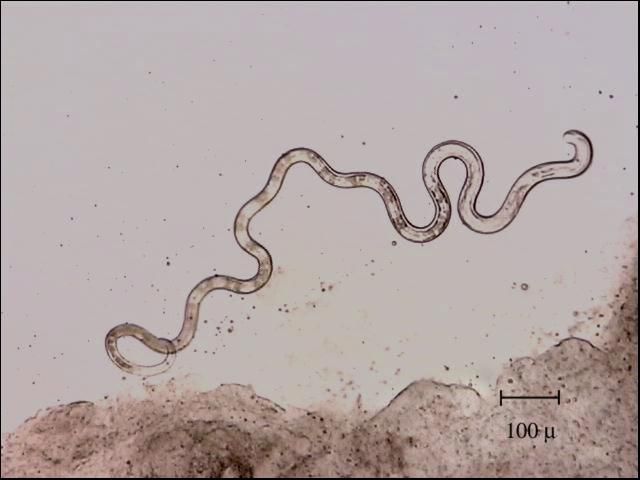
Marine Nematode – Dr. Roy P. E. Yanong, UF/IFAS Tropical Aquaculture Lab
Many free-living nematodes are carnivorous and feed on tiny animals and other nematodes. Some feed on microscopic algae and fungi. Some terrestrial species pierce the roots of plants and digest the material within. Many marine species will feed on detritus lying on the seafloor. The carnivorous species may possess small teeth, and many have a stylet they can use to pierce prey or the plant root to access food. The mouth leads to a long digestive tract and eventually an anus – nematodes have a complete digestive tract.
The brain is basically a nerve ring near the head that leads to numerous nerve chords that run the length of the body. Sensory cells are most associated with the sense of touch and smell.
Having separate sexes is the rule for nematodes, but not for all. Males are usually much smaller and usually have a hooked posterior end which they use to hold the female during mating. 50-100 eggs are usually produced and laid within the environment.
Farmers and horticulturists are familiar with these free-living nematodes, but it is the parasitic ones that are most known to the general public. There are many different forms of parasitism within nematodes. Dr. L.H. Hyman categorized them as follows:
Ectoparasites that feed on the external cells of plants – using their stylet to pierce the plant tissue and remove nutrients.
Endoparasites of plants. Juveniles of some nematodes enter plants and feed on tissue. This can cause tissue death and gall-like structures.
Some free-living nematodes, while juveniles, will enter the bodies of invertebrates and feed on the tissue when the invertebrate dies.
Endoparasites within invertebrates as juveniles, but the adult stage is free-living.
Some are plant parasites as juveniles and animal parasites as adults. The females live within the bodies of plant eating insects, where they give birth to their young. When the insects pierce the plant tissue, the juveniles enter the plant and begin feeding on it. When they mature into adults, they re-enter the insects and the cycle begins again.
Those that live within animals. The eggs, or newly hatched young, may be free-living for a short period, where they find new animal hosts, but the majority of the life cycle occurs within the animal. Many known to us infect dogs, cats, pigs, cattle, horses, chickens, fish, and humans.
Heartworms, pinworms, and hook worms are names you may have heard. For dog nematodes, the eggs are released into the environment by the dog’s feces. Another dog eats this feces and becomes infected.
The nematode known as Ascaris lumbricoides is the most common parasitic worm in humans. It has been estimated that almost 1 billion people are infected with it. Female Ascaris release developing eggs into the environment via human feces. Other humans become infected after swallowing food or water containing the eggs. Once inside the human, the eggs hatch and penetrate the tissue moving into the heart and eventually the lungs. From here they crawl up the trachea inducing a coughing response which is followed by a swallowing response that moves the developing juvenile worm into the esophagus and eventually back to the intestines where the cycle begins again. Infections of this worm are more common where sanitation systems are not adequate and/or human feces are used as a fertilizer.
Hookworms are another human parasite that feed on blood and can cause serious infections in humans due to blood and tissue loss. Fertilized eggs of this worm are laid in the environment and re-enter new human host as developing juveniles by penetrating their skin. Once in the new host the developing worms are carried to the lungs via the circulatory system and work their way into the pharynx, are swallowed, and eventually end up in the intestine. Not all hookworm juveniles penetrate through the skin but rather enter the body when the person unknowingly consumes human feces. This can happen from not washing your hands or food (if human waste is used as fertilizer). Pinworms and whipworms are other nematodes that have similar life cycles. In Asia there are some nematodes that are passed to humans by biting insects.
The roundworm known as the nematode is a common issue for farmers, horticulturists, and as a parasite in some parts of the world. Their lifestyles, while being a potential problem for us, have been very successful for them. In the next edition in this series, we will learn more about the most advanced worms on our planet – the segmented worms. We will begin with the polychaetes.
References
Barnes, R.D. (1980). Invertebrate Zoology. Saunders Publishing. Philadelphia PA. pp. 1089.
There was, is, and will be the same amount of water on planet Earth. Water is a finite resource. The United States Geologic Survey estimates Earth holds around 1,386,000,000 cubic kilometers of water. Only 330,520 cubic kilometers, less than 1% of all water on Earth, is freshwater. This freshwater is available in the soils, atmosphere, biosphere and used by humans.
We all have different connections with water. Maybe it is swimming. Maybe it is enjoyment of clean laundry. Maybe it is the iconic scenes in the 1992 Academy Award for Best Cinematography, A River Runs Through It. Yet, we all depend on water for life. How and why water moves across a landscape to sustain life is important to us all.
Watersheds in the Continental United States (usgs.gov)
Water located on land is called surface water. Water located underground is called groundwater. A watershed is the area of land where surface water and groundwater drain to a common place. Watersheds vary in size from as small as the size of your foot to as large as the watersheds spanning the continental United States. Larger watersheds are composed of smaller watersheds linked together.
Water gradually flows from higher to lower points in a watershed. Precipitation (i.e., snow, rain and everything in between) collects and moves within the drainage area in the watershed. Not all precipitation falling on a watershed flows out of the watershed. Precipitation soaks into the soil and through porous rock moving to lower points in the watershed, returning to and replenishing water stored underground. This groundwater can return to the surface of the watershed via springs or artesian wells, if the groundwater is under enough pressure.
Water can be removed before flowing out of the watershed as well. Precipitation returns to the atmosphere through evaporation as part of the hydrologic cycle. Plants facilitate evaporation to the atmosphere through transpiration where the roots of plants absorb water from the soil and the water evaporates into the air through the leaves of the plants. Human uses of water also impact how water moves through a watershed. Drinking water supplies, industrial operations, or building dams changes the movement of water through the watershed.
Each of us lives in a watershed. There is much benefit to have healthy watersheds. Healthy watersheds are essential to support ecosystems and the services provided, such as safe drinking water, outdoor recreation, economics, and overall quality of life. There are many metrics and assessments used to measure the health of a watershed. Do you know what is the health of your watershed?
United States Environmental Protection Agency’s How’s My Watershed interactive tool (http://mywaterway.epa.gov)
The United States Environmental Protection Agency developed “How’s My Waterway” to provide the public with information about the condition of their local waters. How’s My Waterway offers three ways to explore your watershed. At the community level, you can see your watershed with details like the water quality, recreation, fish consumption, impairments, and associated plans working to remove impairments. At the state and national levels, you can find information about states/national water program(s) and specific water assessment(s) that affect your watershed.
Example–watershed for Okaloosa County UF/IFAS Extension North office.
Let’s give it a try! Go to www.mywaterway.epa.gov in your web browser. Enter the desired address and select >>Go. On the left, you’ll see an interactive map outlining your watershed and the drainage basin(s) that make up the watershed. On the right, there are 10 different tabs allowing you to explore various metrics of the watershed. For example, there is a general tab reviewing the water conditions and states (i.e., good, impaired, or condition unknown) for all surface waters in the watershed. Using the arrow on the right, you can expand each water source to learn specifics about the data-determined state of the water.
Enjoy exploring your watershed! If you have questions about the interactive “How’s My Waterway,” wish to join an educational session to learn more, and/or desire accompanying curriculum, please email Dana Stephens at dlbigham@ufl.edu.
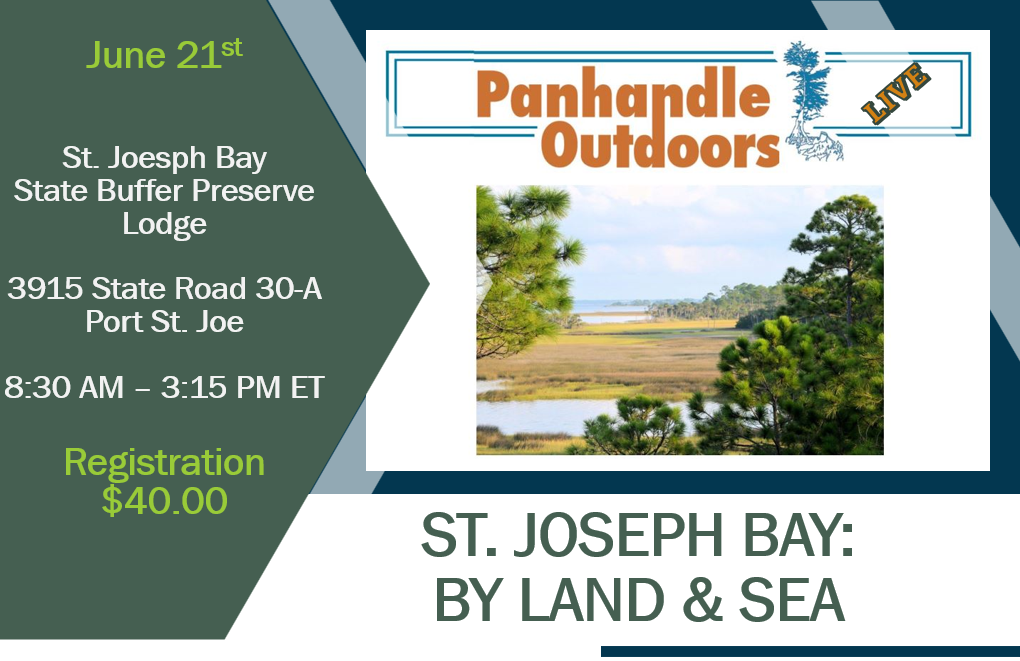
The University of Florida/IFAS Extension & Florida Sea Grant faculty are reintroducing their acclaimed “Panhandle Outdoors LIVE!” series on St. Joseph Bay. This ecosystem is home to some of the richest concentrations of flora and fauna on the Northern Gulf Coast. This area supports an amazing diversity of fish, aquatic invertebrates, turtles and other species of the marsh and pine flatwoods. Come learn about the important roles of ecosystem!
Registration fee is $40. You must pre-register to attend.
Understanding Salinity in Northwest Florida’s Waters with a Family Activity
Dana Stephens, 4-H Agent
Salinity is the amount of total dissolved salts in water. This includes all salts not just sodium chloride, or table salt. Salinity is important in aquatic environments as many flora and fauna depend on salt and the level of dissolved salts in the water for survival. People interested in the composition of water frequently measure chemical and physical components of water. Salinity is one of the vital chemical components measured and often measured by a device determining how readily electrical conductance passes between two metal plates or electrodes. These units of electrical conductance, the estimate of total dissolved salts in water, is described in units of measurement of parts per thousand (PPT).
At the large scale, Earth processes, such as weathering of rocks, evaporation of ocean waters, and ice formation in the ocean, add salt to the aquatic environment. Earth processes, such as freshwater input from rivers, rain and snow precipitation, and ice melting, decrease the concentration of salt in the aquatic environment. Anthropogenic (human-induced) activities, such as urbanization or atmospheric deposition, can also contribute to changes in salinity.
Salinity and changes in salinity affect how water moves on Earth due to contrasts in the density of water. Water containing no dissolved salts is less dense than water containing dissolved salts. Density is weight per volume, so water with no dissolved salts (less dense) will float on top of water with dissolved salts (denser). This is why swimming in the ocean may feel easier than swimming in a lake because the denser water provides increased buoyancy.
Northwest Florida is a unique place because we have a variety of surface waters that range in salinity. There are ponds, lakes, streams, rivers, and springs, which have no to low salinity levels (0 to 0.5 PPT), and commonly referred to as freshwater systems. We house six estuaries—Perdido Bay, Pensacola/Escambia Bay, Choctawhatchee Bay, St. Andrews Bay, St. Joseph Bay, and Apalachicola Bay. Estuaries are bodies of water with freshwater input(s) (e.g., rivers) and a permanent opening to the ocean (e.g., Destin Pass in the Choctawhatchee Bay). Estuarine waters are termed brackish water (0.5 to 30 PPT) due to the dynamic changes in salinity at spatial and temporal scales. Waterbodies with an even more dynamic change in salinity are the coastal dune lakes Northwest Florida’s Walton and Bay Counties. Coastal dune lakes are waterbodies perched on sand dunes that intermittently open and close to the Gulf of Mexico. Sometimes these waterbodies are fresh and sometimes they have the same salinity as the Gulf of Mexico, like after a large storm event. Finally, the Gulf of Mexico, or ocean, has the highest salinity (> 30 PPT) among the waterbodies of Northwest Florida.
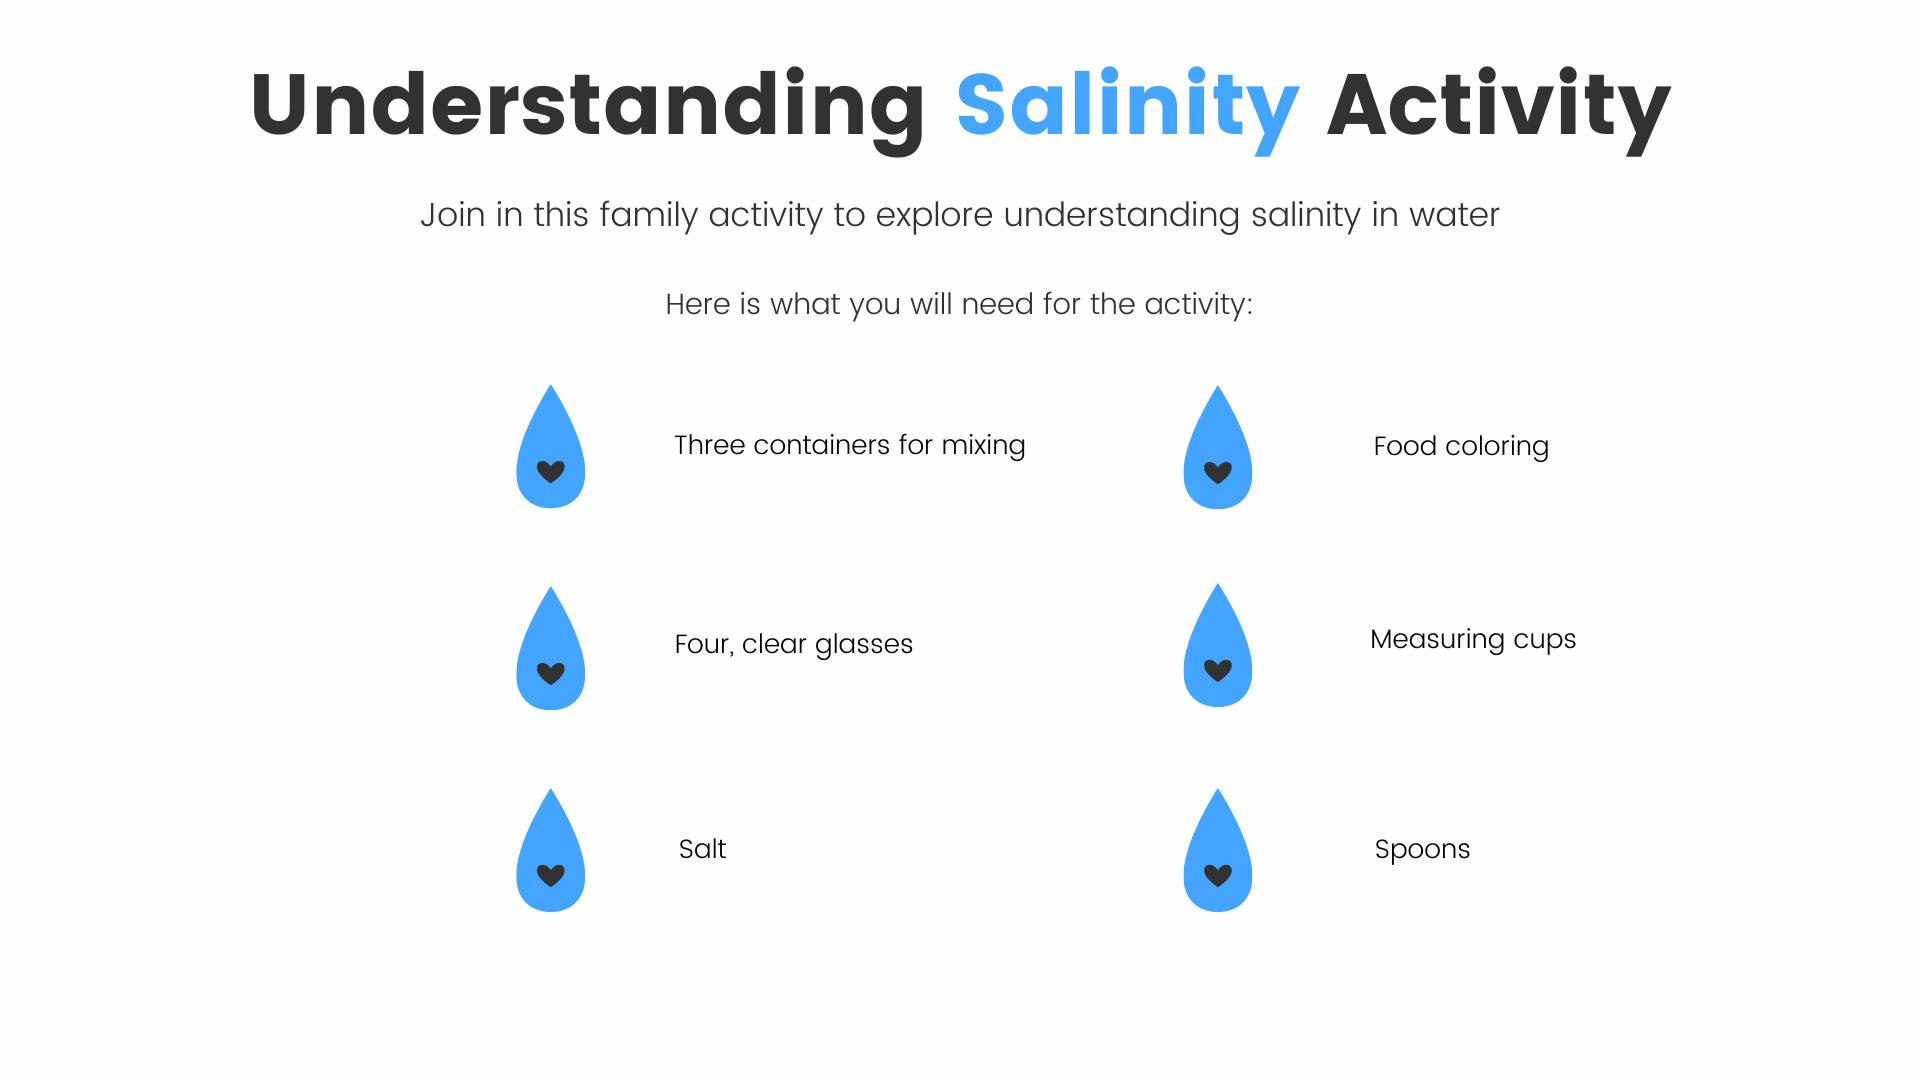
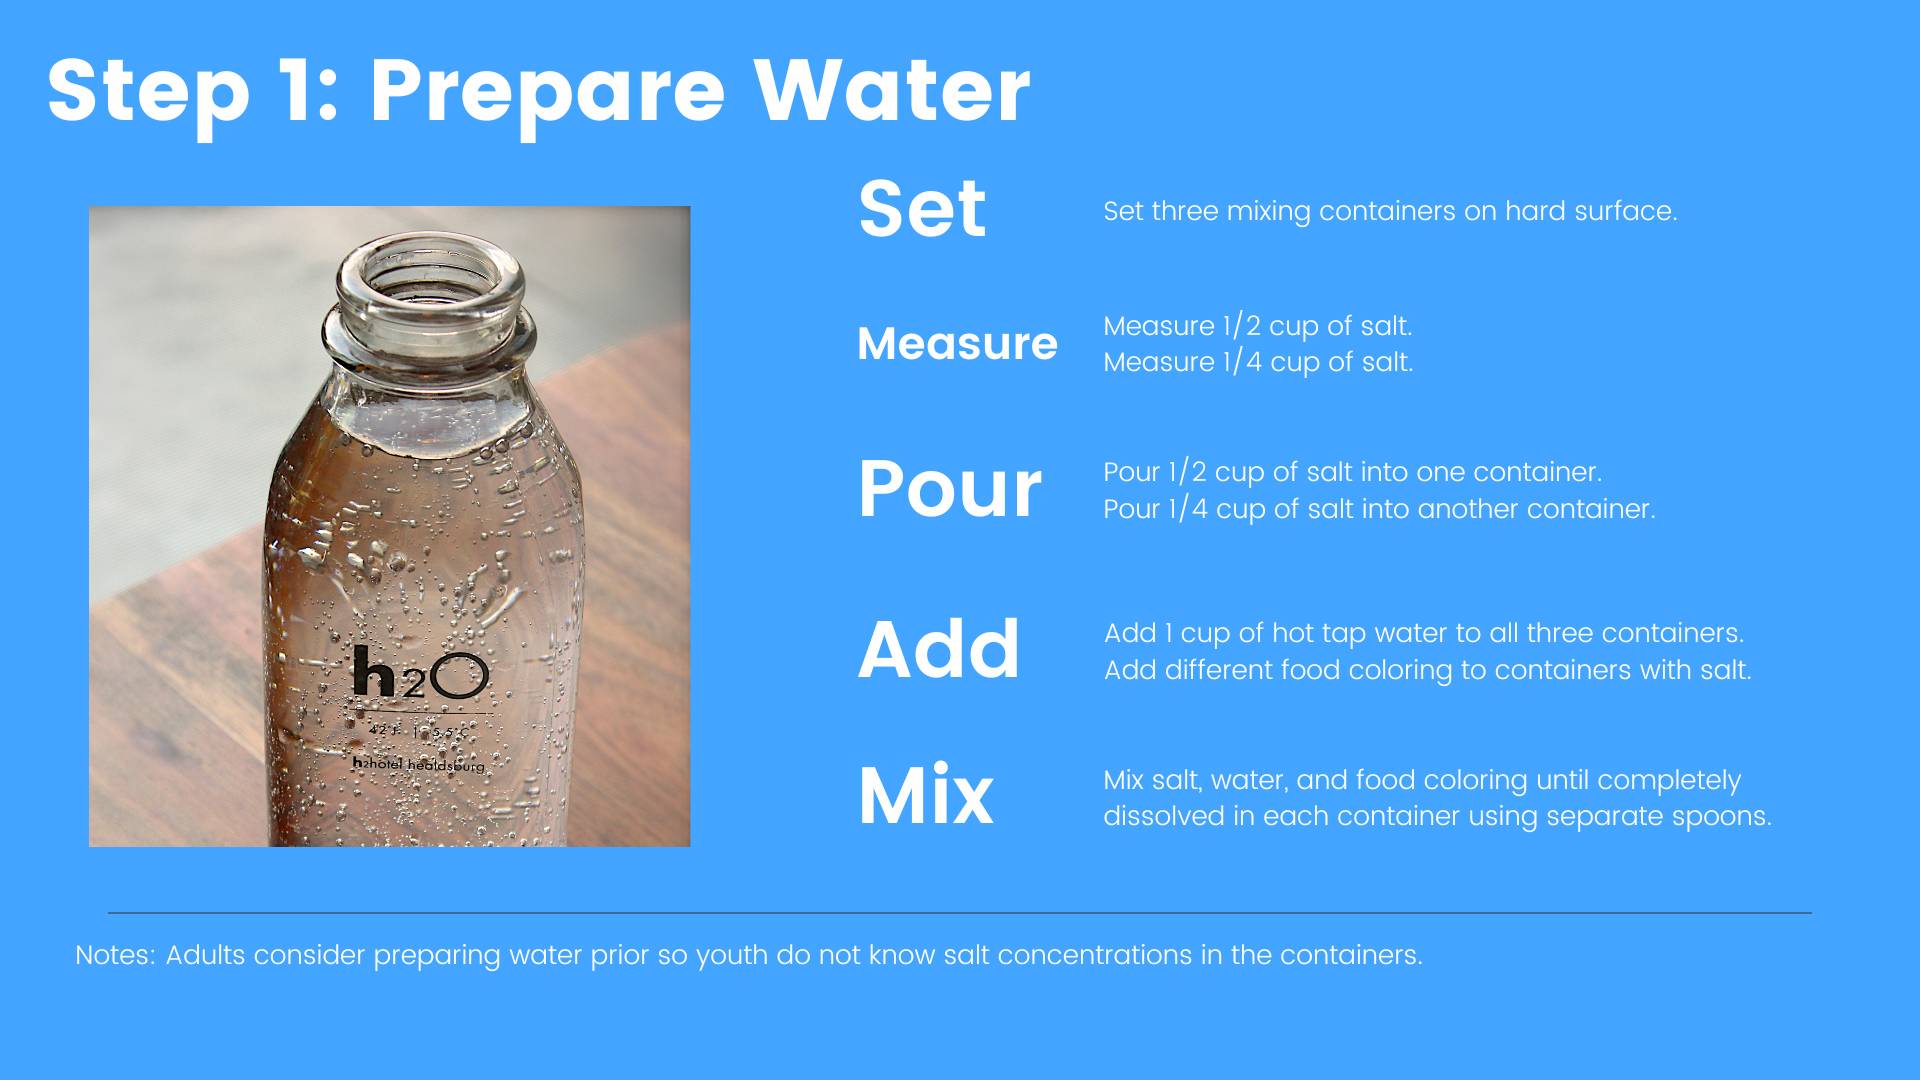
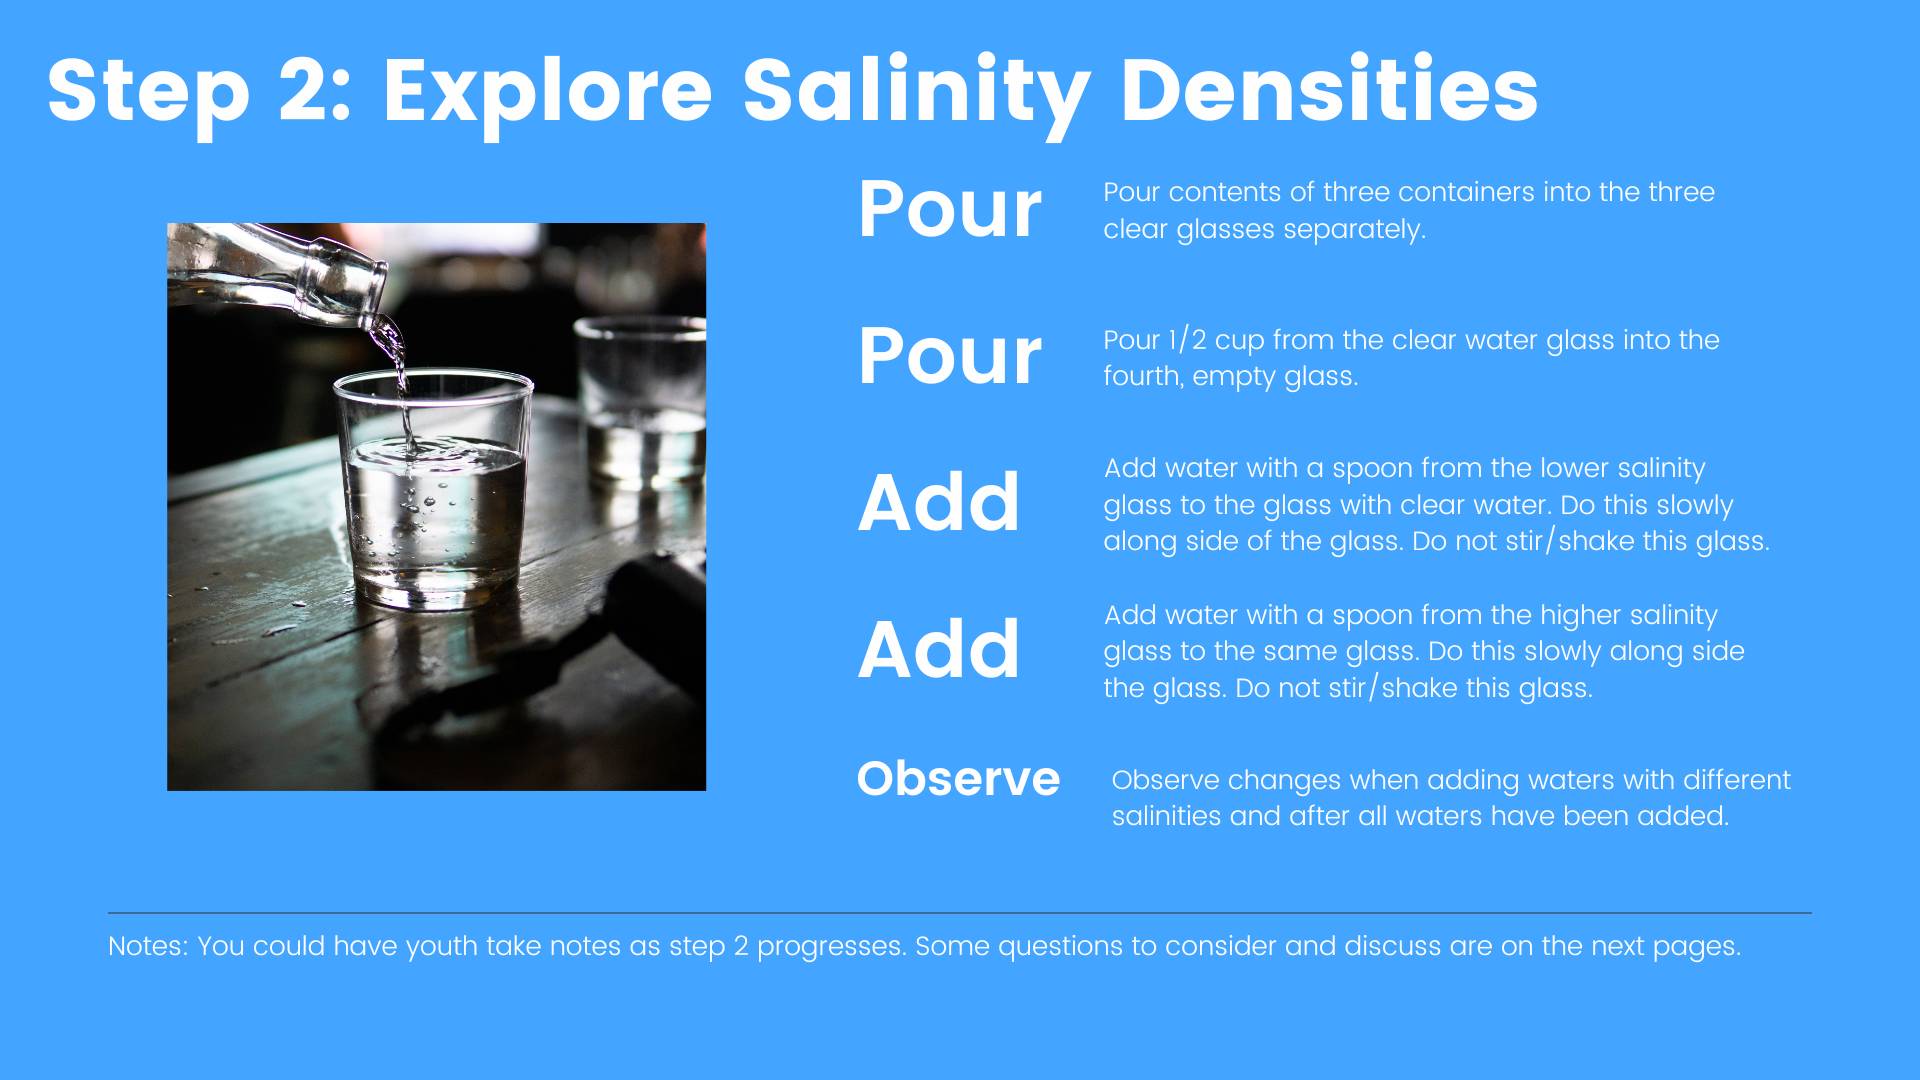
Here is an educational activity for the family to explore salinity and how salinity differs among Northwest Florida waters.
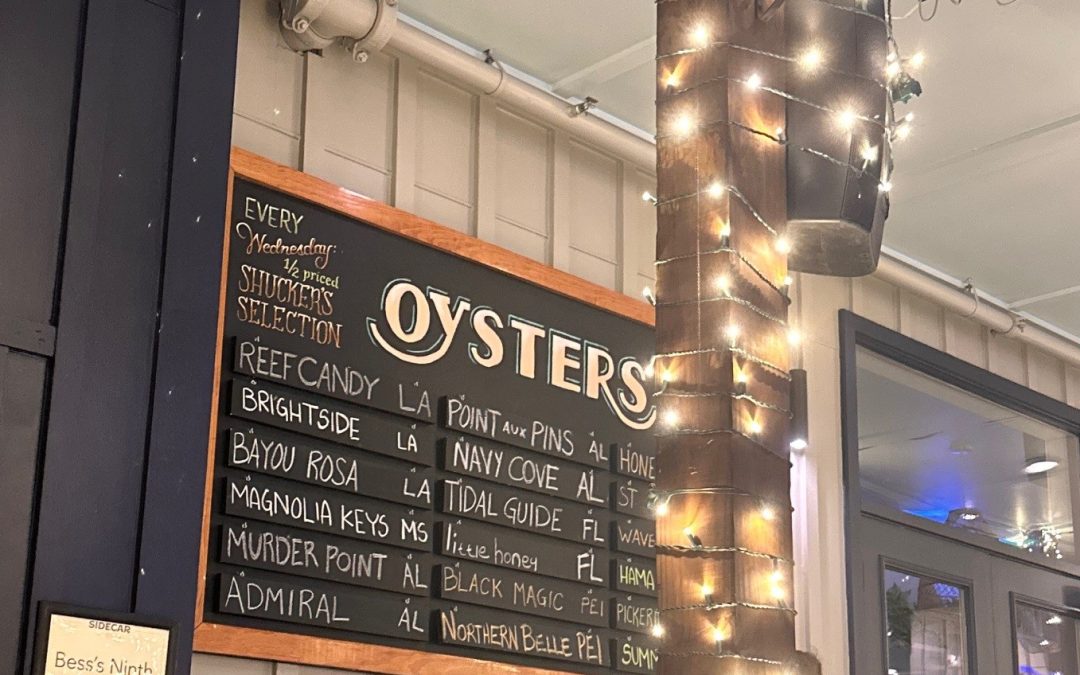
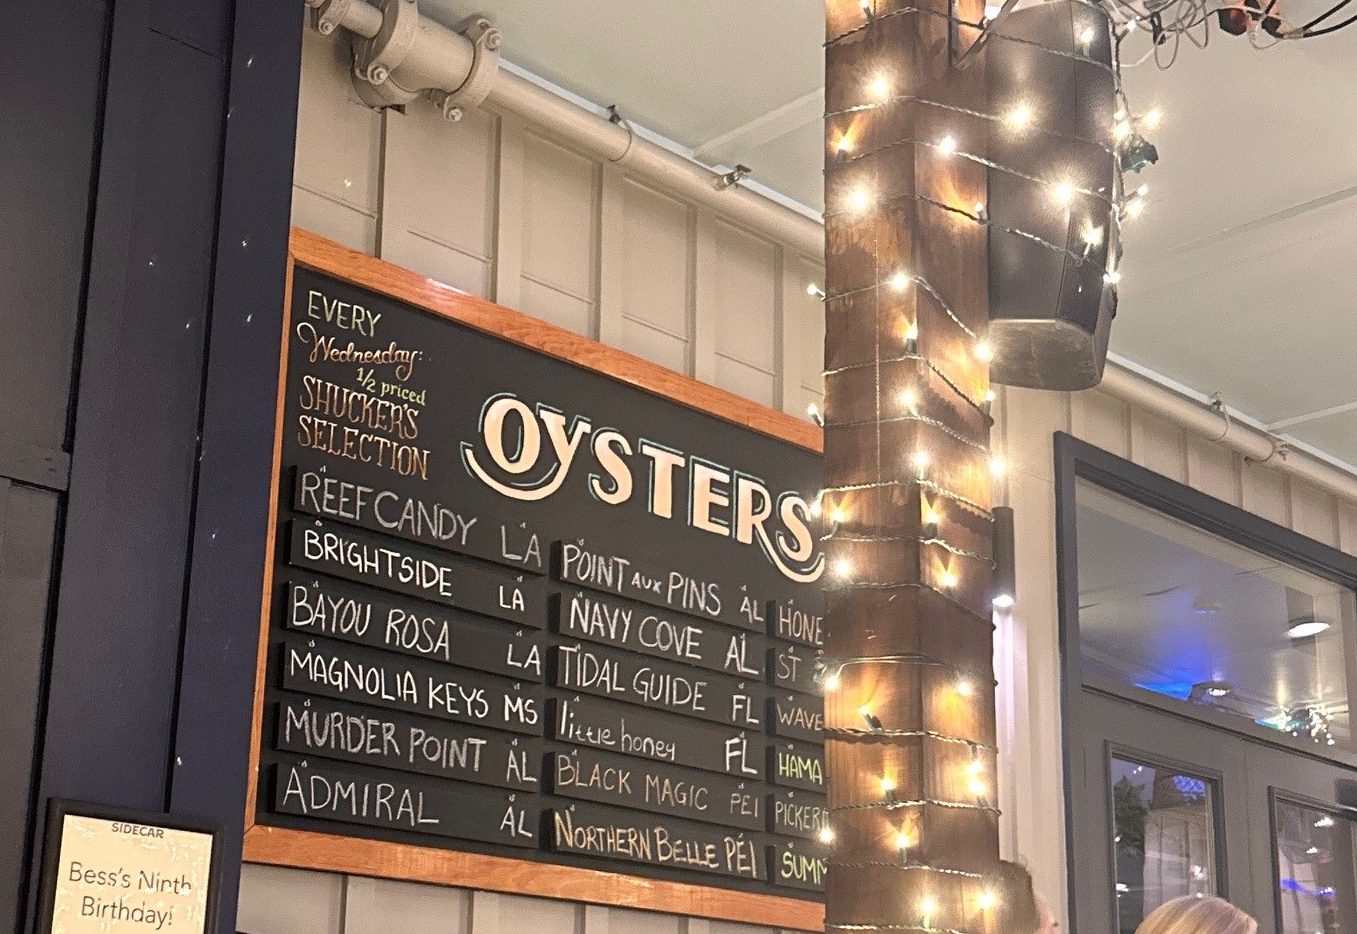
This year, the non-profit organization Oyster South held their annual Oyster South Symposium in the Big Easy, aka New Orleans. First stop was the Director’s Welcome at Sidecar Patio and Oyster Bar Thursday night. Oyster farmers, researchers, distributors, educators, writers and fans from all over USA were treated to New Orleans favorites like red beans and rice and jambalaya, but the star of the party was inside the bar area underneath a disco ball oyster. I wish I had taken a picture, but the lure of oysters from the Gulf, East, and West Coasts held my attention. Being able to jump coasts from oyster to oyster was quite an experience, and to have them freshly shucked right in front of you with a knowledgeable shucker took it over the top.
An Awesome Oyster Bar Selection at Sidecar Patio and Oyster Bar – Thomas Derbes
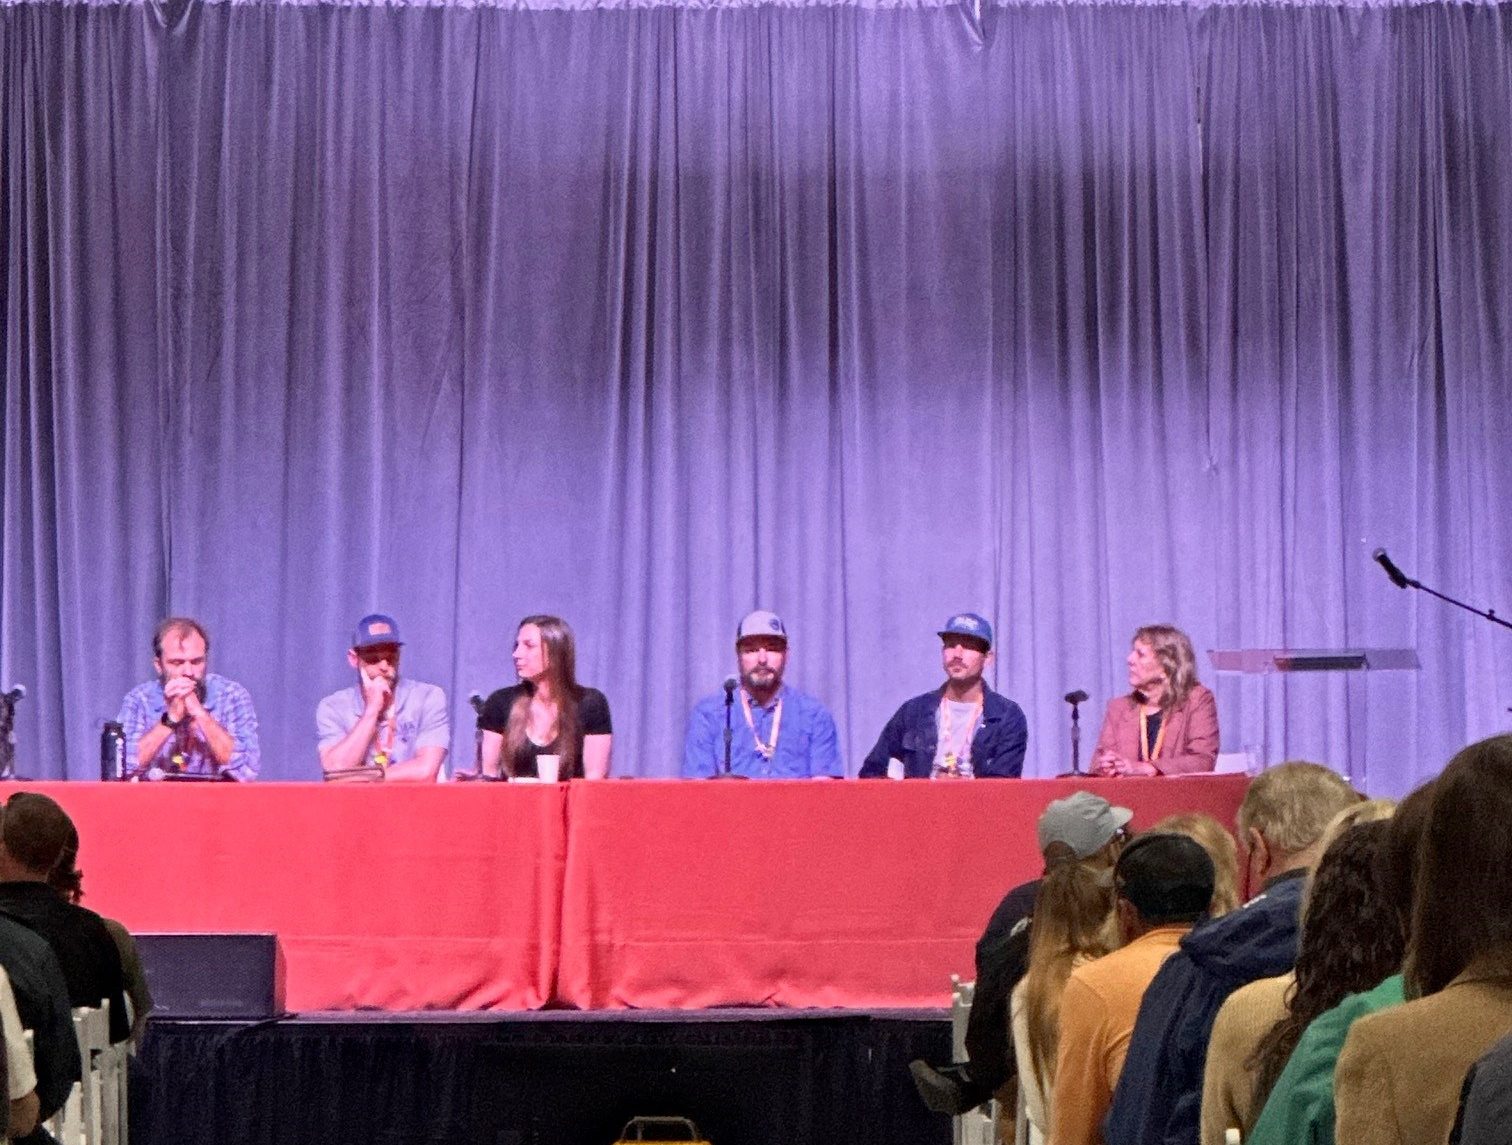
Friday we were greeted with gray skies, but you couldn’t tell from the vibe inside of the Contemporary Arts Center. When you walked in, you were immediately introduced to the trade show wall to wall with oyster equipment and other oyster related things. Once through the trade show, you could take a seat and listen to a plethora of oyster talks. We listened to reports of oyster mortality and the intensive efforts being taken to address this issue, a panel of farmers discussing how their peers can get an alternative source of income from catering and tours, oyster hatchery and farm research updates, and stories of oyster farmers and chefs on what an oyster means to them. The future of oyster farming looks very bright, and researchers are doing great things to help build the strength and resiliency of oyster farming. After the talks, we visited the trade show again and caught up with friends, old and new.
Distinguished Panel of Oyster Farmers Discussing Alternate Income Opportunities – Thomas Derbes
Tomorrow brings more talks, and the amazing Shuck and Tell closing ceremonies. Stay tuned for a Part 2 and Overall Thoughts.