by Thomas Derbes II | Dec 8, 2025
Aquaculture in North and South Carolina
North and South Carolina are next on our tour of aquaculture in the southern United States, and while they’re neighbors, their aquaculture stories couldn’t be more different. North Carolina is the undisputed trout powerhouse of the South, while South Carolina is just starting to reel in momentum of its own. From mountain streams to coastal waters, these bordering states offer two distinct climates, ecosystems, and approaches to aquaculture. Let’s take a closer look at how each one makes waves.
North Carolina
North Carolina’s aquaculture sector is a vital component of the state’s agricultural and coastal economies. The industry encompasses both freshwater and marine operations, ranging from small family-owned farms to larger commercial enterprises. North Carolina’s diverse climate and water resources support a variety of aquaculture activities, including food fish production, shellfish farming, and ornamental species cultivation.
Besides the typical aquacultured finfish species (catfish, tilapia, and hybrid striped bass), North Carolina is a leader in Rainbow Trout (Oncorhynchus mykiss) aquaculture in the South. Rainbow trout farms are found primarily in the western mountainous region of North Carolina, allowing farmers easy access to very cold, clean water. Rainbow trout are typically raised in a flow-through raceway system. A flow-through raceway aquaculture system is a setup where fresh, oxygen-rich water continuously flows through long, narrow tanks (raceways) that hold the fish. One interesting statistic is that even though 13 farms left the industry, the value of the crop increased (see chart below).
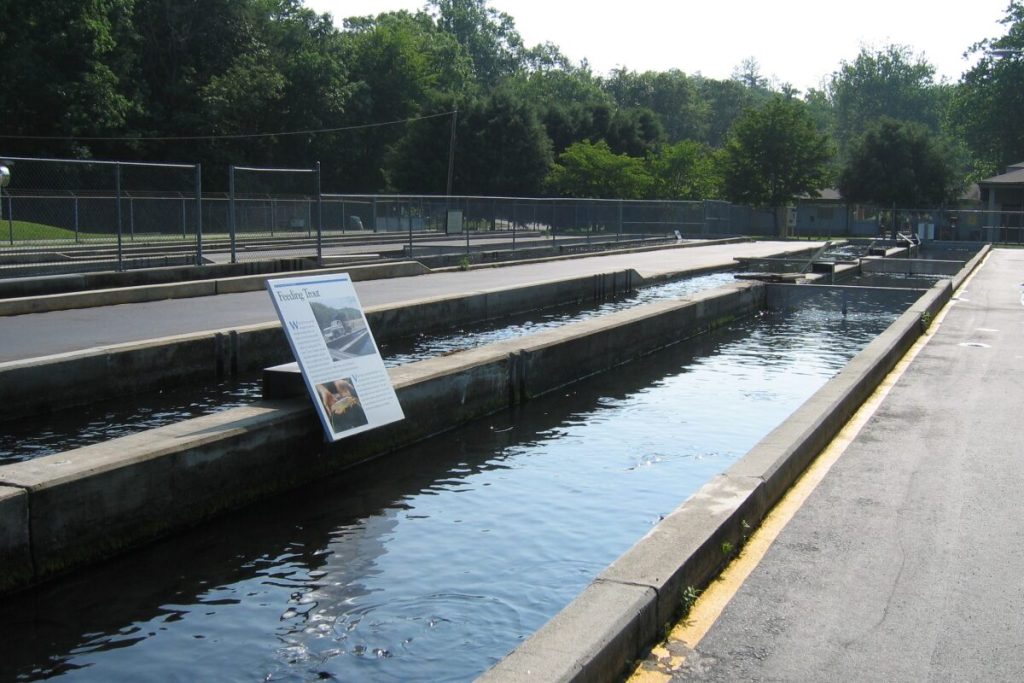
Bobby N. Setzer State Fish Hatchery – Carolina Outdoor Guide
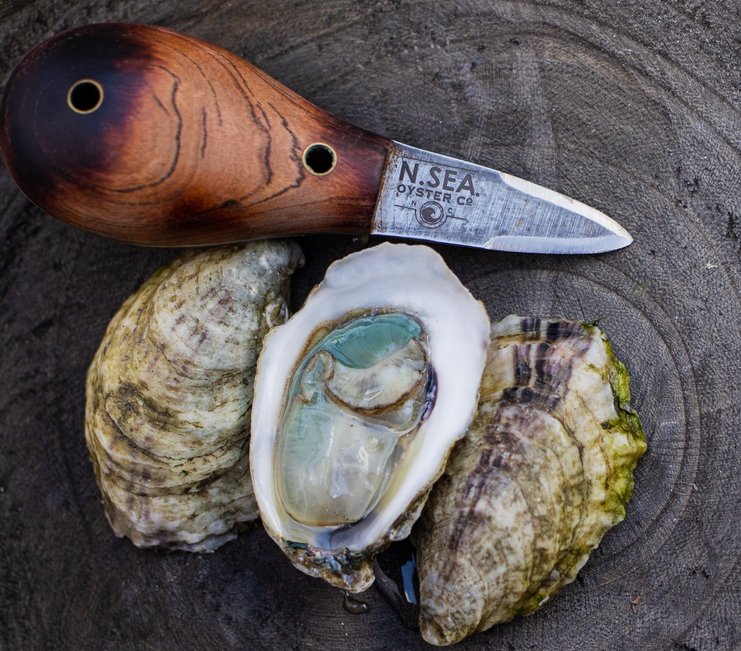
North Carolina also has an up-and-coming Eastern Oyster (Crassostrea virginica) aquaculture industry. N. Sea. Oyster Company is an oyster farm located in the beautiful waters of Topsail Sound. One of their claims to fame is their “Divine Pines of Topsail Sound.” These oysters are a rare delicacy that can only be found in certain parts of the world during a certain time of the year. The gills of the oyster become bright green due to the presence of a blue-green diatom in the water that the oyster consumes, and the taste changes as well (Green Gilled Oysters).
North Carolina is supported by several key institutions advancing aquaculture research, education, and industry development. North Carolina State University (NCSU) leads studies in fish health, nutrition, and production, while the University of North Carolina Wilmington (UNCW) contributes expertise in marine aquaculture, shellfish biology, and coastal ecosystem management. North Carolina Sea Grant complements these efforts by providing research, education, and outreach focused on aquaculture innovation, sustainability, and business development, and the North Carolina Department of Agriculture and Consumer Services supports industry growth and regulatory compliance through its Aquaculture Division.
| North Carolina Aquaculture |
| Category |
2017 Farms |
2017 Value* |
2023 Farms |
2023 Value* |
+/- Farms |
+/- Value |
| Catfish |
31 |
$4,462 |
16 |
$2,031 |
-15 |
-$2,431 |
| Trout |
49 |
$11,753 |
36 |
$13,186 |
-13 |
$1,433 |
| Other Food Fish |
29 |
$11,323 |
32 |
$11,296 |
3 |
-$27 |
| Baitfish |
6 |
$159 |
6 |
$24 |
0 |
-$135 |
| Crustaceans |
8 |
$112 |
8 |
$37 |
0 |
-$75 |
| Mollusks |
38 |
$1,568 |
45 |
$2,278 |
7 |
$710 |
| Ornamental Fish |
25 |
$112 |
9 |
$76 |
-16 |
-$36 |
| Sport/Gamefish |
18 |
$1,004 |
15 |
$3,199 |
-3 |
$2,195 |
| Other Aquaculture |
7 |
$454 |
2 |
(D) |
-5 |
– |
| Total |
211 |
$30,947 |
169 |
$32,127 |
-42 |
$1,180 |
*= x 1,000
South Carolina
South Carolina’s aquaculture industry is characterized by its strong emphasis on marine and coastal species, as well as a growing interest in freshwater production. The state’s favorable climate, extensive coastline, and estuarine environments provide ideal conditions for shellfish and finfish farming. Aquaculture contributes to seafood supply, recreational fisheries, and environmental restoration efforts.
Shellfish and shrimp aquaculture are the flagship species for South Carolina. White Shrimp (Litopenaeus setiferus) aquaculture has been an emerging species and is typically farmed in low salinity, inland ponds. These shrimp grow fast and can reach harvest size in 4-6 months in ideal conditions. On the shellfish side, Eastern Oysters and clams (Mercenaria mercenaria) are the top farmed species in the state. Oyster farming is central to both commercial and restoration activities in South Carolina, while the clam industry supports both local and non-local seafood markets.
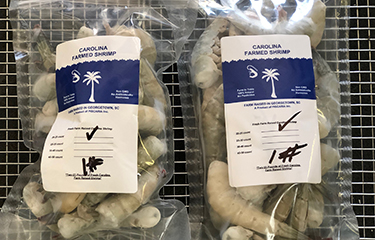
Farmed South Carolina Shrimp – Seafood Source
As with most states in the South, South Carolina has a finfish aquaculture sector, specializing in Channel Catfish (Ictalurus punctatus) and Hybrid Striped Bass (Morone chrysops x Morone saxatilis). Both species are usually grown in inland ponds and are used for the commercial food industry and the sportfish industry (pond stocking).
South Carolina’s aquaculture efforts are supported by several key institutions. Clemson University conducts research on fish health, production technologies, and environmental interactions through its Aquaculture and Fisheries Program, while the South Carolina Department of Natural Resources supports shellfish restoration, stock enhancement, and aquaculture development via its Marine Resources Division. The University of South Carolina contributes research focused on water quality and marine organism biology, and the South Carolina Sea Grant Consortium strengthens the industry through research, outreach, and workforce development.
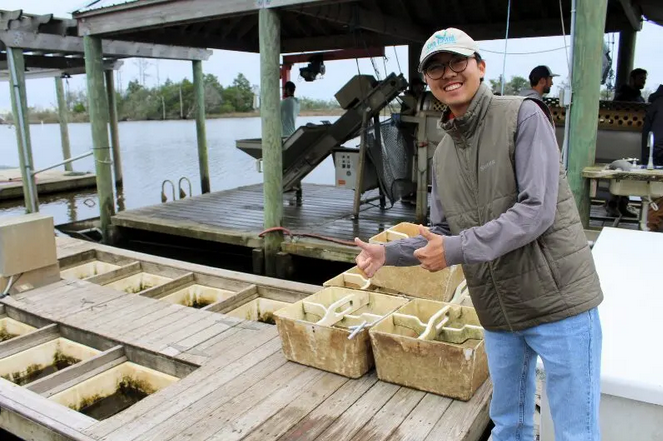
Sea Grant Agent Joshua Kim on a Floating Upweller System (FLUPSY) – SC Sea Grant
| South Carolina Aquaculture |
| Category |
2017 Farms |
2017 Value* |
2023 Farms |
2023 Value* |
+/- Farms |
+/- Value |
| Catfish |
10 |
(D) |
8 |
$292 |
-2 |
– |
| Trout |
1 |
(D) |
5 |
(D) |
4 |
– |
| Other Food Fish |
9 |
(D) |
6 |
$3 |
-3 |
– |
| Baitfish |
1 |
(D) |
5 |
$1 |
4 |
– |
| Crustaceans |
16 |
$616 |
9 |
$101 |
-7 |
-$515 |
| Mollusks |
15 |
$2,525 |
16 |
$29,613 |
1 |
$27,088 |
| Ornamental Fish |
4 |
(D) |
6 |
$161 |
2 |
– |
| Sport/Gamefish |
16 |
$1,296 |
21 |
$3,137 |
5 |
$1,841 |
| Other Aquaculture |
2 |
(D) |
0 |
$0 |
-2 |
– |
| Total |
74 |
$4,437 |
76 |
$33,308 |
2 |
$28,871 |
* = x1,000
Conclusion
Aquaculture in North Carolina and South Carolina exhibits distinct strengths shaped by regional resources, species diversity, and institutional support. North Carolina’s industry leans toward freshwater and hybrid species, while South Carolina excels in marine and shellfish aquaculture. Both states benefit from active research institutions that drive innovation, sustainability, and economic growth in the sector. Continued collaboration and investment in research will be key to advancing aquaculture across the Carolinas.
Next Up – Tennessee and Texas!
References:
North Carolina Aquaculture Census
South Carolina Aquaculture Census
by Rick O'Connor | Sep 22, 2025
Introduction
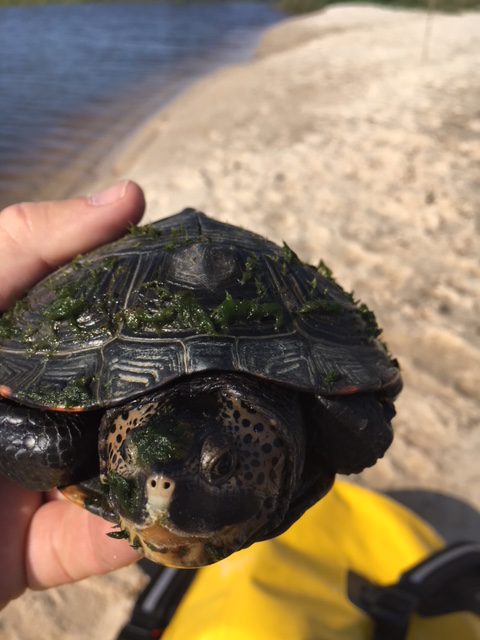
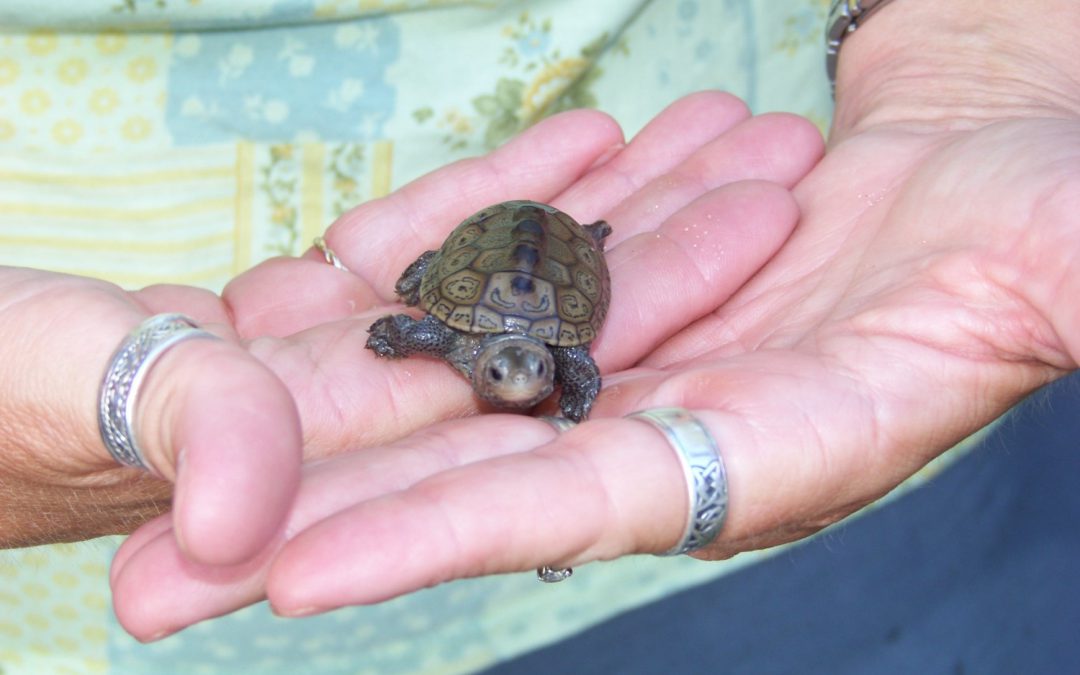
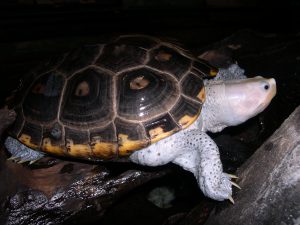
The diamondback terrapin (Malaclemys terrapin) is the only resident turtle within brackish water and estuarine systems in the United States (Fig. 1). They prefer coastal estuarine wetlands – living in salt marshes, mangroves, and seagrass communities. The literature suggests they have strong site fidelity – meaning they do not move far from where they live. Within their habitat they feed on shellfish, mollusk and crustaceans mostly. In early spring they will breed. Gravid females will venture along the shores of the bay seeking a high-dry sandy beach where they will lay a clutch of about 10 eggs. She will typically return to lay more than one clutch each season. Nesting will continue through the summer. Hatching begins mid-summer and will extend into the fall. Hatchings that occur in late fall may overwinter within the nest and emerge the following spring. They live 20-25 years.
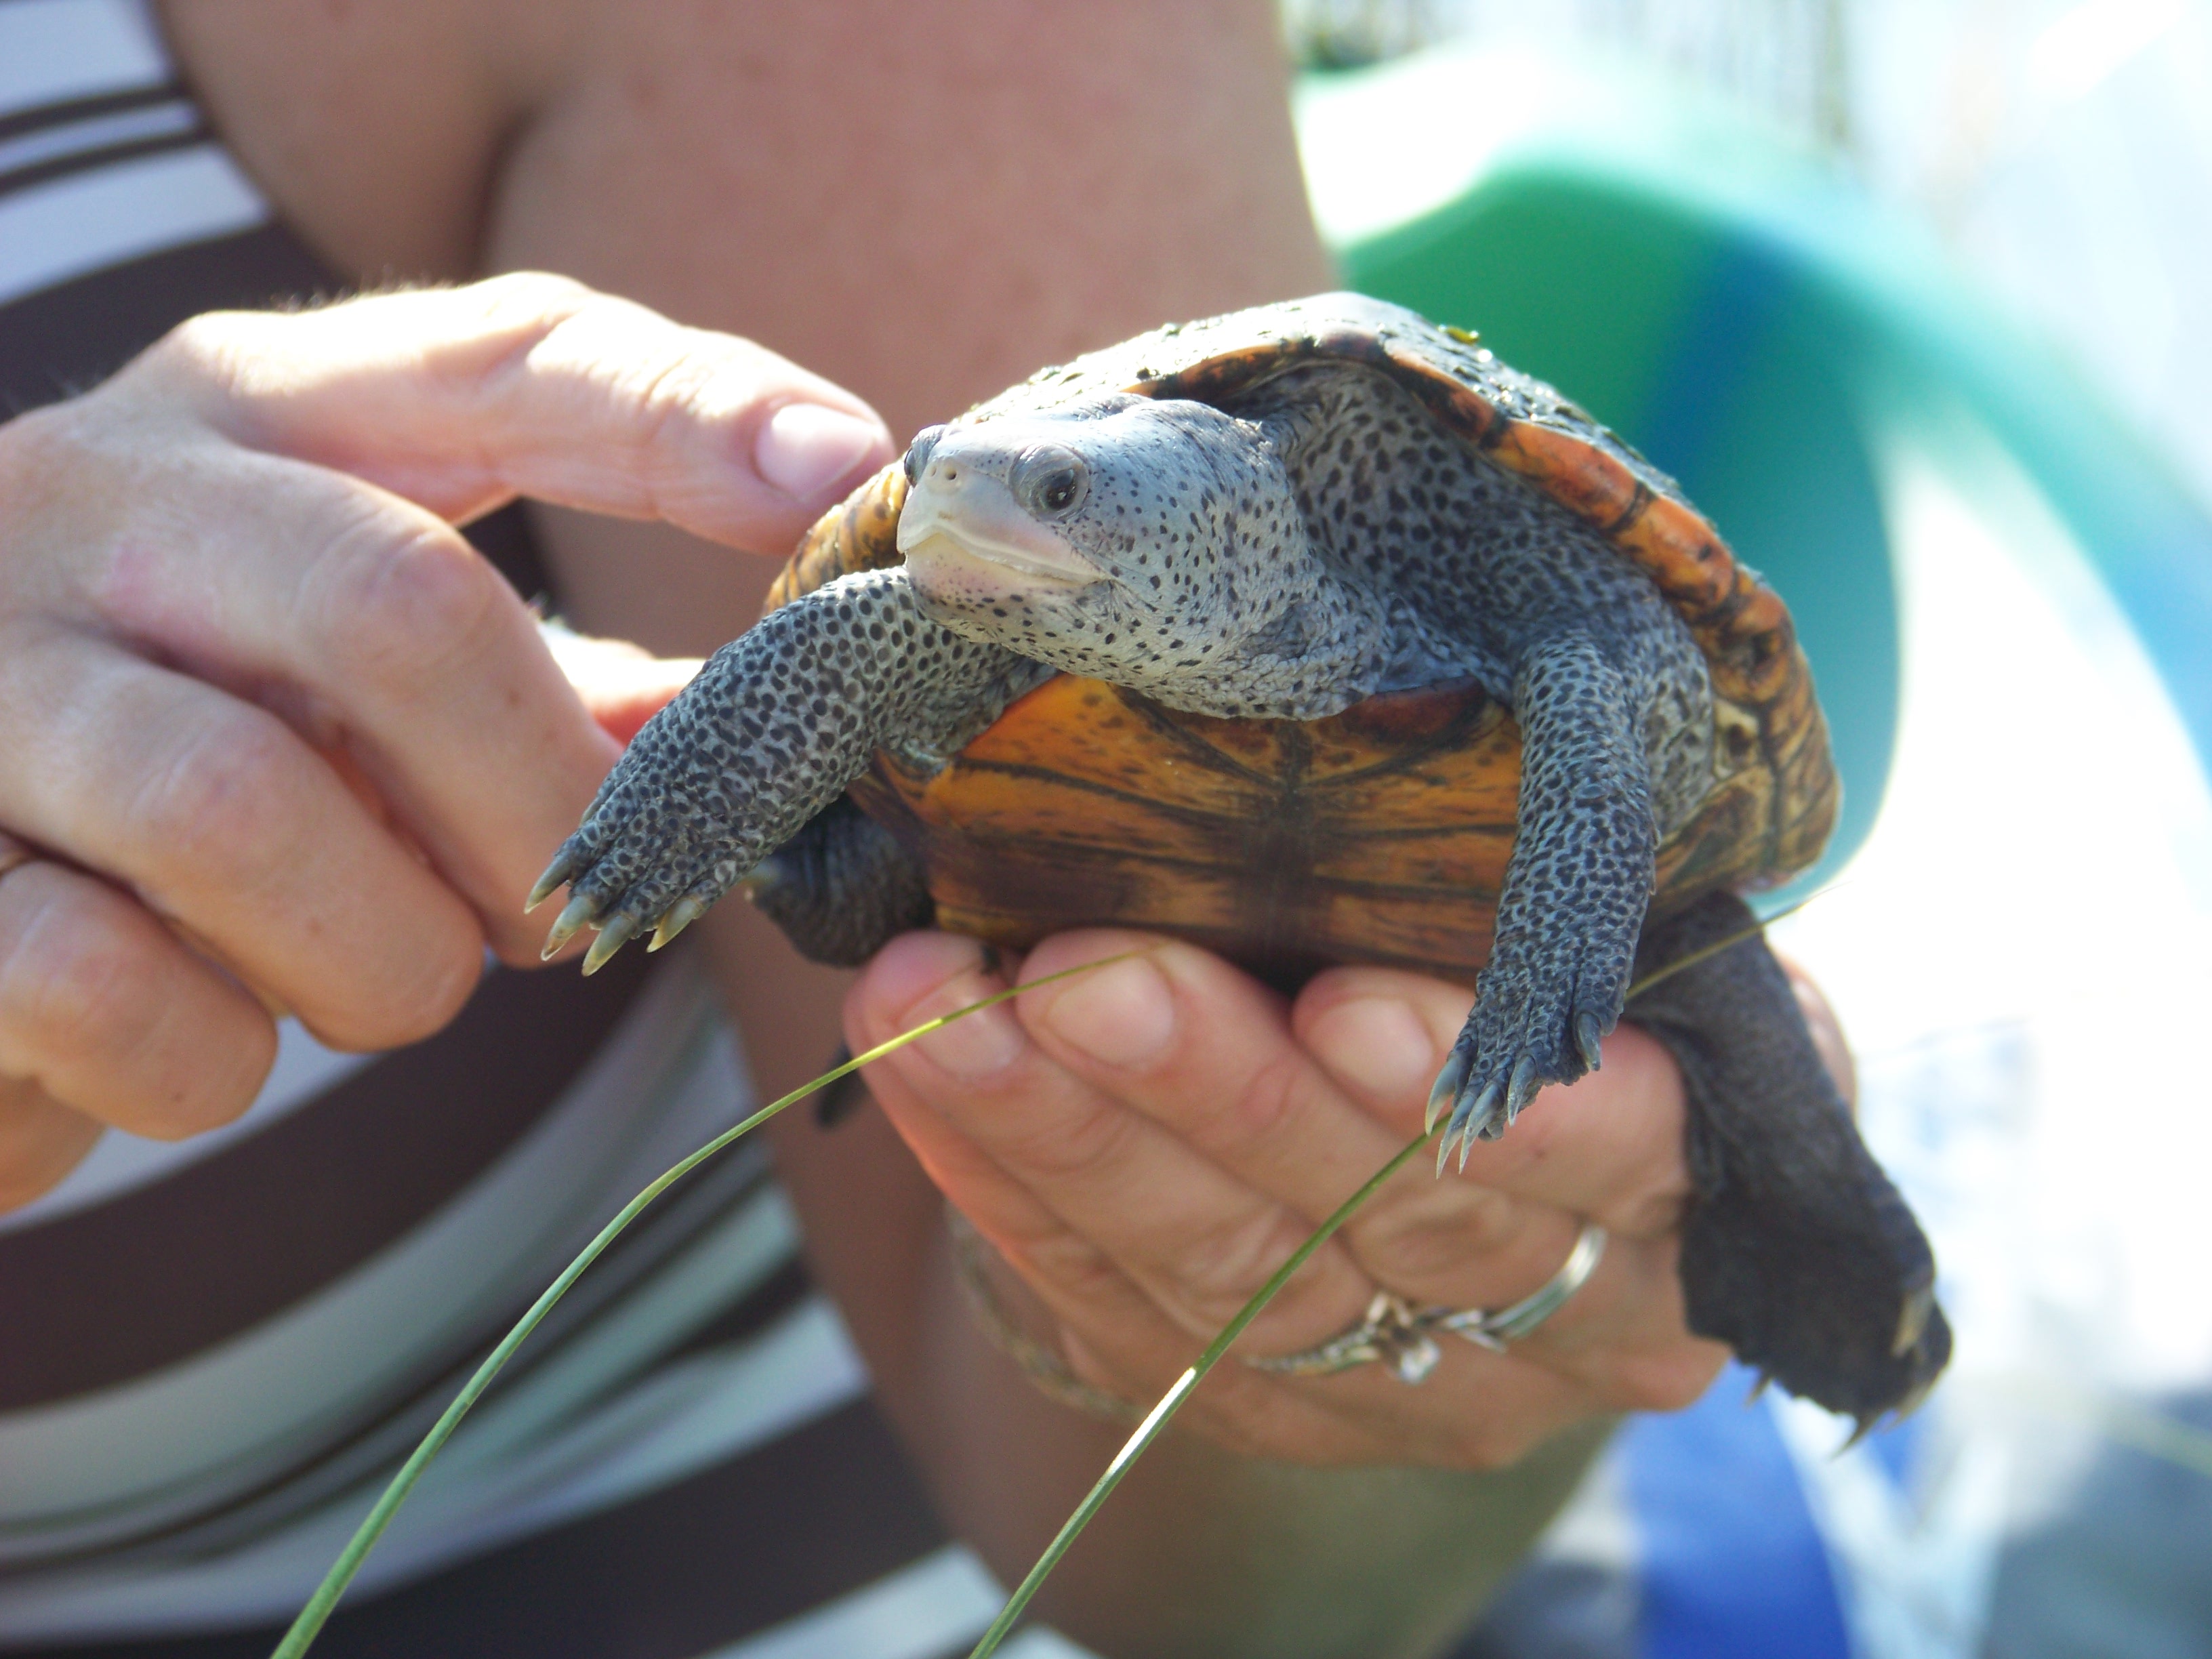
Fig. 1. The diamondback terrapin.
Photo: Molly O’Connor
Terrapins range from Massachusetts to Texas and within this range there are currently seven subspecies recognized – five of these live in Florida, and three are only found in Florida (Fig. 2). However, prior to 2005 their existence in the Florida panhandle was undocumented. The Panhandle Terrapin Project (PTP) was initially created to determine if terrapins did exist here.
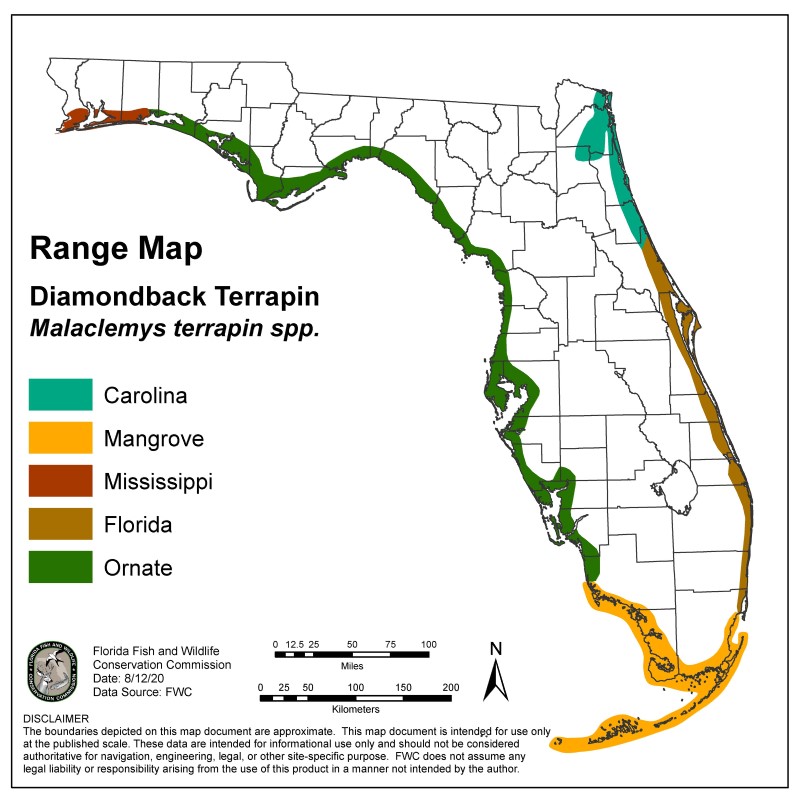
Fig. 2. Terrapins of Florida.
Image provided by FWC
The Scope of the Project
Phase 1
The project began in 2005 using trained volunteers to survey suitable habitat for presence/absence. Presence is determined by locating potential nesting beaches and searching for evidence of nesting. Nesting begins in April and ends in September – with peak nesting occurring in this area during May and June. The volunteers are trained in March and survey potential beaches from April through July. They search for tracks of nesting females, eggshells of nests that were depredated by predators, and live terrapins – either on the beach or the heads in the water. Often volunteers will conduct 30-minute head counts to determine relative abundance. Between 2005 and 2010 the team was able to verify at least one record in each of the panhandle counties.
Phase 2
The next phase is to determine their status – how many nesting beaches does each county have, and how many terrapins are using them? A suitability map was developed by Dr. Barry Bitters as a Florida Master Naturalist project to locate suitable nesting beaches. Volunteers would visit these during the spring to determine whether nesting was occurring, and the relative abundance was determined using what we called the “Mann Method” – developed by Tom Mann of the Mississippi Department of Wildlife, along with the 30-minute head counts. The Mann Method involved counting the number of tracks and depredated nests within a 16-day window. The assumption to this method was that nesting females would lay multiple clutches each season – but they did not lay more than one every 16 days. Going on another assumption, that the sex ratio within the population was 1:1, each track and depredated nest within a 16-day window was a different female and doubling this number would give the relative abundance of adults in this population. Between 2007 and 2023 we were able to determine the number of nesting beaches in each county and relative abundance in three of those counties (see results below).
Phase 3
Partnering with the U.S. Geological Survey, we were able to move to Phase 3 – which involves trapping and tagging terrapins. Doing this gives the team a better idea of where the terrapins are going and how they are using the habitat. To trap the terrapins, we use modified crab traps (modified so that the terrapins had access to air to breath), seine nets, fyke nets, dip nets, and by hand – the most effective has been modified crab traps (Fig. 3). These traps are placed in terrapin habitat over a 3-day period, being checked daily. Any captured terrapins are measured, weighed, sexed, marked using the notch method, and given a Passive Intergraded Transponder (PIT) tag. Some of the terrapins are given a satellite tag where movement could be tracked by GPS (Fig. 4). We are now bringing on acoustic tagging for some counties. This involves placing acoustic receivers on the bottom of the bay which will detect any terrapin (with an acoustic tag) that swims nearby. Results are below.
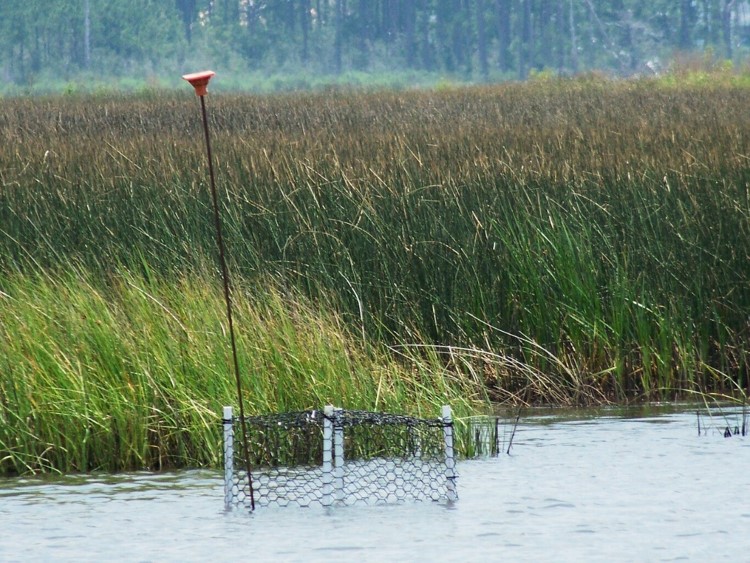
Fig. 3. Modified crab traps is one method used to capture adults.
Photo: Molly O’Connor

Fig. 4. This tag with an antenna can be detected by a satellite and tracked real time.
Photo: USGS
Phase 4
This phase involves collecting tissue samples for genetic analysis. Currently it is believed that the Ornate terrapin (Malaclemys terrapin macrospilota) ranges from Key West to Choctawhatchee Bay, and the Mississippi terrapin (M.t. pileata) ranges from Choctawhatchee Bay to the Louisiana/Texas border. The two subspecies look morphologically different (Fig. 5) and the team believes terrapins resembling the ornate terrapin have been found in Pensacola Bay. Researchers in Alabama have also reported terrapins they believe to be ornate terrapins in their waters as well. The project is now working with a graduate student from the University of West Florida who is genetically analyzing tissue samples from trapped terrapins to determine which subspecies they are and what the correct range of these subspecies. This phase began in 2025, and we do not have any results at this time.

Fig. 5. The Mississippi terrapin found in Pensacola Bay is darker in color than the Ornate terrapin found in other bays of the panhandle.
Photo: Rick O’Connor
Ornate Diamondback Terrapins Depend on Coastal Marshes and Sea Grass Habitats
Photo: Erik Lovestrand.
2025 UPDATE AND RESULTS
In 2025 we trained 188 volunteers across each county – including state park rangers and members of the Florida Oyster Corps. 47 (25%) participated in at least one survey.
We logged 345 nesting surveys and 17 trap days.
No seining or fyke nets were conducted in 2025.
Phase 1 – Presence/Absence Update
| County |
Presence |
Notes |
| Baldwin |
Yes |
A single deceased terrapin was found in western Baldwin County |
| Escambia |
Yes |
Team encountered nesting again this year |
| Santa Rosa |
Yes |
Two new locations were identified this year |
| Okaloosa |
Yes |
Encounters were lower this year |
| Walton |
Yes |
FIRST EVIDENCE OF NESTING IN WALTON COUNTY VERIFIED THIS YEAR |
| Bay |
Yes |
FIRST EVIDENCE OF NESTING IN BAY COUNTY VERIFIED THIS YEAR |
| Gulf |
Yes |
Team encountered nesting again this year |
| Franklin |
ND |
ND |
Phase 2 Nesting Survey – Update
| County |
# of primary beaches1 |
# of secondary beaches2 |
# of surveys |
# of encounters |
FOE3 |
| Baldwin |
0 |
TBD |
14 |
04 |
.00 |
| Escambia |
2 |
35 |
99 |
7 |
.07 |
| Santa Rosa |
3 |
45 |
137 |
25 |
.18 |
| Okaloosa |
4 |
3 |
20 |
1 |
.05 |
| Walton |
1 |
4 |
28 |
2 |
.07 |
| Bay |
3 |
3 |
47 |
14 |
.30 |
| TOTAL |
13 |
17 |
345 |
49 |
.14 |
1 primary beaches are defined as those where nesting is known to occur.
2 secondary beaches are defined as those where potential nesting is high but has not been confirmed.
3 FOE (Frequency of Encounters) is the number of terrapin encounters / the number of surveys conducted.
4 There was one deceased terrapin found by a tour guide in Baldwin County but was not part of the project.
5 There are potential nesting sites on Pensacola Beach that are technically in Escambia County but covered by the Santa Rosa team. The Escambia team focused on the Perdido Key area.
Phase 3 Trapping/Tagging Update
We currently have 8 years of data.
Terrapins have been tagged in 7 of the 8 panhandle counties.
1483 captures, 1061 individuals.
2025 Capture Effort
| Method |
County |
Number |
Description |
Condition |
| Hand capture |
Escambia |
1 |
1 adult male |
Deceased |
| Hand capture |
Santa Rosa |
5 |
4 adult females
1 unknown |
Released, deceased |
| Hand capture |
Okaloosa |
1 |
1 adult female |
Released |
| Dip Net |
Santa Rosa |
1 |
1 adult male |
Released |
| Crab Traps |
Santa Rosa |
34 |
4 juvenile females
5 adult females
25 adult males |
Released |
|
Okaloosa |
4 |
1 juvenile female
3 adult males |
Released |
| TOTAL |
|
46 |
5 juvenile females
10 adult females
30 adult males
1 unknown |
|
Preliminary information subject to revision. Not for citation or distribution.
Satellite Tagging Information
Due to the size of the tags – only large females are satellite tagged at this time.
Big Momma – tracked for 188 days – averaged 0.16 miles.
Big Bertha – tracked for 137 days – averaged 35.83 miles.
2025 Tracking Effort
| County |
Tagging Effort |
| Santa Rosa |
2 satellite tagged
6 acoustically tagged |
| Okaloosa |
1 satellite tagged |
| TOTAL |
8 tagged for tracking |
Phase 4 Update
This phase began in 2025 and there are no results at this time.
Summary
2025
17 trainings were given in 7 of the 8 counties of the Florida panhandle (including Baldwin County AL).
188 were trained; 47 (25%) conducted at least one survey.
345 surveys were logged; terrapins (or terrapin sign) were encountered 49 (14%) of those surveys.
Every county had at least one encounter during a nesting survey.
17 trapping days were conducted; 46 terrapins were captured; 37 (83%) were captured in modified crab traps; 7 were captured by hand; 1 was captured in a dip net.
8 terrapins were tagged for tracking; 6 acoustically; 2 with satellite tags.
Since 2007
511 have been trained.
1449 surveys have been logged; 347 encounters have occurred; Frequency of Encounters is 24% of the surveys.
Discussion
Phase 1
We have shown that diamondback terrapins do exist in the Florida panhandle and in Baldwin County AL.
Phase 2
We currently have 13 primary nesting beaches we are surveying weekly during nesting season across the panhandle. There were 17 secondary nesting beaches surveyed and most likely there are many more to visit. Nesting seems to be more common in late spring, but the Frequency of Encounters has been declining since 2023. This could be due to less terrapin activity but could also be due to evidence being difficult to find. We will continue to monitor to see how this trend continues.
Phase 3
The team has captured 1483 terrapins, the majority of which were from the eastern panhandle. Satellite tagged females suggest more than one has traveled over 30 miles from where they were tagged. This goes against the idea that terrapins have strong site fidelity. However, all the terrapins tagged were large females (due to size of the tags) so we are looking at the movements of only the larger females – not the population as a whole. The movements of these females also suggest they may use seagrass beds as much as the salt marshes.
Training for volunteers occurs in March of each year. If you are interested in participating, contact Rick O’Connor – roc1@ufl.edu.
by Rick O'Connor | Sep 15, 2025
Introduction
The bay scallop (Argopecten irradians) was once common in the lower portions of the Pensacola Bay system. However, by 1970 they were all but gone. Closely associated with seagrass, especially turtle grass (Thalassia testudinum), some suggested the decline was connected to the decline of seagrass beds in this part of the bay. Decline in water quality and overharvesting by humans may have also been a contributor. It was most likely a combination of these factors.
Scalloping is a popular activity in our state. It can be done with a simple mask and snorkel, in relatively shallow water, and is very family friendly. The decline witnessed in the lower Pensacola Bay system was witnessed in other estuaries along Florida’s Gulf coast. Today commercial harvest is banned, and recreational harvest is restricted to specific months and to the Big Bend region of the state. With the improvements in water quality and natural seagrass restoration, it is hoped that the bay scallop may return to lower Pensacola Bay.
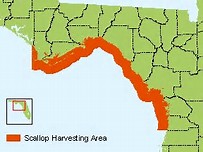
Scallop harvest area.
Image: Florida Department of Environmental Protection
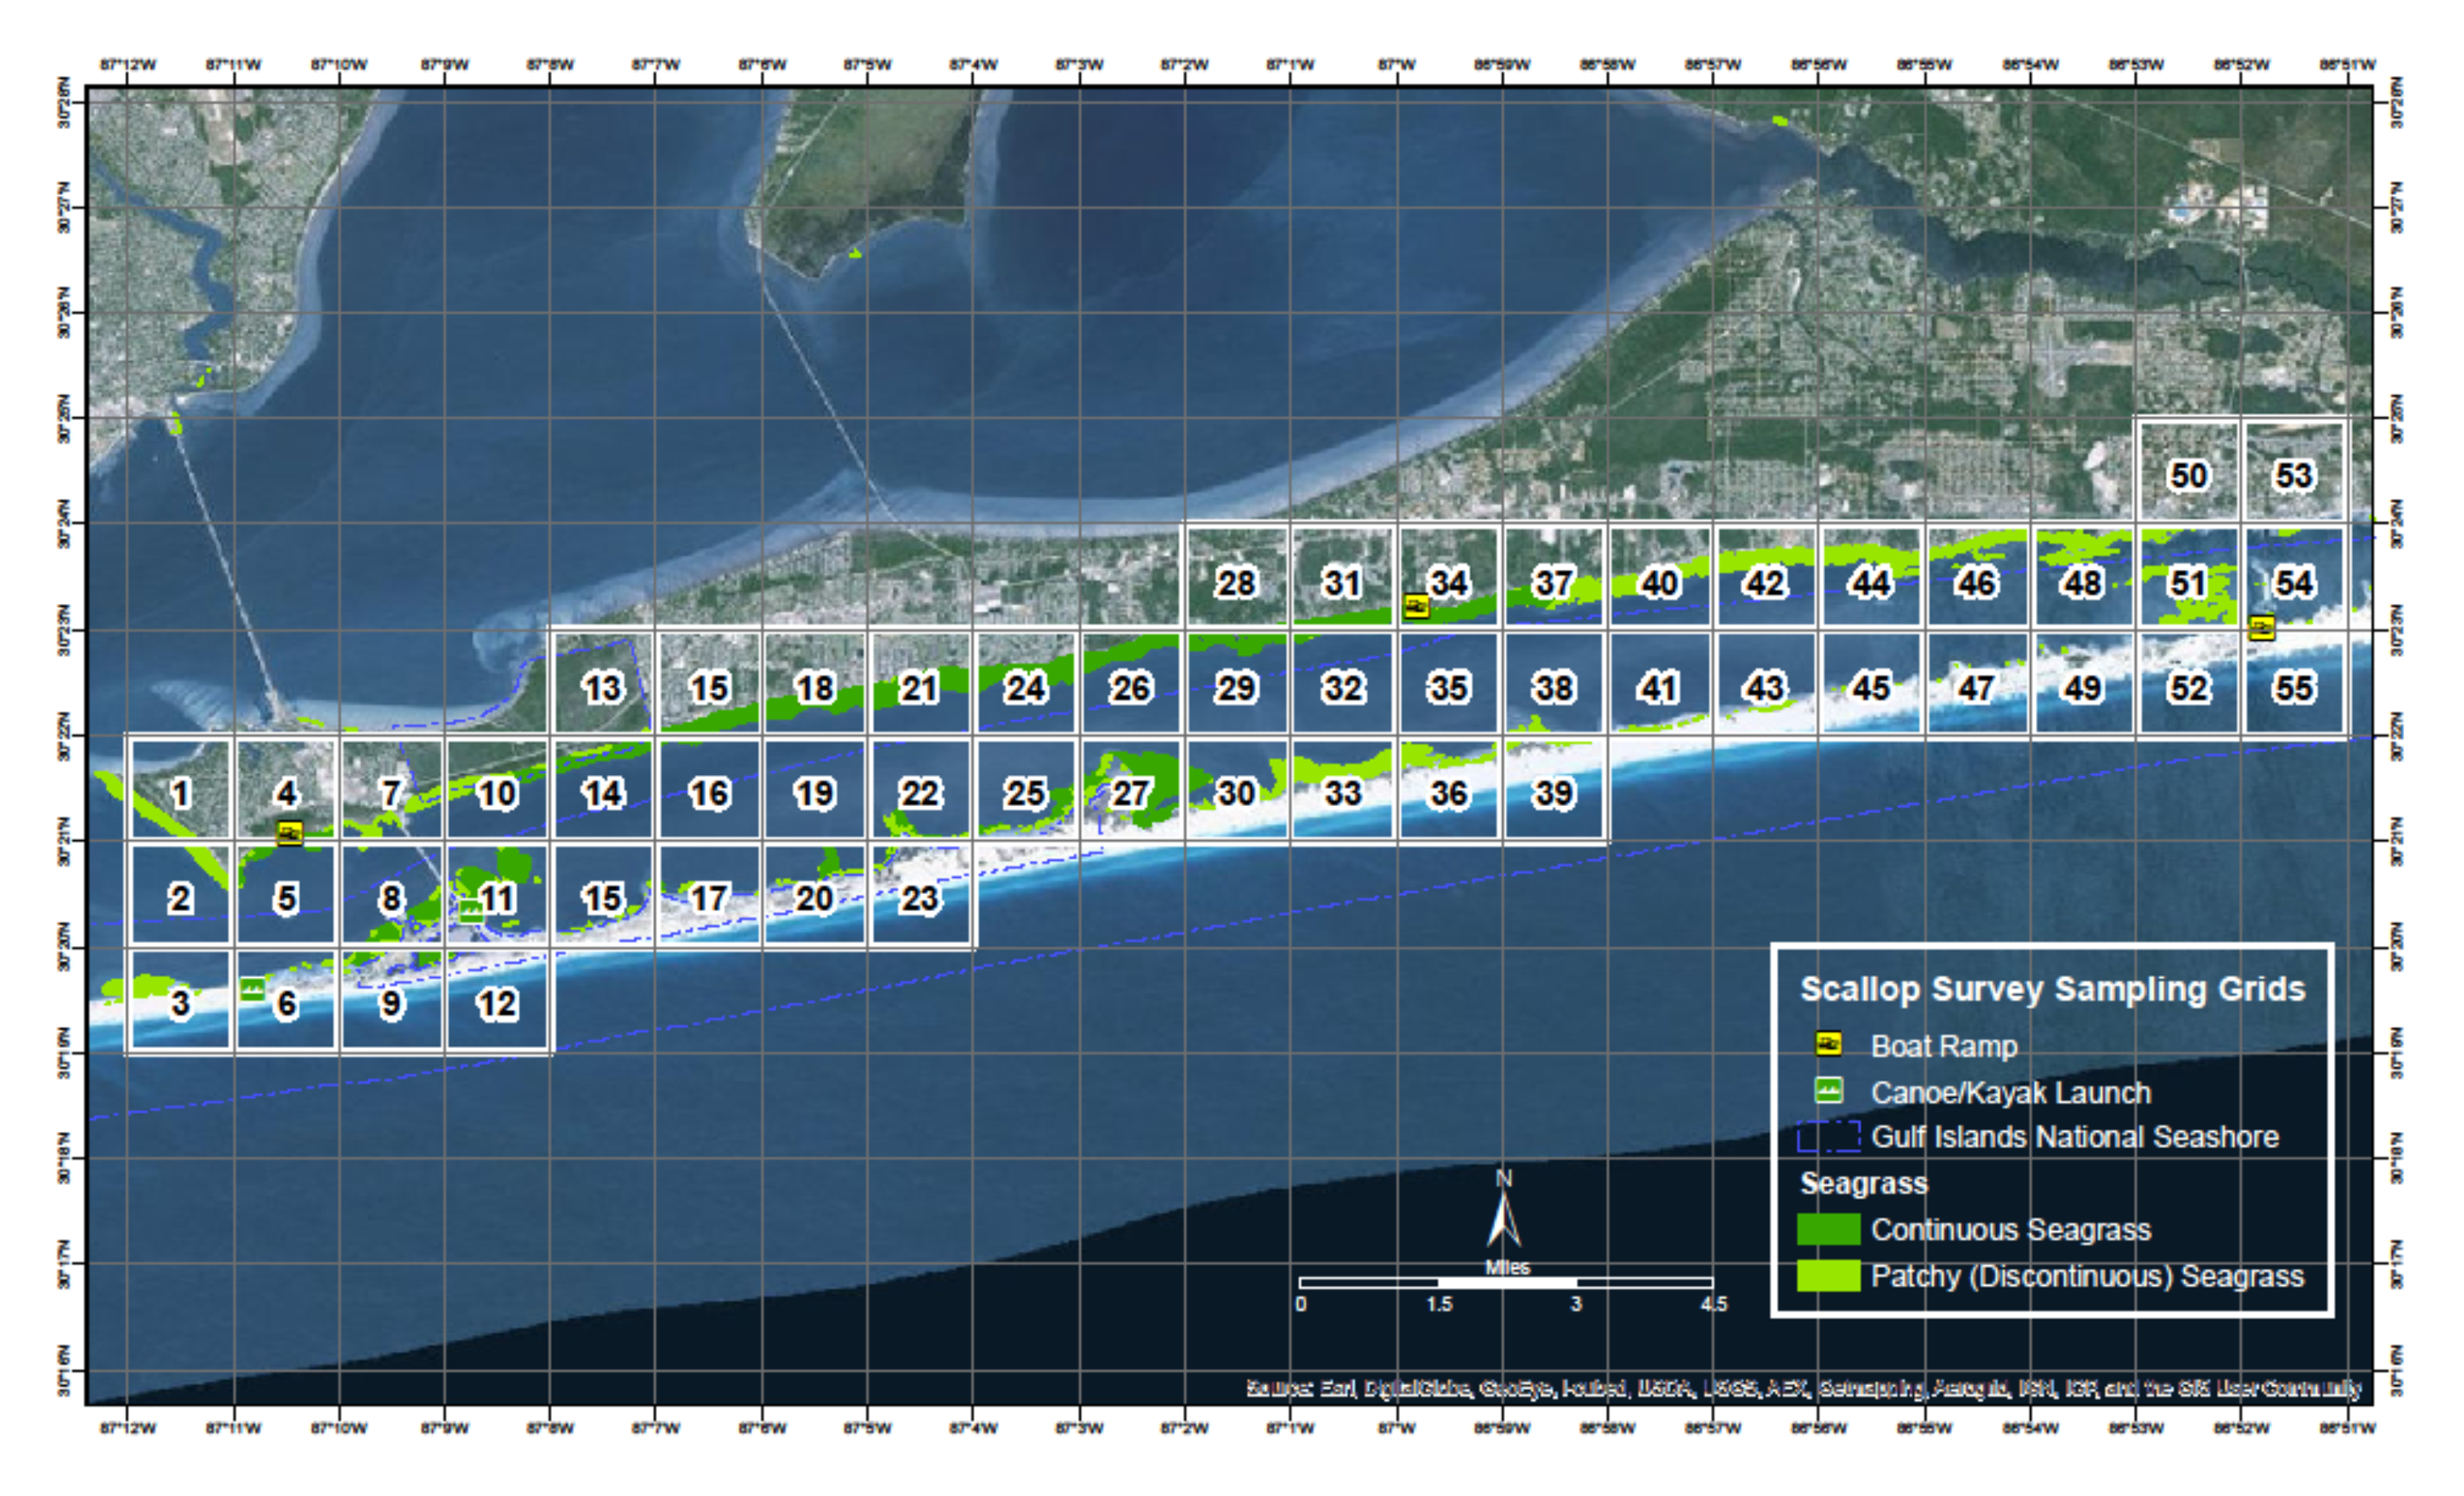
Since 2015 Florida Sea Grant has held the annual Pensacola Bay Scallop Search. Trained volunteers survey pre-determined grids within Big Lagoon and Santa Rosa Sound. Below is the report for both the 2025 survey and the overall results since 2015.
Methods
Scallop searchers are volunteers trained by Florida Sea Grant. Teams are made up of at least three members. Two snorkel while one is the data recorder. More than three can be on a team. Some pre-determined grids require a boat to access, others can be reached by paddle craft or on foot.
Once on site the volunteers extend a 50-meter transect line that is weighted on each end. Also attached is a white buoy to mark the end of the line. The two snorkelers survey the length of the transect, one on each side, using a 1-meter PVC pipe to determine where the area of the transect ends. This transect thus covers 100m2. The surveyors record the number of live scallops they find within this area, measure the height of the first five found in millimeters using a small caliper, which species of seagrass are within the transect, the percent coverage of the seagrass, whether macroalgae are present or not, and any other notes of interest – such as the presence of scallop shells or scallop predators (such as conchs and blue crabs). Three more transects are conducted within the grid before returning.
The Pensacola Scallop Search occurs during the month of July.
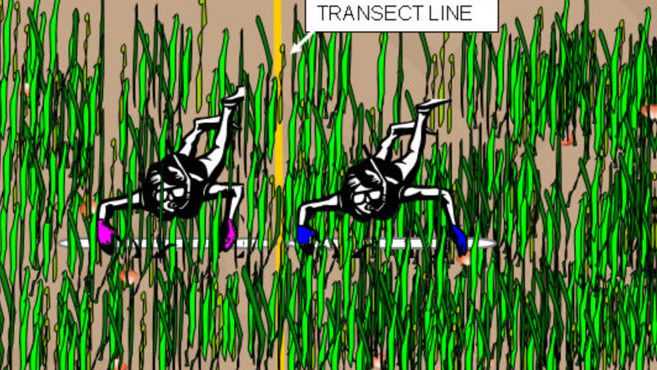
Snorkel transect method.
Image: University of Florida.
2025 Results
138 volunteers on 32 teams surveyed 22 of the 66 1-nautical mile grids (36%) between Big Lagoon State Park and Navarre Beach. 162 transects (16,200m2) were surveyed logging 8 scallops. All live scallops were reported from Santa Rosa Sound this year.
2025 Big Lagoon Results
13 teams surveyed 9 of the 11 grids (81%) within Big Lagoon. 76 transects were conducted covering 7,600m2.

No scallops were logged in 2025 though scallop shells were found. No sea urchins were reported but scallop predators – such as conchs, blue crabs, and rays were. This equates to 0.00 scallops/200m2 and moves Big Lagoon from a vulnerable system last year to a collapsed one this year. All three species of seagrass were found (Thalassia, Halodule, and Syringodium). Seagrass densities ranged from 50-100%. Macroalgae was present in 5 of the 9 grids (56%) and was reported abundant in grid 2.
2025 Santa Rosa Sound Results
19 teams surveyed 13 of the 55 grids (23%) in Santa Rosa Sound. 86 transects were conducted, covering 8,600m2.
8 scallops were logged which equates to 0.19 scallops/200m2. Scallop searchers reported blue crabs, conchs, and rays. All three species of seagrass were found. Seagrass densities ranged from 5-100%. Macroalgae was present in 7 of the 13 grids (54%) and was reported as abundant in 4 of those.
2015 – 2025 Big Lagoon Results
| Year |
No. of Transects |
No. of Scallops |
Scallops/200m2 |
| 2015 |
33 |
0 |
0.00 |
| 2016 |
47 |
0 |
0.00 |
| 2017 |
16 |
0 |
0.00 |
| 2018 |
28 |
0 |
0.00 |
| 2019 |
17 |
0 |
0.00 |
| 2020 |
16 |
1 |
0.12 |
| 2021 |
18 |
0 |
0.00 |
| 2022 |
38 |
0 |
0.00 |
| 2023 |
43 |
2 |
0.09 |
| 2024 |
67 |
101 |
3.02 |
| 2025 |
76 |
0 |
0.00 |
| Big Lagoon Overall |
399 |
104 |
0.52 |
2015 – 2025 Santa Rosa Sound Results
| Year |
No. of Transects |
No. of Scallops |
Scallops/200m2 |
| 2015 |
01 |
0 |
0.00 |
| 2016 |
01 |
0 |
0.00 |
| 2017 |
01 |
0 |
0.00 |
| 2018 |
01 |
0 |
0.00 |
| 2019 |
01 |
0 |
0.00 |
| 2020 |
01 |
0 |
0.00 |
| 2021 |
20 |
0 |
0.00 |
| 2022 |
40 |
2 |
0.11 |
| 2023 |
28 |
2 |
0.14 |
| 2024 |
85 |
32 |
0.76 |
| 2025 |
86 |
8 |
0.19 |
| Santa Rosa Sound Overall |
2591 |
44 |
0.34 |
1 Transects were conducted during these years but data for Santa Rosa Sound was logged by an intern with the Santa Rosa County Extension Office and is currently unavailable.
Discussion
Based on a Florida Fish and Wildlife Research Institute publication in 2018, the final criteria are used to classify scallop populations in Florida.
| Scallop Population / 200m2 |
Classification |
| 0-2 |
Collapsed |
| 2-20 |
Vulnerable |
| 20-200 |
Stable |
Based on this, over the last nine years we have surveyed, the populations in lower Pensacola Bay are still collapsed. Big Lagoon reached the vulnerable level in 2024, but no scallops were found there in 2025, returning to a collapsed state.
There are some possible explanations for low numbers in 2025.
- It has been reported by some shellfish biologists that bay scallops have a “boom-bust” cycle. Meaning that one year their populations “boom” before returning to normal numbers. We could have witnessed this between 2024 and 2025.
- Though we did not monitor water temperatures, July 2025 was extremely hot, and many volunteers reported their sites felt like “bath water”. Collecting efforts on other projects during July reported not capturing anything – no pinfish, hermit crabs – their nets were empty. It is possible that these warm conditions could have caused many organisms to move to deeper/cooler depths. Note here; as the project moved into August temperatures did begin to cool and searchers began reporting fish, conchs, blue crabs, and rays.
The Pensacola Bay area continues to have a collapsed system. The larger populations found in 2024 suggest that there are scallops in the area but may not be enough to increase their population status from collapsed to vulnerable. We will continue to monitor each July.
It is important for locals NOT to harvest scallops from either body of water. First, it is illegal. Second, any chance of recovering this lost population will be lost if the adult population densities are not high enough for reproductive success.
Acknowledgements
We would like to thank ALL 138 volunteers who surveyed this year. We obviously could not have done this without you.
Below are the “team captains”.
Ethan Sadowski John Imhof Kaden Luttermoser
John Wooten Susan Pinard Matt MacGregor
Christian Wagley Sean Hickey Jason Buck
Brian Mitchell Angela Guttman Caitlen Murrell
Samantha Brady (USM) Michelle Noa Kira Benton
Monica Hines Wesley Allen Kelly Krueger
Mikala Drees Jonathan Borowski Michael Currey
Gina Hertz Melinda Thoms Beau Vignes
Bill Garner Robert Moreland Stephanie Kissoon
Nick Roest Leah Yelverton

A team of scallop searchers celebrates after finding a few scallops in Pensacola Bay.

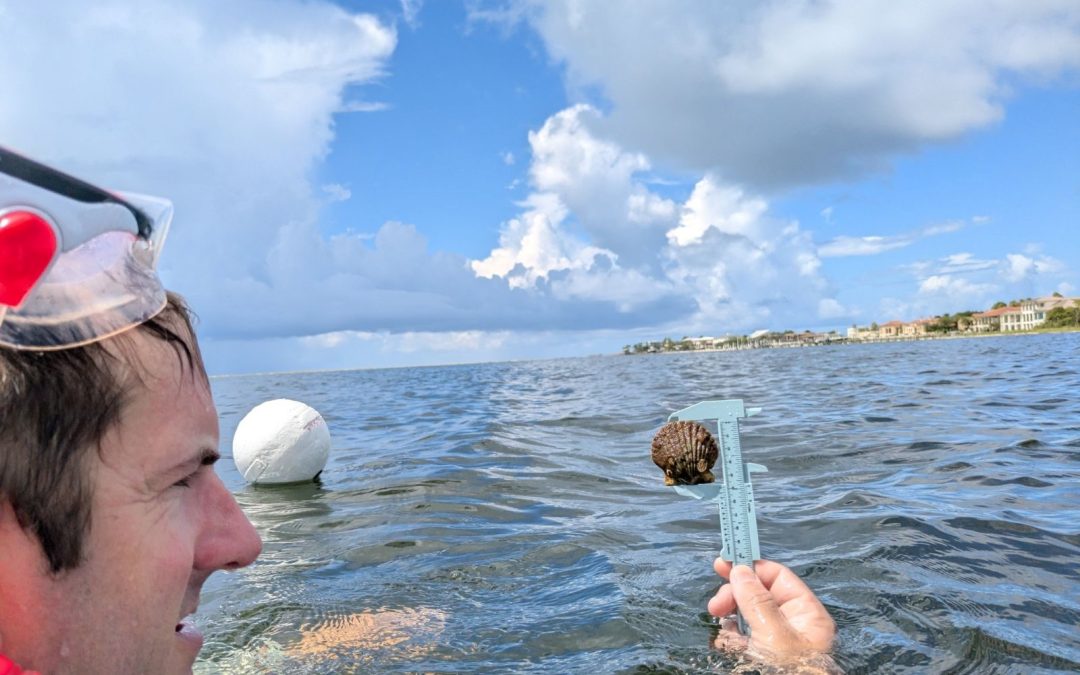
Volunteer measures a scallop he found.
Photo: Abby Nonnenmacher
by Rick O'Connor | Sep 8, 2025
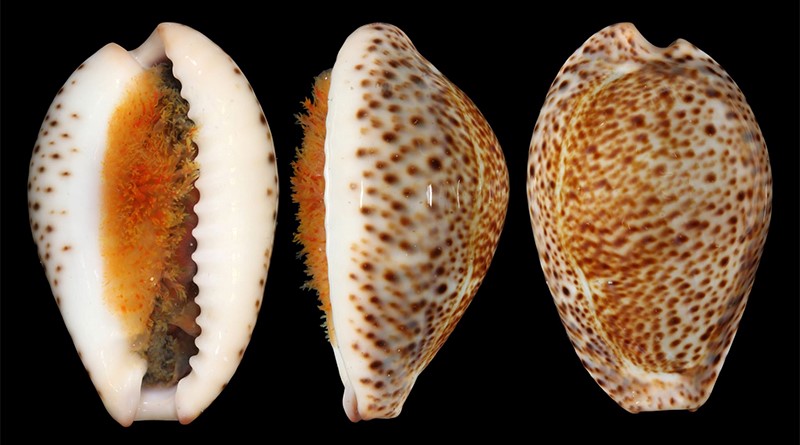
They continue to come. Invasive species have always been a problem in Florida and many of the south Florida species are moving north. One of these is a new marine snail – the thrush cowrie.
This snail is from the Red Sea and Indian Ocean and has been dispersing across the oceans for some time now. Their larva are planktonic and can be carried by the current but are also believed to be dispersed via ships ballast. They were first reported along the eastern coast of Florida in 2022 and have recently been found along the Florida panhandle.
They are most abundant in waters less than 25’ feeding on vegetation but secrete their eggs on hard substrate like jetties and seawalls. If you find this snail, please remove it from the water and report it to your Sea Grant Agent at the local Extension Office. Information we would like when reporting includes the date found, time, location (latitude and longitude if known), water depth, how many, live or dead, your name, and any comments you would like to include.
The thrush cowrie.
Photo: FWC.
by Thomas Derbes II | Sep 8, 2025
Florida and Georgia are our next two states that are ready for their aquaculture profile. Florida is one of the leaders not only in the South but the whole United States in terms of aquaculture production. Florida is well known for its aquarium trade and food fish aquaculture, and its close location and ease of access to water (salt or fresh) make Florida a prime candidate for aquaculture ventures. Oyster and clam aquaculture have been a staple of the Florida aquaculture industry in the Big Bend area, and there is even an inland salmon farm on the edge of the Everglades!
Catfish and trout farms reign supreme in Georgia, and that comes as no surprise. Georgia is almost completely landlocked and is the base of the Appalachian Mountains, with a warmer, almost tropical climate in the southern portion of the state and a more temperate climate in the northern portion. The North Georgia mountains are known for excellent trout fishing, and state hatcheries have popped up all along the rivers to help increase the stocks of trout for fishermen to enjoy. These hatcheries are leading the way for trout aquaculture research and stock enhancement studies. Georgia is also well known for its sport/gamefish aquaculture industry. Let’s take a look at aquaculture in Florida and Georgia!
Florida
While not the leader in Southern aquaculture, Florida’s diverse landscape and access to salt and freshwater opens the door for a variety of different aquaculture practices throughout the state. Ornamental fish and mollusks (clams and oysters) are the top two producing aquacultured species in Florida, and for Florida’s spotlight we will focus on the ornamental fish and clam industries.
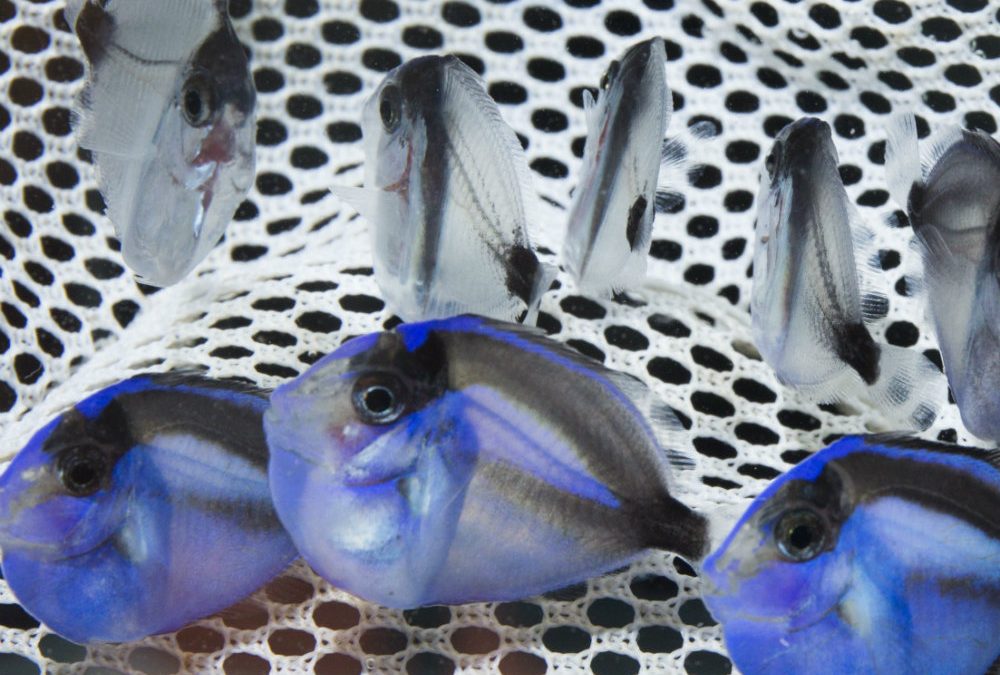
Florida’s ornamental (tropical) fish aquaculture is a dominant economic force, accounting for the largest share of the state’s aquaculture output. In 2023, it generated over $60 million in sales, making Florida the nation’s top pet-fish producer, responsible for about 95 percent of all ornamental fish sold in the U.S., with 90 percent being freshwater species. There are roughly 200 producers cultivating over 800 varieties of freshwater tropical fish, using methods such as earthen ponds, above-ground tanks, and recirculating systems, particularly in Hillsborough, Polk, and Miami-Dade counties. Marine ornamentals are produced at far fewer facilities, about 15 in Florida as of 2023, though they carry higher per-unit value and often rely on advanced recirculating aquaculture systems. These marine ornamental facilities have been instrumental in helping slow down the wild harvest of marine reef fish that has wiped out reefs in Indonesia and other parts of the Pacific.
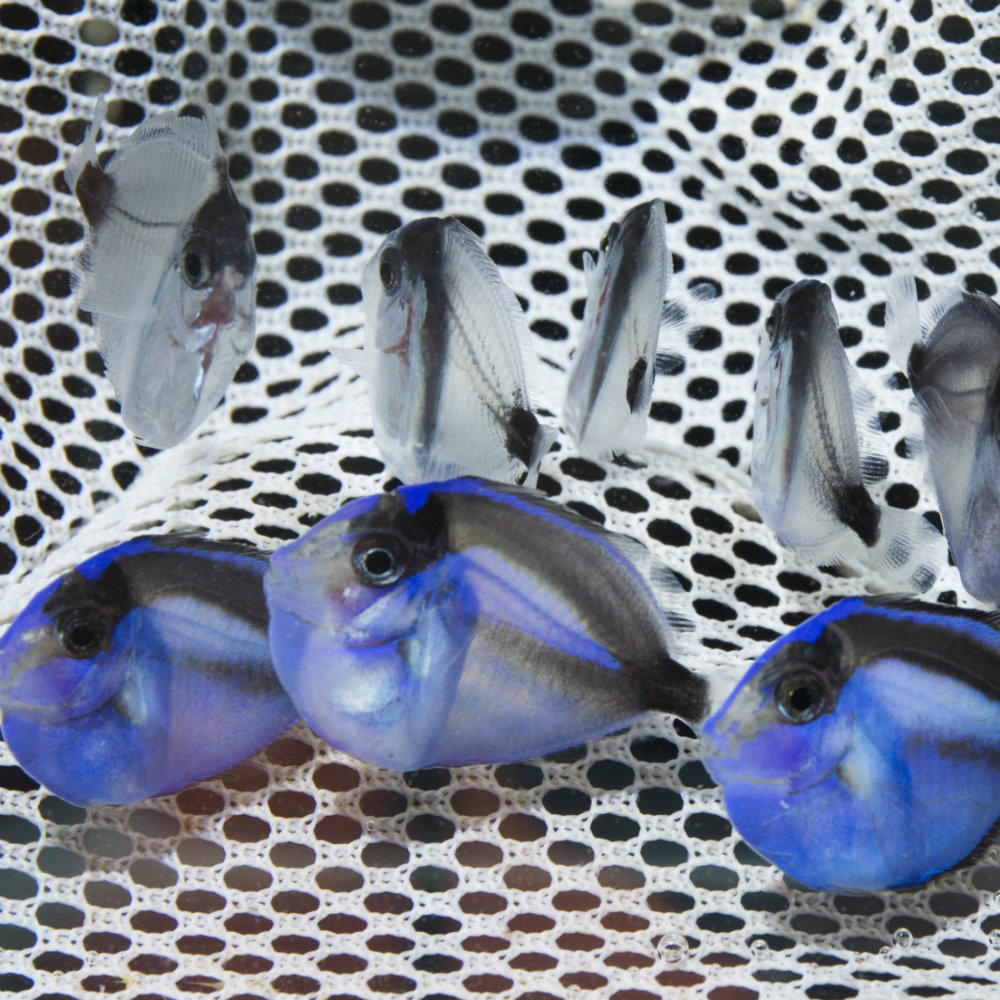
Blue Tang Juveniles bred at UF Tropical Fish Lab – UF/IFAS
Florida’s clam aquaculture is another key sector. Most production occurs near Cedar Key, which accounts for about 90 percent of the state’s farm-raised clams, generating approximately $32 million in sales in 2023 from 111 growers. Nationwide, Florida ranks second in both the number of clam growers and total sales. The farming process involves hatchery-reared seed, nursery tanks, and deployment of mesh bags on the seafloor for growth before harvest. The industry contributes significantly to regional economies but remains highly vulnerable to hurricanes and storms, which have repeatedly caused disruptive losses and threaten farm infrastructure and livelihoods.
The University of Florida has been a major asset to the shellfish aquaculture industry in Florida, with labs focused on topics ranging from sudden unexplained mortality syndrome (SUMS) to broodstock and larval conditioning. The University of Florida, through UF/IFAS, Tropical Aquaculture Laboratory, and Florida Sea Grant, provides research, education, risk assessments, and extension services for shellfish, ornamental fish, food-fish, and emerging sectors like seaweed farming, helping ensure sustainable, economically viable growth and environmental stewardship in Florida’s diverse aquaculture industry.
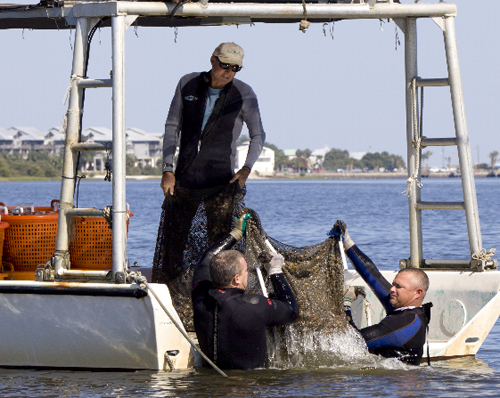
Clam Farming – UF IFAS
Meanwhile, the University of Miami Rosenstiel School helps advance marine aquaculture with its Experimental Hatchery, developing hatchery technologies for species like red snapper, cobia, and mahi-mahi, and conducting nutrition and integrated, sustainable multi-trophic systems research to boost commercial viability and coastal resilience. Florida universities remain a leader in aquaculture innovation and research.
| Florida Aquaculture |
| Category |
2017 Farms |
2017 Value* |
2023 Farms |
2023 Value* |
+/- Farms |
+/- Value |
| Catfish |
35 |
$459 |
19 |
$687 |
-16 |
$228 |
| Trout |
2 |
(D) |
1 |
(D) |
-1 |
(D) |
| Other Food Fish |
101 |
$4,254 |
78 |
$24,930 |
-23 |
$20,676 |
| Baitfish |
7 |
$336 |
6 |
$249 |
-1 |
-$87 |
| Crustaceans |
34 |
$4,732 |
41 |
$33,831 |
7 |
$29,099 |
| Mollusks |
162 |
$17,291 |
247 |
$53,348 |
85 |
$36,057 |
| Ornamental Fish |
158 |
$34,506 |
188 |
$62,369 |
30 |
$27,863 |
| Sport/Gamefish |
24 |
$1,784 |
18 |
$1,824 |
-6 |
$40 |
| Other Aquaculture |
113 |
$8,816 |
168 |
$13,860 |
55 |
$5,044 |
| Total |
636 |
$72,178 |
766 |
$191,098 |
130 |
$118,920 |
*x$1,000
Georgia
Florida’s Northern neighbor, Georgia, also has an identity crisis when it comes to climate. The Southern portion of Georgia is known for its vast pine wood forests and almost tropical environment whereas the area North of Atlanta tends to experience a more temperate climate (meaning they really get to experience the seasons, not just Summer Jr, Summer, and “Winter”). Catfish farming takes the number one spot for production, followed closely by sport/gamefish and trout production. Since we have previously discussed catfish farming, let’s take a closer look at the sport/gamefish industry and restoration/stock enhancement trout aquaculture industry in Georgia.
Georgia’s aquaculture sector is modest in scale but diverse and growing, especially in warmwater sportfish like catfish, bass, panfish, and trophy species. The state’s hatcheries, managed by the Georgia Department of Natural Resources (DNR), annually produce around 40 million warmwater fry, fingerlings, and adult fish, including channel catfish, bluegill, redear sunfish, largemouth bass, and striped bass hybrids, primarily for stocking public ponds, small lakes, and reservoir systems to boost recreational fishing opportunities.
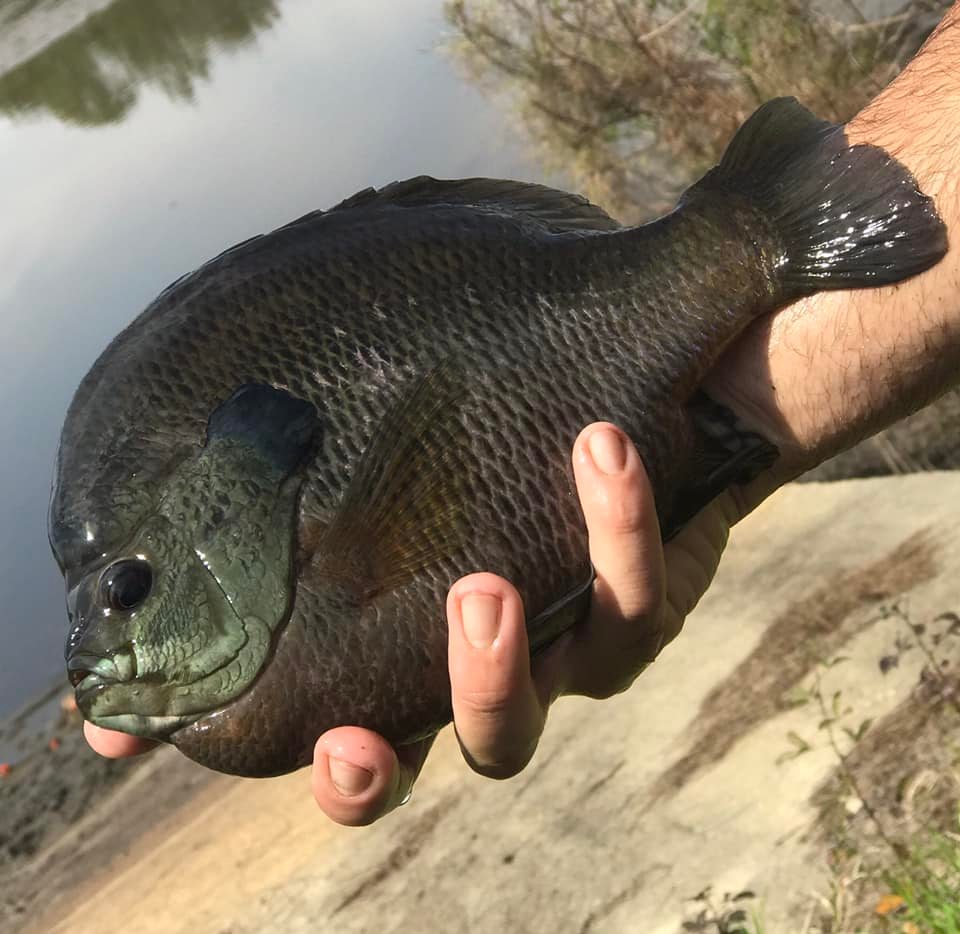
Georgia Giant Hybrid Bluegill – Ken’s Hatchery & Fish Farm, Alapaha, Georgia
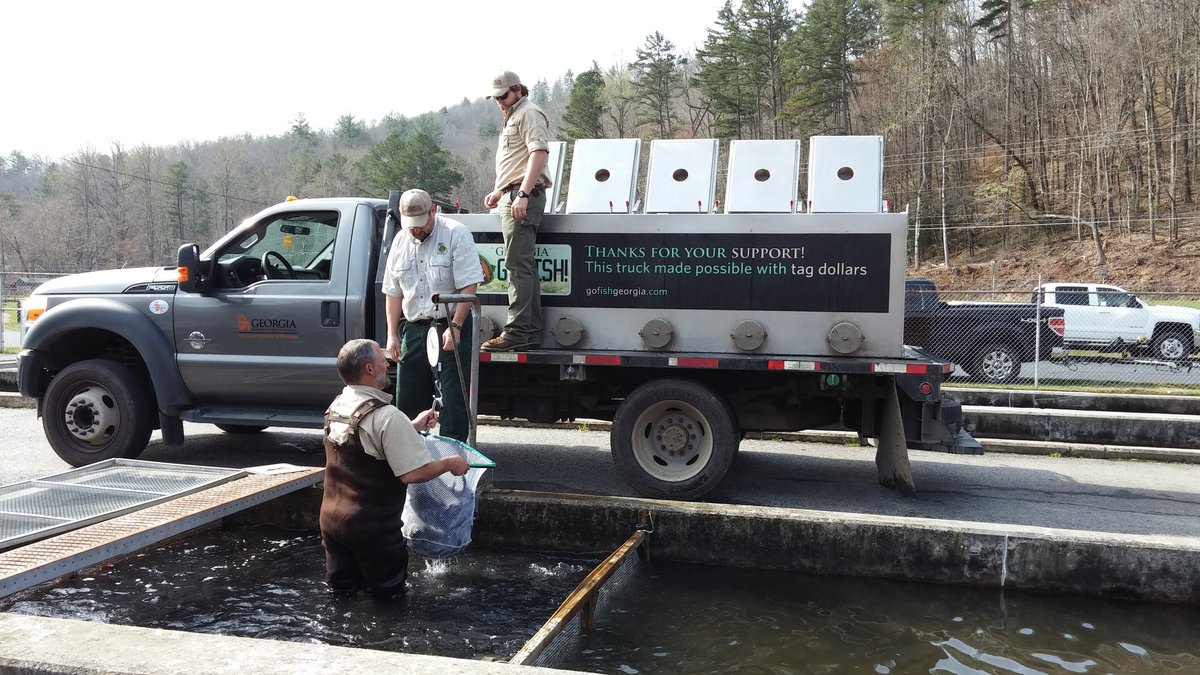
Georgia’s Wildlife Resources Division within Georgia DNR, in partnership with the U.S. Fish & Wildlife Service, stocks around one million rainbow and brown trout annually, dispersed across roughly 160 streams from late March through mid-September. Starting each spring, and occurring almost weekly, they will release about 50,000 trout into North Georgia rivers and creeks, using four hatcheries and nine transport trucks. This program bolsters angler opportunities throughout the state’s nearly 4,000 miles of trout streams.

Trout Being Loaded For Stocking Georgia Rivers – Georgia DNR
Across the private sector, operations routinely culture multiple finfish species: notably catfish (mostly channel and blue), tilapia, and “panfish” like bluegill, redear sunfish, and crappie, as well as bass species, including largemouth, smallmouth, striped and hybrid striped bass. The “Georgia Giant” is a proprietary hybrid sunfish developed by a South Georgia fishery specialist, specifically a cross between female green sunfish and male coppernose bluegill. These Georgia Giants are known for their rapid growth and can reach massive sizes, and they have been a favorite for pond fishermen all around the United States.
The University of Georgia (UGA) plays a central role in supporting this industry through research, extension, and technology transfer. UGA promotes aquaponics and recirculating systems, helping farmers pivot from traditional crops to diversified aquaculture, including sportfish, catfish, tilapia, freshwater prawns, ornamental fish, and even alligators. The state’s favorable climate, abundant natural resources, and strong agricultural infrastructure underpin its potential for further expansion.
| Georgia Aquaculture |
| Category |
2017 Farms |
2017 Value* |
2023 Farms |
2023 Value* |
+/- Farms |
+/- Value |
| Catfish |
47 |
$1,975 |
26 |
$1,692 |
-21 |
-$283 |
| Trout |
16 |
$1,608 |
10 |
$1,145 |
-6 |
-$463 |
| Other Food Fish |
6 |
(D) |
4 |
(D) |
-2 |
(D) |
| Baitfish |
3 |
$24 |
3 |
(D) |
0 |
(D) |
| Crustaceans |
5 |
$54 |
2 |
(D) |
-3 |
(D) |
| Mollusks |
4 |
(D) |
1 |
(D) |
-3 |
(D) |
| Ornamental Fish |
2 |
(D) |
2 |
(D) |
0 |
(D) |
| Sport/Gamefish |
14 |
$3,776 |
11 |
$1,245 |
-3 |
-$2,531 |
| Other Aquaculture |
11 |
(D) |
20 |
(D) |
9 |
(D) |
| Total |
108 |
$7,437 |
79 |
$4,082 |
-29 |
-$3,355 |
*x$1,000
Up Next – Louisiana and Mississippi!
References:
https://www.nass.usda.gov/Publications/AgCensus/2022/Full_Report/Census_by_State/Georgia/index.php
https://www.nass.usda.gov/Publications/AgCensus/2022/Full_Report/Volume_1,_Chapter_1_State_Level/Florida/flv1.pdf
https://www.nass.usda.gov/Publications/AgCensus/2022/Full_Report/Volume_1,_Chapter_1_State_Level/Georgia/gav1.pdf
https://shellfish.ifas.ufl.edu/