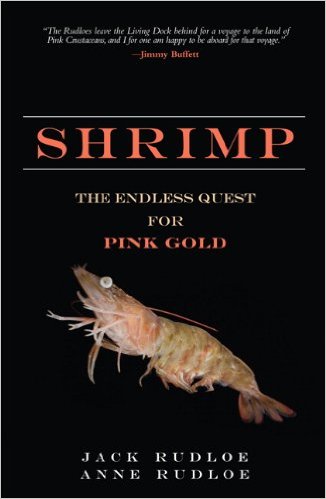
by Rick O'Connor | Apr 29, 2022
I recently saw a news clip about a new Florida Fish and Wildlife Conservation (FWC) ruling for shrimpers. I was interested in this new ruling but also asked the question – “Where did all of the shrimpers go?”
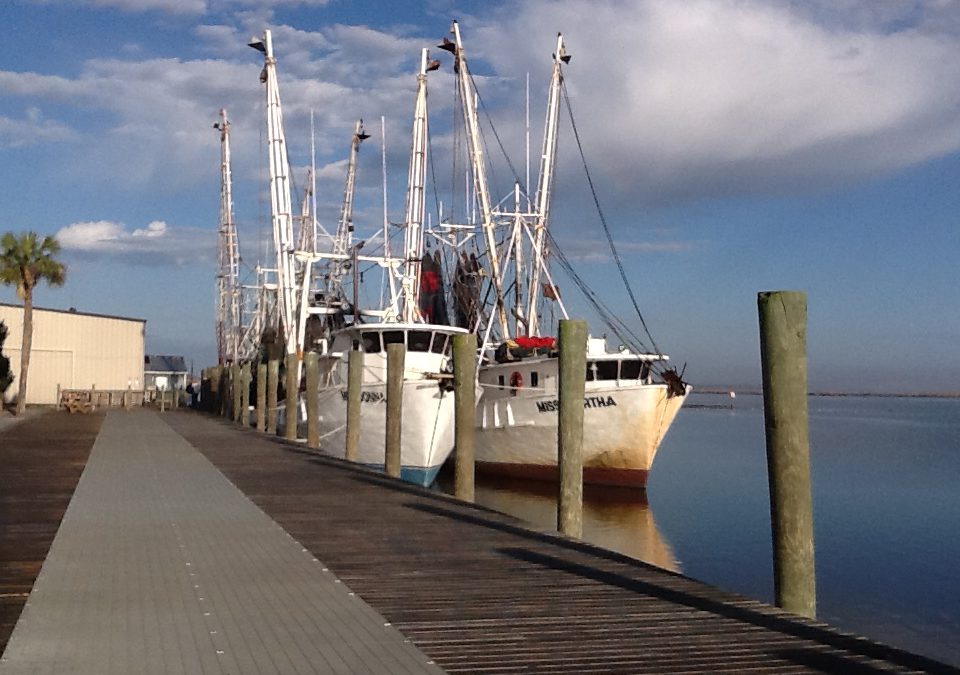
What I mean by this is that when I was young there were shrimp boats on Pensacola Bay every evening. They seemed to trawl one side of the Pensacola Bay Bridge or the other, but you could see the lights on the decks of each trawler and there were many, looking like front porch lights of a small community, all over the bay. In the morning they would head towards the seawall along both sides of Palafox Street near the old Pensacola Municipal Auditorium and sell from the boats. We made frequent trips there.
Then the boats stopped coming to the docks…
And the Municipal Auditorium is now gone also…
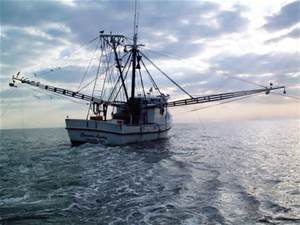
Shrimping in the Gulf of Mexico.
Photo: NOAA
The focus turned to the docks near Joe Patti’s. Joe Patti’s, American, and Allen Williams Seafood companies were places we would frequent to purchase shrimp when they came in. Then those slowly disappeared with only Joe Patti’s remaining open to the public. The shrimp boats still come to the docks of Allen Williams, but in fewer numbers and the shrimp began to go through Joe Patti’s, Maria’s, Perdido and other seafood markets. Now the lights on the bay at night are few. Actually, I rarely see them anymore. Where did they go?
As you look at the commercial landings of shrimp since 1980 you see some interesting trends.
First, understand that commercial landings mean this is where the shrimpers “land” their catch, not where they caught it.
Second, that brown shrimp (bay shrimp) are BY FAR the most landed species in Escambia County. Comparing brown shrimp to white (also called Gulf shrimp), rock shrimp, and royal reds, there was a total of 13,372,791 lbs. of brown shrimp landed between 1984 and 2019. For the others white shrimp was 255,587 lbs., royal reds 95,920 lbs., and rock shrimp 78,817 lbs. You could also say the same for effort. Between 1984-2019 there were 31,935 trips for brown shrimp, 904 for white shrimp, 143 for rock shrimp, and only 19 for royal reds. So, brown shrimp are king for commercial landings here.
Third, there were 1000 or more trips per year for brown shrimp until 2002. That year it dropped to 835. In 2003 that was cut in half to 453 and the trend continued to decline. Between 2017-2019 there were less than 100 trips each year. There is a similar pattern for white shrimp. Prior to 2002 the number of trips for white shrimp were in the double digits, occasionally in the triple, each year. In 2002 it dropped from 38 to 7 per year and never recovered. Though royal reds and rock shrimp were never big players in local landings, between 2010 and 2019 there was only one trip for rock shrimp and no trips were logged for royal reds. What happened?
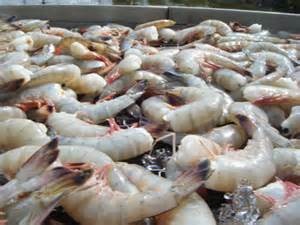
The famous Gulf Coast shrimp.
Photo: Mississippi State University
To try and find answers I reached out to a couple of my seafood contacts. Teresa and Bob Pitts are from the Perdido Key area and have been involved with commercial fishing most of their lives. Teresa currently manages Perdido Seafood and Bob works with the National Park Service but they both have strong ties to this industry. Jimbo Meador is a lifelong resident of Mobile Bay and has been involved in several industries including seafood over there. Jimbo recently retired from being nature tour operator in the Mobile Delta but still has ties to the seafood business and a wealth of knowledge. Dr. Andrew Ropicki is an economist with Florida Sea Grant and the University of Florida who focuses on seafood and other marine related topics. I had a conversation with all, and comments were made that helped connect some the dots.
In 1995 the state imposed a net ban on all entanglement nets 500 ft2 or larger from state waters. This obviously would have included Pensacola Bay. I know the shrimpers were opposed to this amendment. They were very visible and vocal about it. Once passed it would make sense they would move their operations from Pensacola Bay to Alabama, or federal waters offshore, so they could continue to use their standard sized otter trawls. Honestly, I do not remember which year the deck lights of the shrimp boats began to disappear, but I would guess many did leave when this law was passed. However, this did not impact the number of landings, they continued to bring shrimp here.
Otter trawl is correct name for what folks call a shrimp net. In 1995 any entanglement net over 500 square feet were banned in Florida waters.
Prior to 1995 landings of brown shrimp ranged from 1114 to 2523 a year with an average of 1760. Between 1995 and 2000 the range was from 1134 to 1816 with an average of 1442. A slight drop, but nothing significant. If they were shrimping somewhere else, they were still landing in Escambia County. I recently had a conversation about this with Bob Jackson, one of my citizen science volunteers. He moved here around 2000 and remembered shrimp boats still being on the bay at that time. Some may have moved due to the net ban, but not all. The shrimping was still on.
In 2002 the landings did take a significant drop – 835 landings that year. The first time they were below 1000/year since the records were kept in 1984. In 2003 they dropped further to 453 and the decline has continued ever since. Where were they landing their shrimp? Were they still shrimping? I do not know.
Jimbo asked the question “when did the surge of foreign imports begin?” Good question. We know now that at least 80% of the seafood consumed in Florida is imported. When did this move from local to import make this big swing? Dr. Ropicki found a world shrimp production graph that showed 2003 as a year with a big increase in aquaculture shrimp. Aquaculture accounted for 28% of global shrimp production in 2000 and 55% in 2010, and that is with wild caught shrimp increasing slightly. The big swing towards aquaculture in 2003 closely mirrors the decline in local wild harvest landings in 2002. This certainly could be a piece of the puzzle.
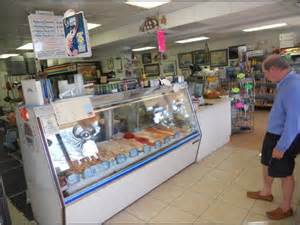
Seafood markets offer local products as well as those from around the world.
Photo: Florida Sea Grant
Did this competition with imports create less effort on the part of local shrimpers?
It certainly had some impact. All of my contacts indicated that the price difference between imported and local seafood made it much more difficult to do business. Add to this the rise in cost of fuel, insurance, and regulations to the industry, some captains did sell their boats and found another line of work.
Looking at the fuel story, Dr. Ropicki found a chart published by the U.S. Energy Information Administration. The chart shows how Gulf coast #2 diesel prices have changed since 1995. Basically from 1995 to 2021 they tripled (200% increase) while general inflation was only about a 75% increase. As many know it is a very fuel intensive industry.
In 2004 Hurricane Ivan hit our area and that certainly would have caused a decline in landings due to damage to boats and docks. The number of landings that year was 388. Between 2004 and 2010 landings steadily declined from 388 to 155/year. The days of 1000+ landings seemed to be over. Many shrimpers lost their boats during the storm and just found another line of work.
Hurricanes are one reason some shrimpers have left the business.
Photo: Rick O’Connor
To add fuel to the fire, in 2010 the Deepwater Horizon oil spill occurred. That year there were only 85 landings in Escambia County, the first year we had less than 100. But we understand why – no shrimping occurred with oil in the water. Many shrimpers still in the business were hired to help clean up the spill, and did make money doing it, but they were not landing shrimp.
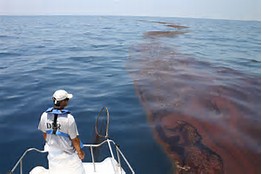
The BP Oil Spill was one of the worst natural disasters in our country’s history.
Photo: Gulf Sea Grant
In 2011 landings returned to 187 for the year and even up to 235 in 2012, but since there has been again a steady decline. In 2017 we went below 100 landings again. Between 2017 and 2019 the landings in Escambia County were 66, 53, and 70 respectively – the lowest ever. FAR below the 1000-2000 landings in the 1980s and 1990s.
Further discussion with my contacts yielded another trend. Commercial fishing historically was a family venture. Families worked the boats and sons took over the business from their fathers. That seems to have stopped. One shrimper who did talk to me said at one point we had between 40-50 boats in our fleet, now there are 11 and their kids want nothing to do with the business. As one of the contacts mentioned “they would rather work with their brains than their backs”.
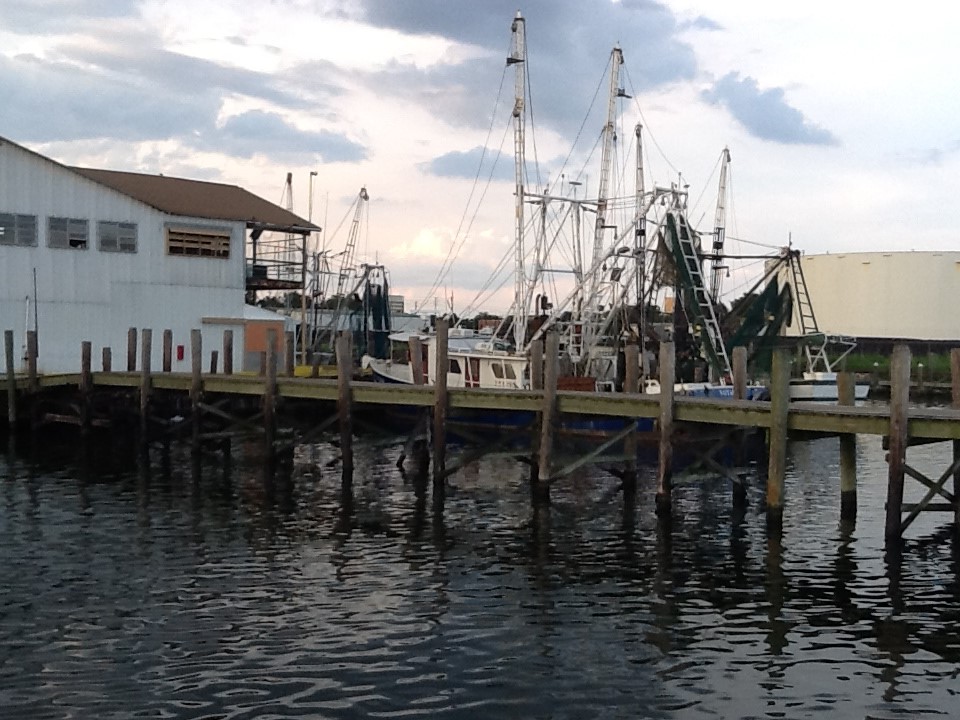
Commercial seafood in Pensacola has a long history.
Photo: Rick O’Connor
In Alabama many families actually lived on their boats and the entire family would go out when the shrimping was on. I was told they do not see this anymore. There are still some bay shrimpers who sell their catch along the Hwy 90 causeway crossing Mobile Bay, and they seem to be doing well, but there are fewer of them. I was also told that many of the Gulf shrimp boats in Alabama have been sitting idle at dock for several years, many are up for sale, and it has been primarily foreign businesses buying them. There were once 120 Gulf shrimp boats in the fleet at Bon Secour Seafood, now there is one. I recently heard a Pensacola shrimper who made port in Bayou Chico – just sold his boat this year.
Dr. Ropicki also shared data on price for shrimp. Could this play a role in this story?
Most commercial seafood products have seen an increase in purchase price at the dock, but not shrimp. Checking the state records for price/pound for brown shrimp in Escambia County found some interesting trends. Between 1985 and 2020 the average price paid for their harvest was between $1.50 and $2.00 a pound. At least once each decade the price went to $2.00 or more per pound – but only ONCE each decade. In that time the number of years where the price dropped BELOW $1.50 per year steadily increased. Between 1985-89 the price dropped below $1.50 only once. Between 1990-1999 it never dropped below. Between 2000-2009 it dropped below $1.50/lb. six times. This happened again between 2010-2019 – six times. In 2006 local shrimpers only got $1.01/pound for the work – the lowest in this data set. If you look at the average price a shrimper received for their brown shrimp harvest by decade you see…
1985-89 – $1.82
1990-1999 – $1.78
2000-2009 – $1.58
2010-2019 – $1.54
A steady decline over time. Along with storms, regulations, fuel costs, lack of labor, and competition with imports, you can add price to the “soup of problems”.
I was curious if a similar scenario was playing out in Apalachicola. Apalach is known for their oysters, but there is a sizable shrimping industry there as well – it’s a seafood town. I asked our Sea Grant Agent over there, Erik Lovestrand, about similar trends. He did not have any data but was reasonably certain that the number of boats working out of their docks had significantly declined over the years.
Known for their oysters, Apalachicola is also a shrimping town.
I decided to take a look at the landing numbers for Apalachicola. I looked at brown shrimp.
Between 1985-1989 they averaged 909 landings – less effort for this species than in Escambia County.
Between 1990-1999 there averaged 1546 landings a year.
Between 2000-2009 the average was 382.
And between 2010-2020 it was 68.
The pattern looks similar albeit the number of landings was brown shrimp were less in Apalachicola. However, I did see another interesting difference – price paid per pound. In Escambia over this time the average price was $1.66/pound. It only went to $2.00/pound once decade and began to drop below $1.50 frequently over the last 20 years. However, in Apalachicola the average price was $2.00 rarely going below that and even reached $3.32/pound in 2014. They pay more for brown shrimp in Apalach. I am not sure if that impacted landings locally. The data suggests that it did not, but it is interesting.
And then, another thought came to mind. From the Big Bend of Florida south to Key West pink shrimp, not browns, are the target species. What did the pink shrimp landings look like? Did Escambia make a switch?
The results were interesting. Between 1985-2021 the landings of pink shrimp in Apalachicola occurred every year. The total number of landings was 6431 and averaged 174/year. The price was good, ranging from $1.80 to $3.23/pound, the average price was $2.39. The number of trips per year never broke 500 and the trend on landings shows a decline over this time period. But the price was decent for those who chose to target this shrimp.
In Escambia County the effort was low. They did not continuously land pink shrimp each year, but rather over short periods. Landings occurred between 1986-1991. Then nothing until 1997. Then another short period from 2000-2003. Then nothing again until 2014, which ran until 2020. Other than in 2000, the number of trips for pink shrimp were less than 10 a year (they were 10 in 2000). The average number of trips since 1986 was 4/year – less than Apalachicola and much less that the brown shrimp harvest here.
However, the price per pound was much higher for pink shrimp in Escambia. It ran from $1.59 to $5.00/pound! The average price was $2.77 (more than what they were paying in Apalachicola). Though Escambia landings were not big for pink shrimp, it was certainly more profitable than brown shrimp.
Pink shrimp are very popular.
All of the above played play a role in the decline of the local shrimping industry. However, if you visit a local seafood market you will find shrimp. Some is still local, local landings may be down, but they have not stopped. Some are local in the since they were harvested elsewhere in the Gulf of Mexico and trucked to us. But as we mentioned, cheaper imports are easier to get. So, it does not seem we are going to run out of shrimp, just out of shrimpers. For some it is unnerving that we will be dependent on other countries for our seafood, but we will have seafood.
Which brings up the topic of aquaculture. This is for another article. Until then, we do encourage you to enjoy seafood, it is a healthy source of protein. We will see where the local industry heads in the next decade, but you can still get shrimp, and I have seen nice looking ones in there. Enjoy them.
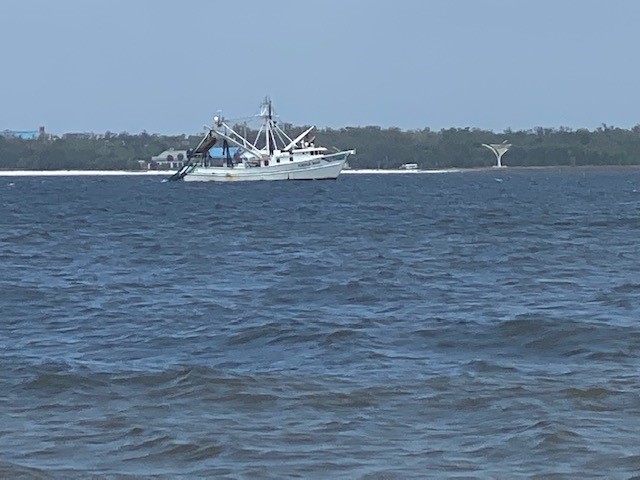
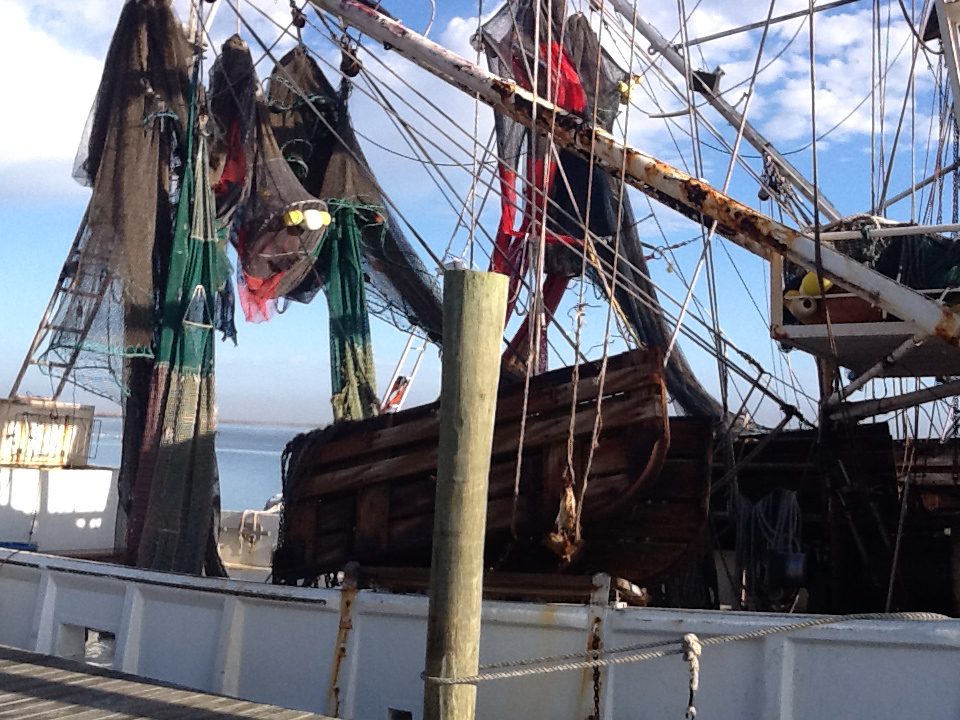
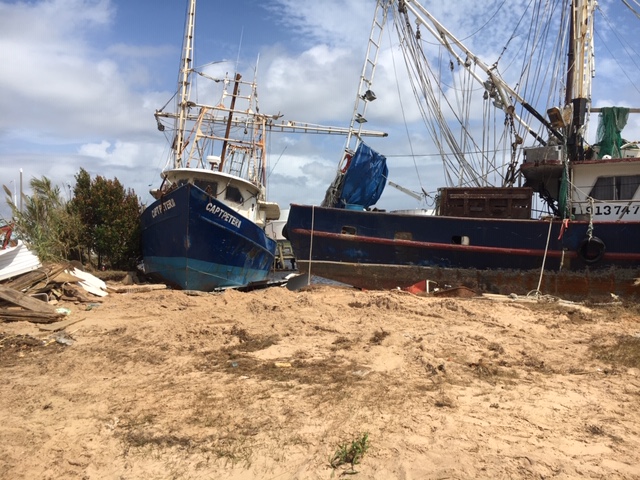
A rare site – a shrimping landing its catch in Pensacola Bay in 2022.
Note: After completing this article I had a meeting in Bayou LaBatre AL. I was told that shrimping industry there was hanging on… barely. Also, the high school teacher I met with said he was not aware of one kid in the school who planned to become a shrimper… this is in Bayou LaBatre Alabama.
Special thanks to
Bob and Teresa Pitts – Perdido Bay Seafood
Jimbo Meador
Dr. Andrew Ropicki – University of Florida / Florida Sea Grant
Erik Lovestrand – UF IFAS Extension / Florida Sea Grant / Franklin County
Bob Jackson
by Rick O'Connor | Mar 11, 2022
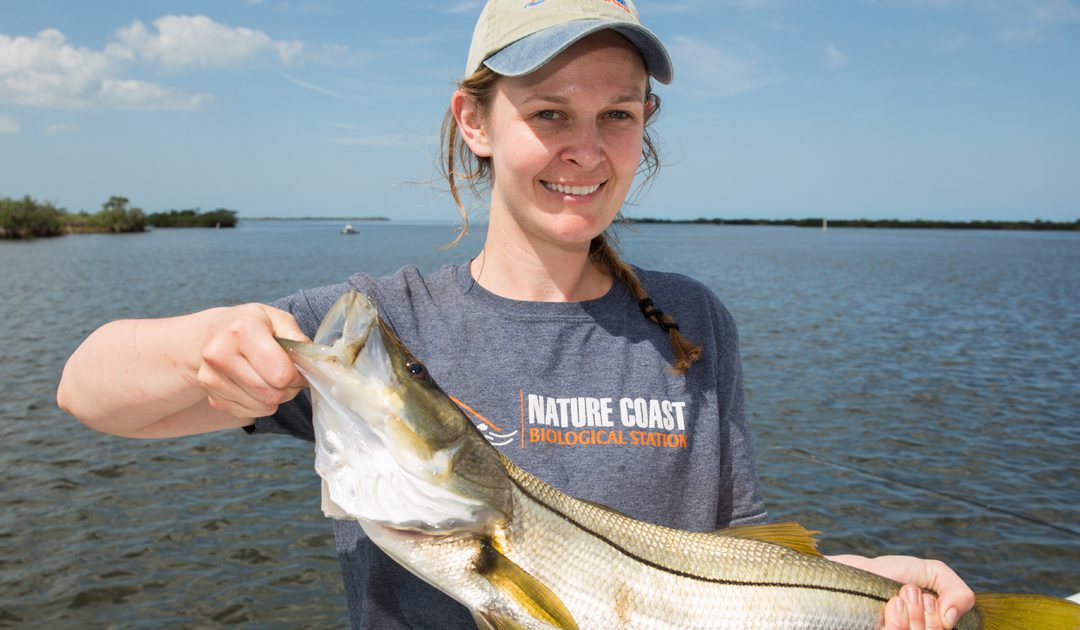
Snook… Wait did you say Snook in the Florida panhandle?
Yep… they are not common, but they have seen here.
For those who do not know the fish and do not understand why seeing them is strange, this is a more tropical species associated with tarpon. In the early years of tourism in Florida tarpon fishing was one of the main reasons people came. Though bonefish and snook fishing were not has popular as tarpon, they were good alternatives and today snook fishing is popular in central and south Florida… but not in the north.
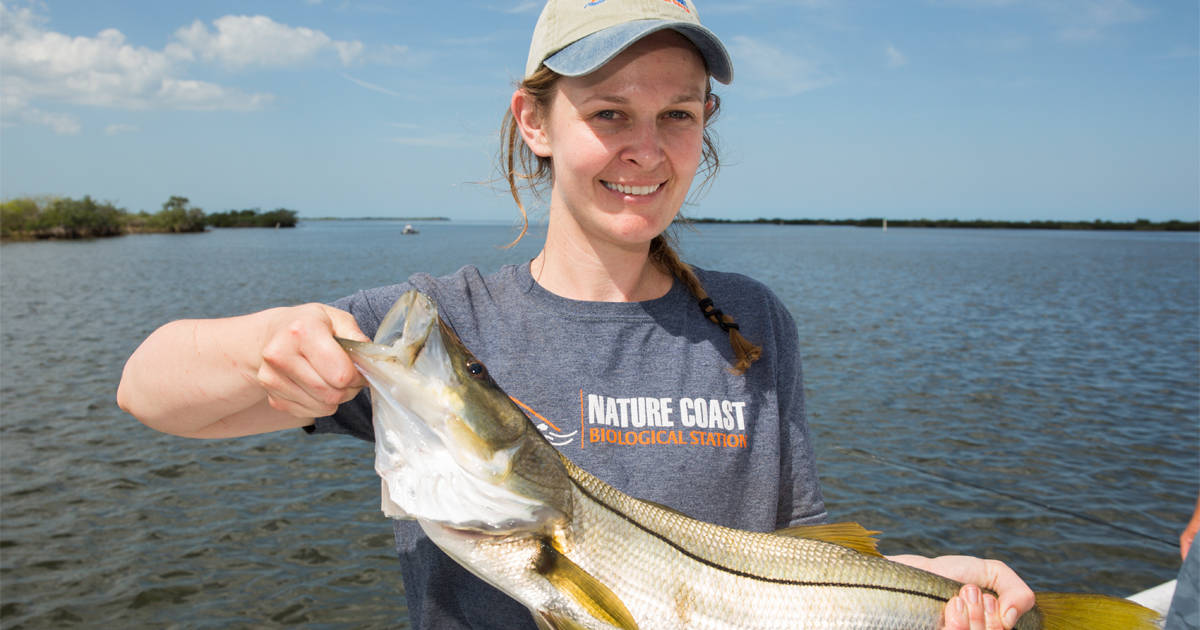
This snook was captured near Cedar Key. These tropical fish are becoming more common in the northern Gulf of Mexico.
Photo: UF IFAS
This fish is extremely sensitive to cold water, not liking anything under 60° F. They frequent the same habitats as tarpon, mangroves and marshes. They are euryhaline (having a wide tolerance for salinity) and can be found in freshwater rivers and springs. Actually, near river mouths is a place they frequent. The younger fish are more often found within the estuaries and adults have been found in the Gulf of Mexico. Again, this is a more tropical fish with records in Florida north of Tampa being rare. In the western Gulf the story is the same, almost all records are south of Galveston, Texas. Until recently…
Hoese and Moore1 cite a paper by Baughman (1943) that indicated the range of the fish had actually moved further south. One reason given was the loss of the much-needed salt marsh and mangrove habitats from human development. But in recent years there have more reports north of Tampa. Purtlebaugh (et al.)2 published a paper in 2020 indicating an increase in snook captured in the Cedar Key area of the Big Bend beginning in 2007. At first records only included adults, and the thought was these were “wayward” drifters in the region. But by 2018 they were capturing fish in all size classes and there was evidence of breeding going in the area. The range of the fish seemed to be moving north. The study suggests they still need warm water locations to over winter, and, like the manatees, springs seem to be working fine. But another piece of the explanation has been the reduction of hard freezes during winter in this part of the Gulf. Climate change may be playing a role here as well.
There seems to be other tropical species dispersing northward in a process some call “tropicalization” including the mangroves. There have been anecdotal reports of snook near Apalachicola where mangroves are becoming more common, and I know of two that were caught in Mobile Bay. There are mangroves growing on the Mississippi barrier islands as well. While explaining this during a presentation I was doing for a local group, a gentleman showed me a photo of a snook on his phone. I asked if he caught it in the Pensacola area. He replied yes. When I asked where, he just smiled… 😊 He was not going to share that. Cool.
There is no evidence that snook have established breeding populations are in our waters. Especially after this winter with multiple days with temperatures in the 30s, it is unlikely snook would be found here. But it is still interesting, and we encourage anyone who does catch one, to report it to us.
References
1 Hoese, H.D., Moore, R.H. 1977. Fishes of the Gulf of Mexico; Texas, Louisiana, and Adjacent Waters. Texas A&M Press. College Station Tx. Pp 327.
2 Purtlebaugh CH, Martin CW, Allen MS (2020) Poleward expansion of common snook Centropomus undecimalis in the northeastern Gulf of Mexico and future research needs. PLoS ONE 15(6): e0234083. https://doi.org/10.1371/journal.pone.0234083.
by Laura Tiu | Jan 27, 2022
February is American Heart Month and when I think of heart, my thoughts turn to seafood. Perhaps that is unusual, but I love seafood and the fact that the American Heart Association recommends 1 to 2 seafood meals a week fits right into my gastronomic plans. More seafood on your table can improve your overall health and help fight off infections.
During the recent pandemic, an increase in home cooking has resulted in a rise in seafood consumption. Consumers rediscovered frozen and canned fish, a trend that continues today. Canned tuna and fish stick consumption rose as home cooks perfected their tuna melts and fish sandwiches. Home chefs throwing fish steaks, aluminum wrapped fillets, shrimp, and even oysters on the grill have raised the bar on home-cooked meals.
Other new trends on the horizon are more innovative. How do Atlantic salmon hot dogs sound? High-end canned and jarred seafood, think canned smoked oysters, are gaining in popularity as well as being quick and easy to prepare. Nose to tail is another trend that promotes maximum utilization of the whole seafood product. Cooking fish whole or tanning fish skins for an upscale leather are new ways to enjoy seafood. Want to try something new? Sea vegetables, including kelp and other seaweed are taking the culinary world by storm because of their great taste and nutritional benefits.
Let us not forget about our furry friends. Sustainable seafood-based pet treats are gaining quite a bit of market share. Seafood has one of the lowest environmental footprints of any protein, and as such makes a great, healthy, sustainable snack for fido.
Sustainable seafood, both wild and farm-raised, is an option that is good for your heart and good for the planet. Buying sustainably harvested or raised seafood is one way you can do your part to protect the ocean and ensure plentiful seafood for the future. Make a resolution to try a new product, recipe, or cooking method during this month to celebrate a healthy heart.

Cooked red snapper (Photo credit: L. Tiu)
by Rick O'Connor | Jan 27, 2022
Members of the family Poeciliidae are what many call “livebearers”. Live bearing meaning they do lay eggs as most fish do, but rather give birth to live young. But this is not to be confused with live-bearing you find in mammals – which is different.
Most fish lay eggs. The females and males typically have a courtship ritual that ends with the female’s eggs (roe) being laid on some substrate, or released into the water column, and the male’s sperm (milt) are released over them. Once fertilized the gelatinous covered eggs begin to develop.
Everything the developing young need to survive is provide within the egg. The embryo is suspended in a semi-gelatinous fluid called the amnion. Oxygen and carbon dioxide gas exchange occurs through this amnion and through the gelatinous covering of the egg itself. Food is provided in the form of yolk, which is found in a sac attached to the embryo. There is a second sac, the allantois, where waste is deposited. When the yolk is low and the allantois full – it is time to hatch. This usually occurs in just a few days and often the baby fish (fry) are born with the yolk sac still attached. Parental care is rare, they are usually on their own.
With “livebearers” in the family Poecillidae it is different.
The males have a modified anal fin called a gonopodium. They fertilize the roe not externally but rather internally – more like mammals. The fertilized eggs develop the same as those of other fish. There is a yolk sac and allantois, and the embryo is covered in amnion within the gelatinous egg covering. But these eggs are held WITHIN the female, not laid on the substrate or released into the water column. When they hatch the live fry swim from the mother into the bright new world – hence the term “livebearer”.
There are advantages to this method. The eggs are protected inside the mother, and she obviously provides parental care to her offspring. However, this does make her much slower and an easier target for predators. There is some give and take.
This differs from the “live-bearing” of most mammals in that there is still an egg. Mammals do still have a yolk sac but feeding and removing waste is done THROUGH THE MOTHER. Meaning the embryo is attached to the mother via an umbilical cord where the mother provides food and removes waste trough her placenta. There is no classic egg in this case. I say most mammals because there are two who live in Australia that still do lay eggs – the platypus and the spiny anteater, and the marsupials (kangaroos and opossums) are a little different as well – but marsupials do no lay eggs.
Biologists have terms for these. Oviparous are vertebrates that lay eggs – such as fish, frogs, turtles, and birds. Ovoviviparous are vertebrates that produce eggs but keep them within the mother where they hatch – such as some sharks, some snakes, and the live bearing fish we are talking about here. Then there are the viviparous vertebrates that do not have an egg but rather the embryo is attached, and fed by, the mother herself – like most mammals.
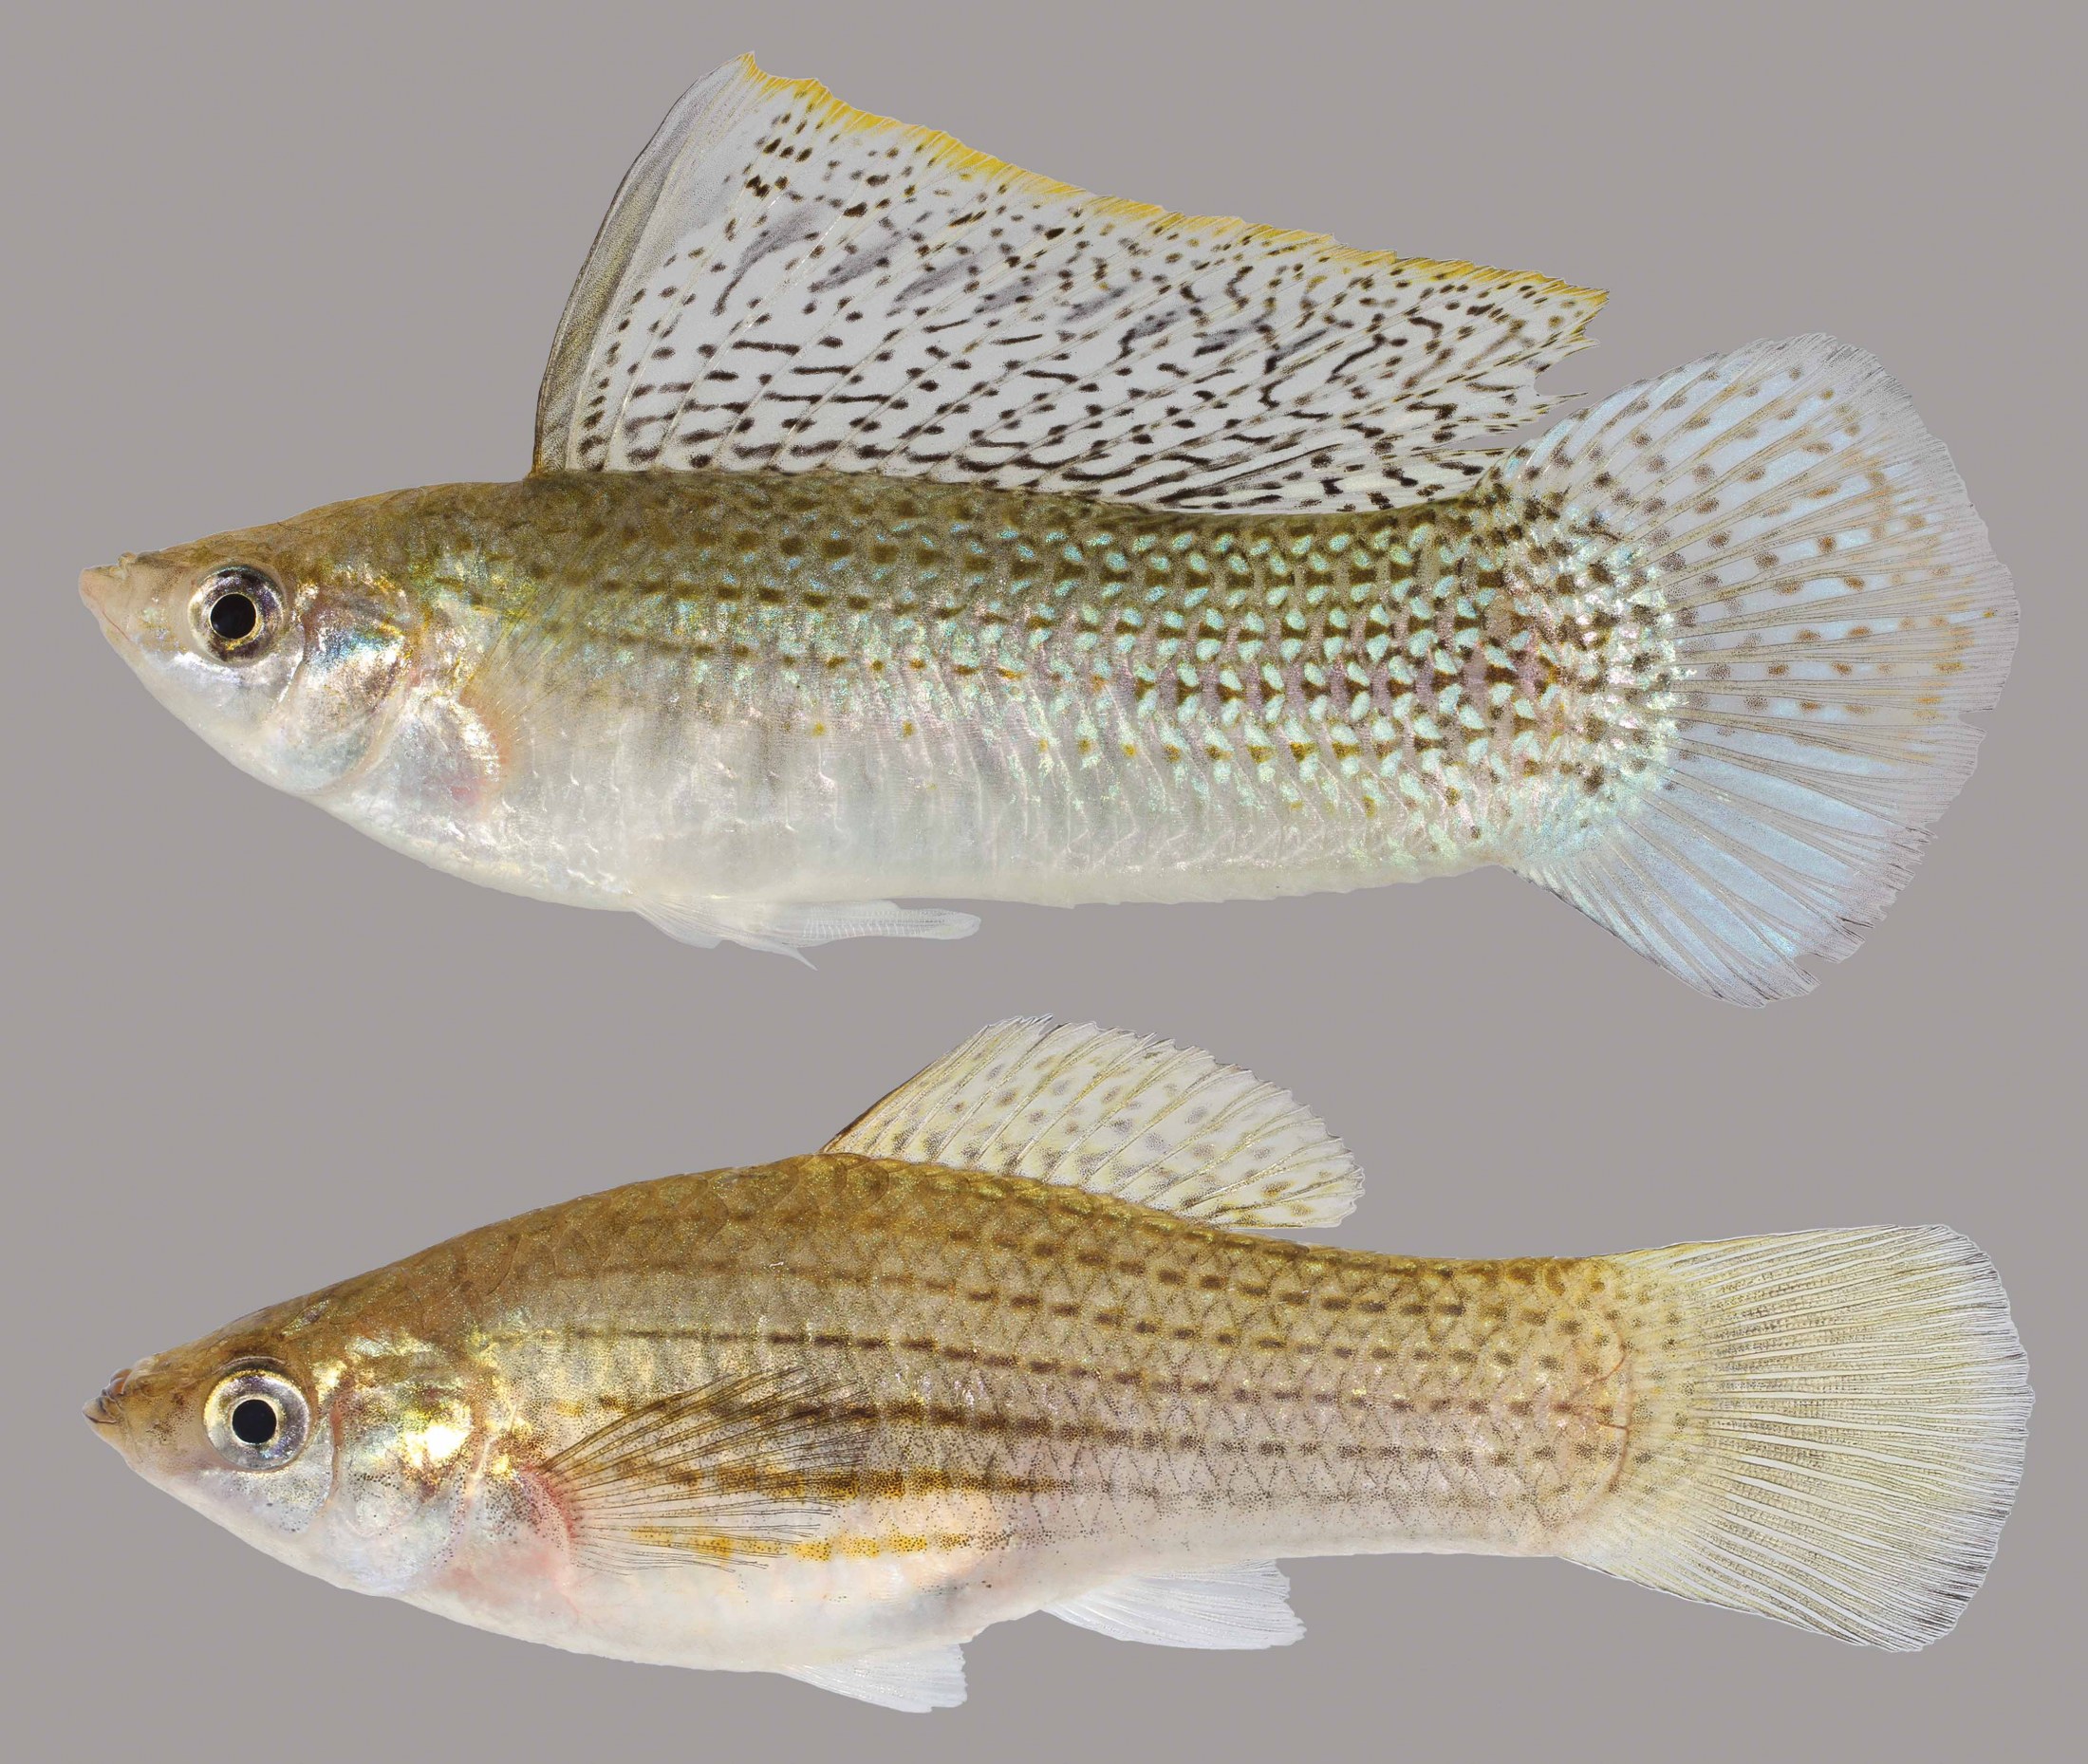
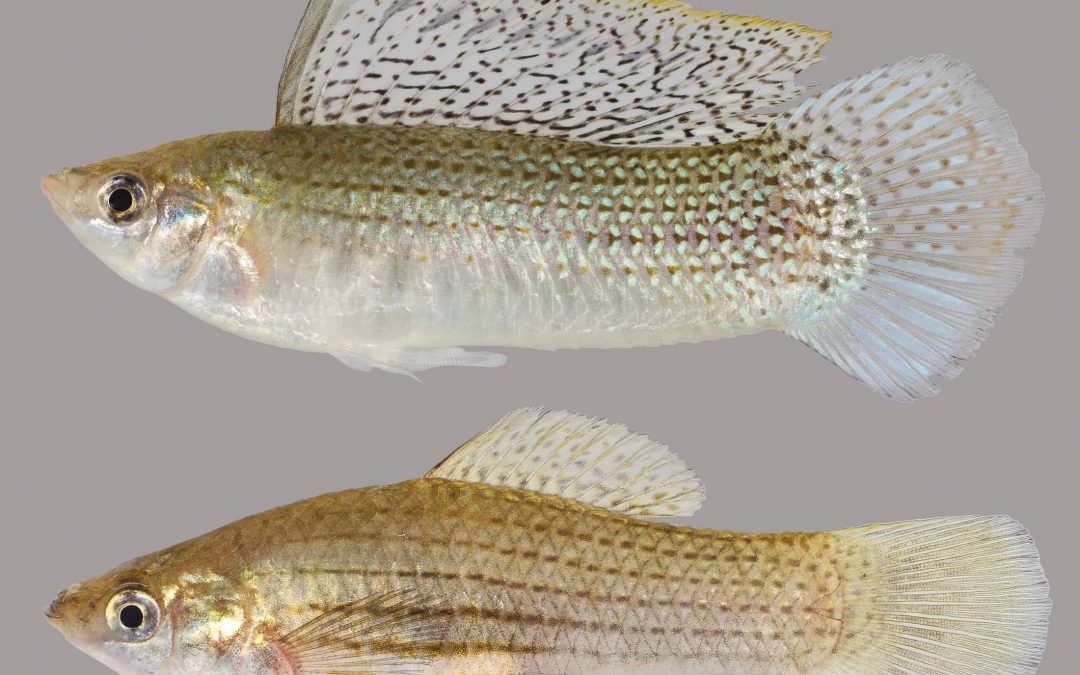
Sailfin Molly. The male is the fish above with the large “sailfin”. Note the gonopodium on his ventral side.
Photo: University of Florida
The livebearers of the family Poeciliidae are ovoviviparous. They are primarily small freshwater fish that are very popular in the aquarium trade. But there are two species that can tolerate saltwater and enter the estuaries of the northern Gulf of Mexico: the sailfin molly and the mosquitofish.
The Sailfin Molly (Poecilia latipinna) is the same fish sold in aquarium stores as the black molly. The black phase is quite common in freshwater habitats, but in the estuarine marshes the fish is more of a gray color with lateral stripes that is made up of a series of dots. They are short-stout bodied fish and the males possess the large sail-like dorsal fin from which the species gets its common name. The females resemble the males albeit no large sailfin and most found are usually round and full of developing eggs. They are very common in local salt marshes and often found in isolated pools within these habitats. The biogeographic range of this species is restricted to the southern United States, reported from South Carolina throughout the Gulf of Mexico. One would guess temperature may be a barrier to their dispersal further north along the Atlantic seaboard.
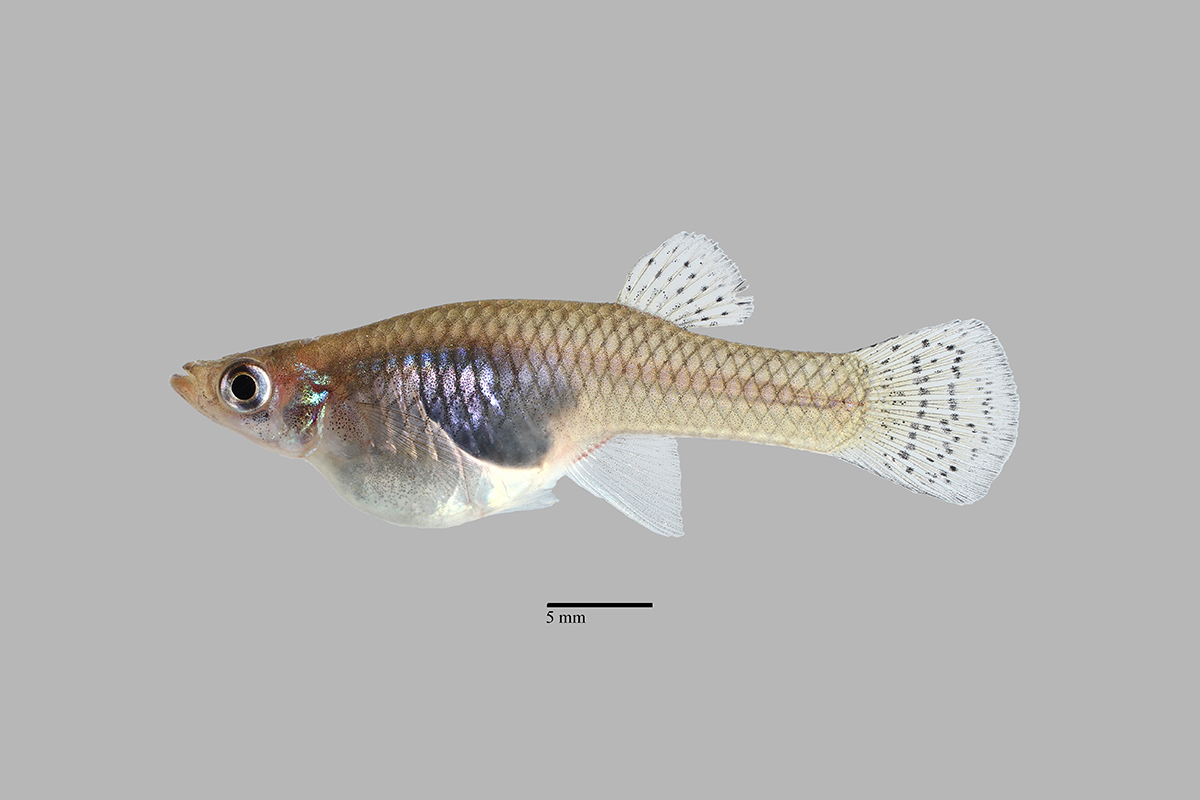
The mosquitofish.
Photo: University of Florida
The Mosquitofish (Gambusia affinis) is familiar to many people whether they know it or not. Those who know the fish know they are famous for the habit of consuming mosquito larva and some, including our county mosquito control unit, use them to control these unwanted flying insects. For those who may they are not familiar with it, this is the fish frequently seen in roadside ditches, ephemeral ponds that show up after rainstorms, retention ponds, and other scattered bodies of freshwater within the community. Most who see them call them “minnows”. There is always the question as to “where did they come from?” You have a vacant lot – it rains one day – these small fish show up – where did they come from? The same can be said for community retention ponds. The county comes in a digs a hole – it rains one day, and the retention pond fills – and there are fish in it. One explanation to their source is the movement of fish by wading birds, where the fish incidentally become attached to their feet. Again, they are often released intentionally to help control local mosquito populations. This fish is found in our coastal estuaries but does not seem to like saltwater as well as the sailfin molly. It is found in cooler water ranging throughout the Gulf and as far north as New Jersey.
Both of these fish make excellent aquarium pets, and the sailfin molly in particular can be beautiful to watch.
Reference
Hoese, H.D., Moore, R.H. 1977. Fishes of the Gulf of Mexico; Texas, Louisiana, and Adjacent Waters. Texas A&M Press, College Station TX. Pp. 327.
by Rick O'Connor | Dec 22, 2021
2021 Panhandle Terrapin Project Survey Report
Rick O’Connor, Florida Sea Grant, University of Florida / IFAS Extension, Escambia County
SITUATION
The diamondback terrapin (Malaclemys terrapin) is the only resident brackish water turtle in the United States. Ranging from Cape Cod Massachusetts to Brownsville Texas, this turtle is most often found in the salt marsh and mangrove habitats within this range.
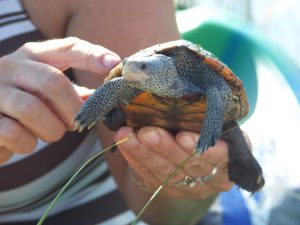
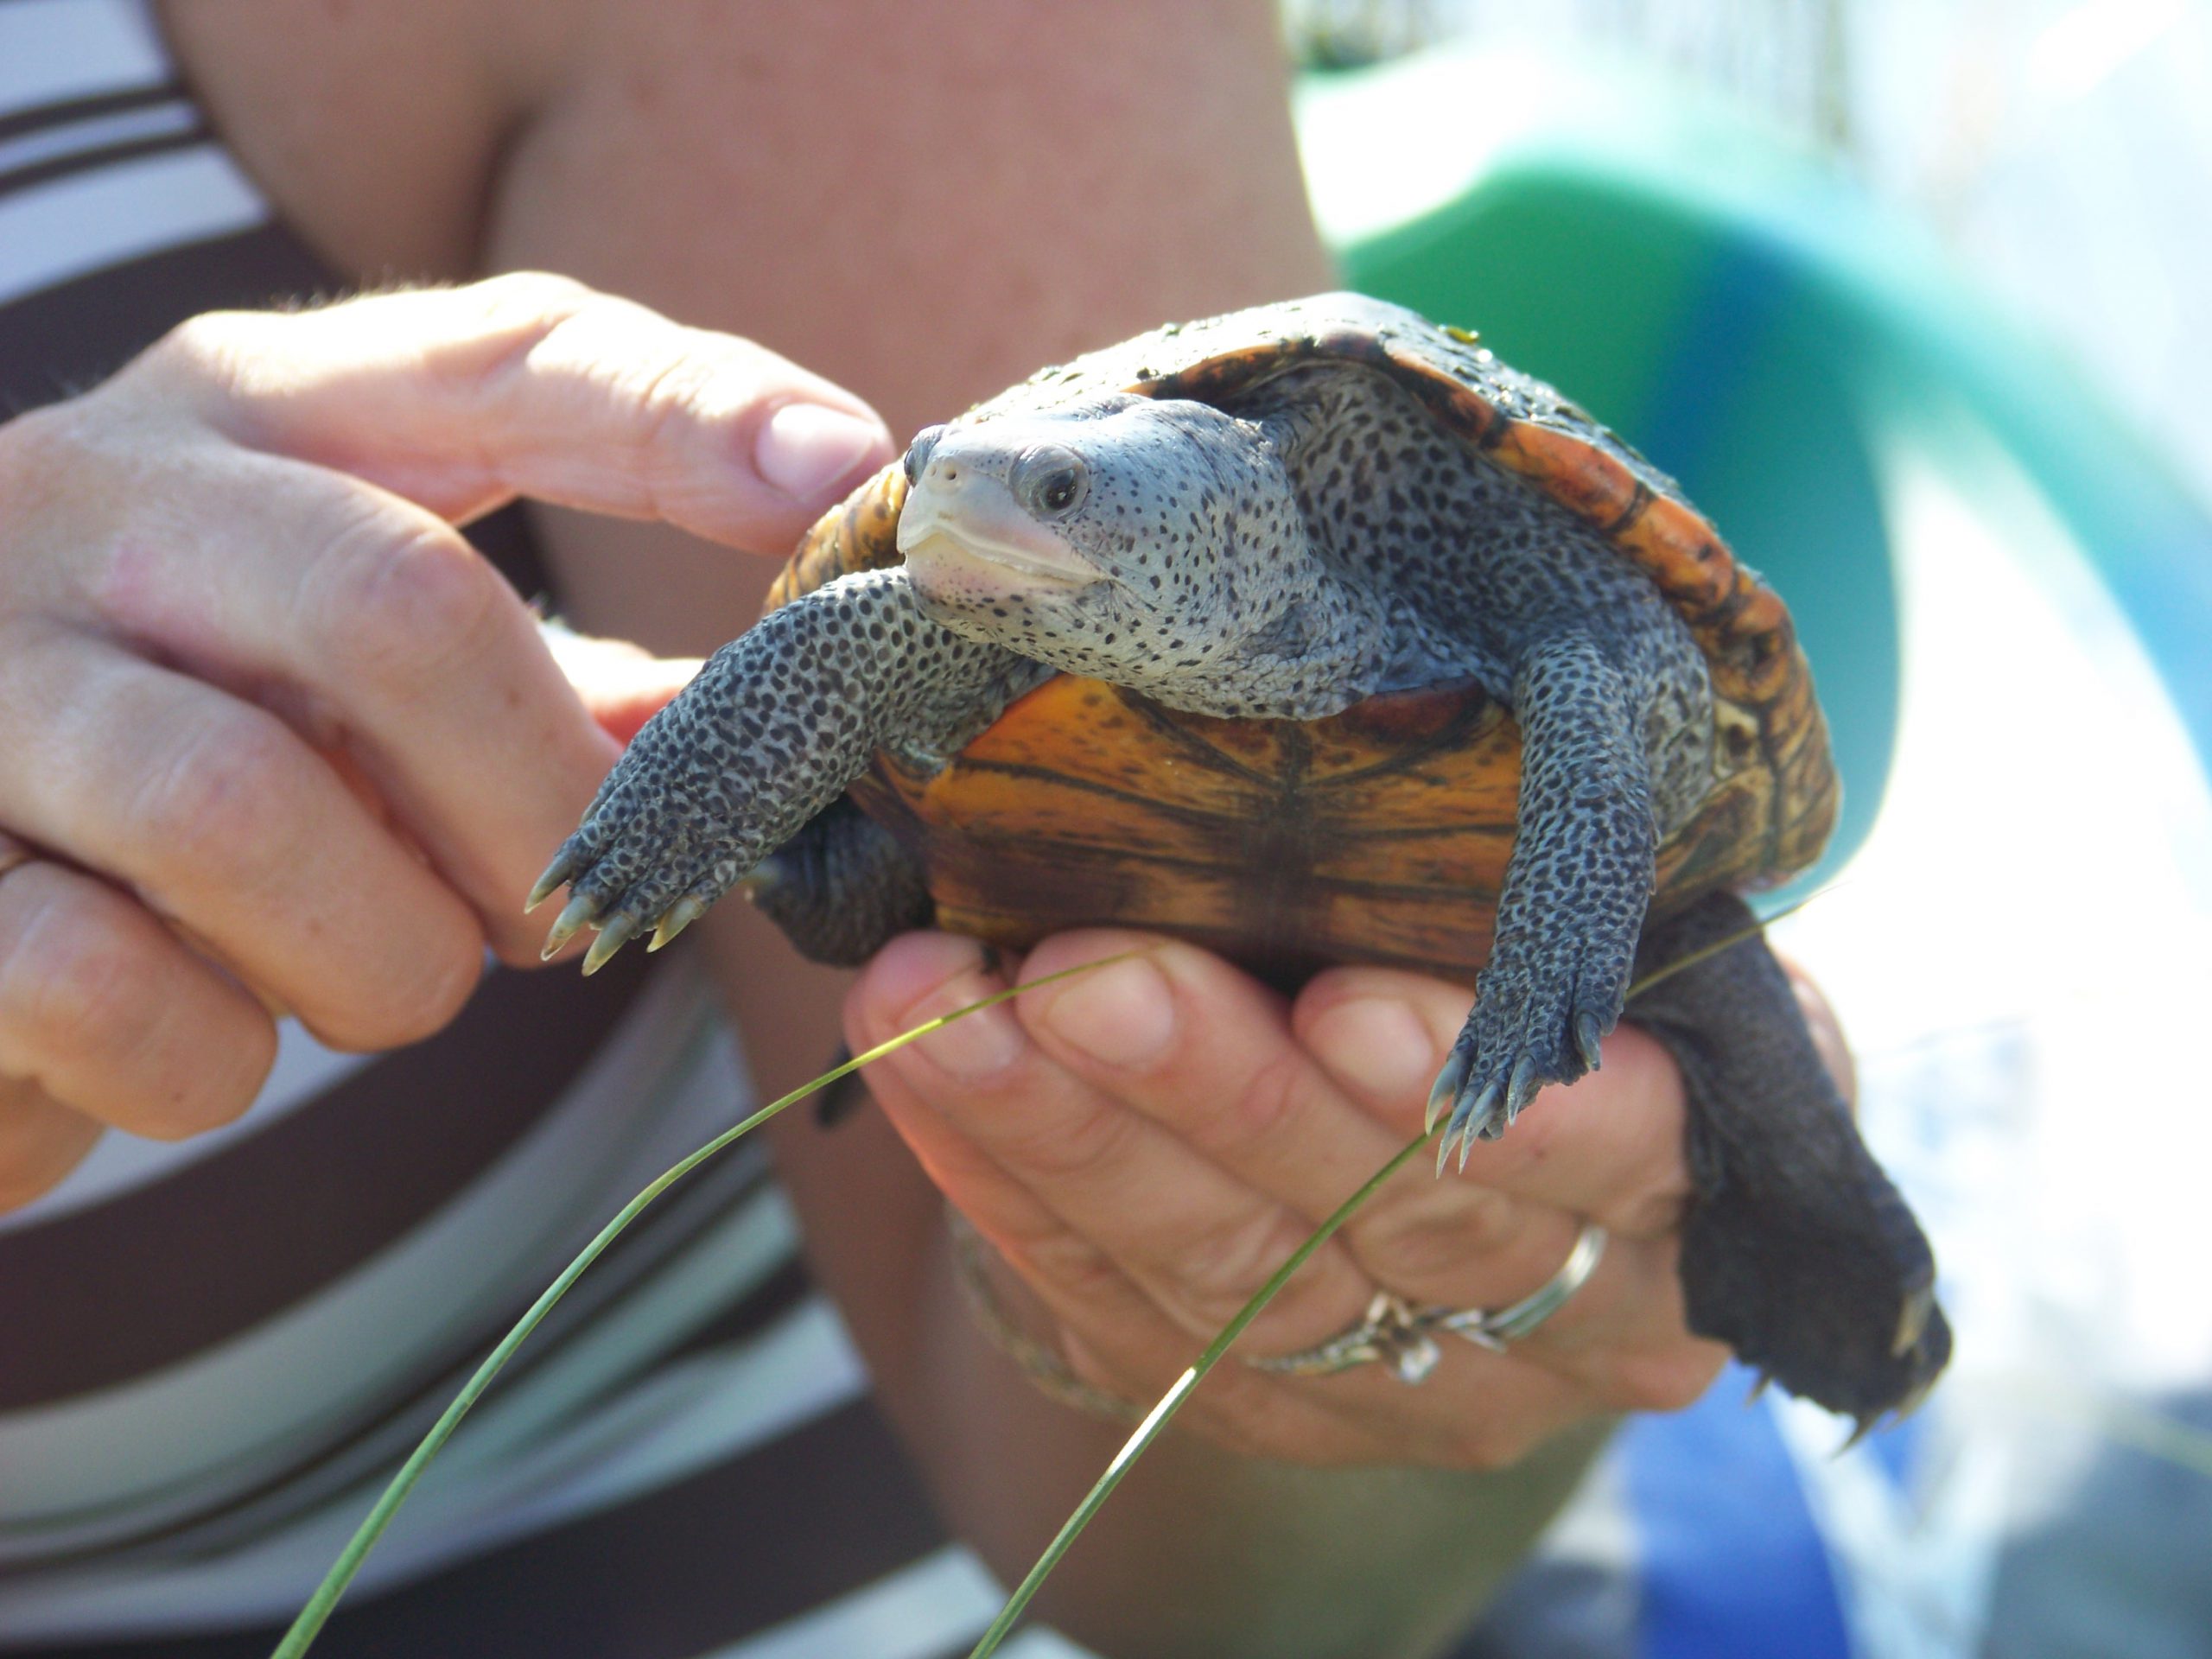
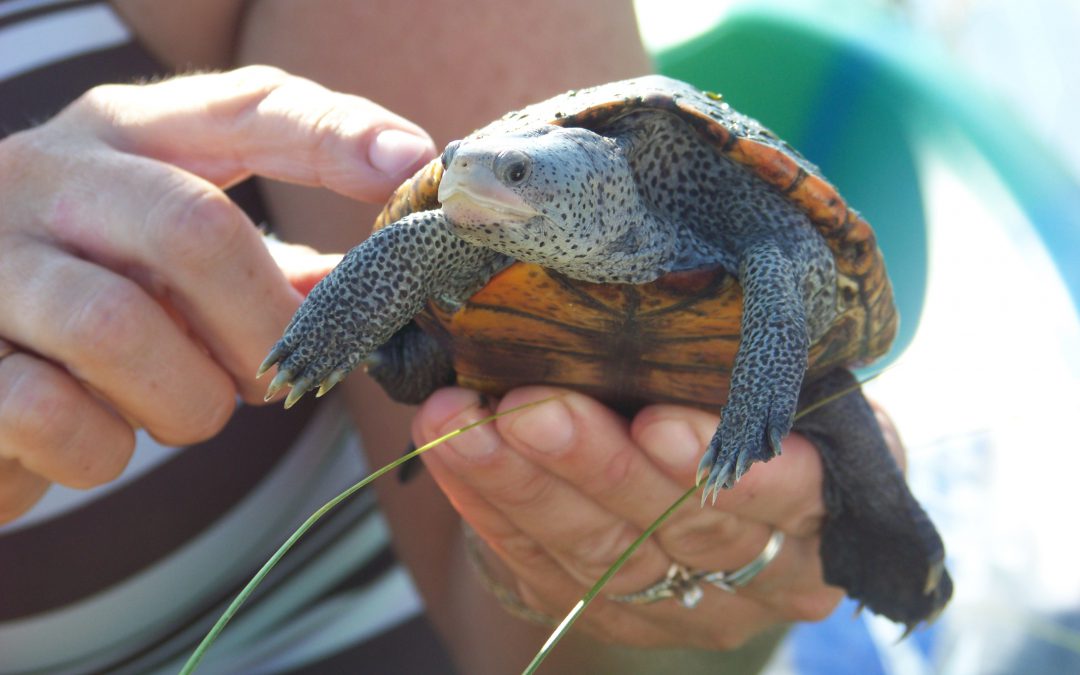
The light colored skin and dark markings are pretty unique to the terrapin.
Photo: Molly O’Connor
Terrapins are medium sized members of the Emydidae family, which includes the cooters, sliders, and box turtles. The carapace length of the larger females is about 10 inches, and she will weigh on average about 20 ounces. Males are smaller, 5-6 inches carapace and about 10 ounces. They are beautifully marked turtles having lighter skin with darker spots or bars. The carapace can have beautiful markings of spots and swirls, many times a brilliant orange in color. Because of this they are popular in the pet trade and illegal pouching is a problem across their range.
There are seven subspecies within this range.
- The northern terrapin ( t. terrapin) can be found from Massachusetts to the Chesapeake Bay area.
- The Carolina terrapin ( t. centrata) is found from the Chesapeake Bay area to the Daytona Beach area of Florida.
- The Florida east coast terrapin ( t. tequesta) is found from the Daytona Beach area to Miami-Dade County.
- The mangrove terrapin ( t. rhizophorarum) is found in the Florida Keys and along the Gulf coast to the Ten Thousand Islands area.
- The ornate terrapin ( t. macrospilota) can be found from the Ten Thousand Island area to Choctawhatchee Bay in the Florida panhandle.
- The Mississippi terrapin ( t. pileata) is found from Choctawhatchee Bay to the Louisiana/Texas state line.
- The Texas terrapin ( t. littoralis) is found along the coast of Texas.
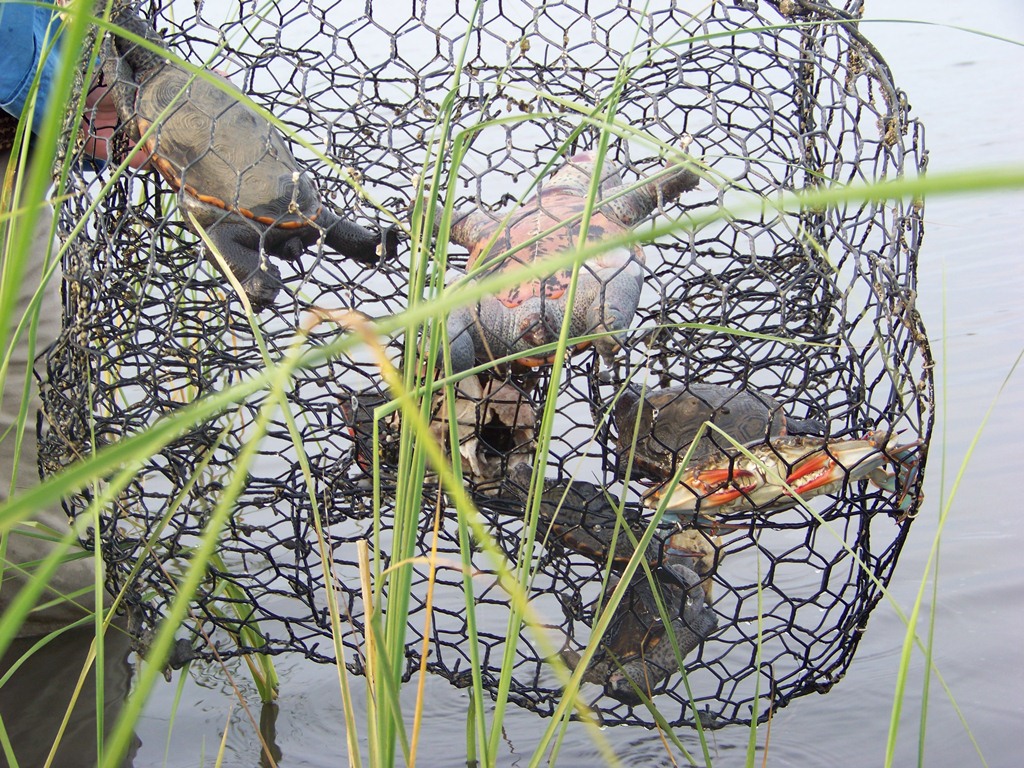
The animal is quite well known in the Chesapeake Bay area where it was harvested in the 19th century as a food source. The popularity of “turtle soup” increased when President Lincoln included it as a local course for state dinners at the White House. The popularity increased the harvest to a point where terrapin farms began to supply the demand, many of these farms were in the south. Eventually the price became too high, and the popularity of the dish waned. At that point research into the animal began in earnest to assess how the commercial harvest had impacted the population. Much of this work was conducted in the early part of the 20th century. By the mid-20th century, a wired crab pot was developed for the harvest of blue crab, a popular fishery in the Chesapeake. Terrapins have a habitat of entering these crab pots and drowning. So, a new threat had emerged. About the same time the automobile was becoming more popular, bridges were being built to connect to barrier islands, and other locations, humans had not visited much before. This activity increased the number of nest predators for terrapins, raccoons being one of the larger problems.
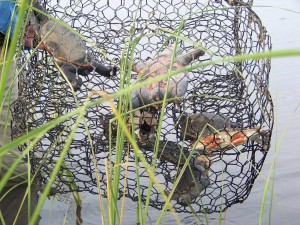
Terrapins in a derelict crab trap (photo: Molly O’Connor)
All of these issues led to more research on terrapin biology and ecology. However, there was one region within their range that very little was known – the Florida panhandle. There were no scientific studies conducted in this part of their range and even their existence there was questioned.
REPSONSE
In response to the question of existence in the Florida panhandle, the Florida Turtle Conservation Trust and the Florida Diamondback Terrapin Working Group, reached out to the Institute of Coastal and Marine Studies (a high school marine science program in Escambia County, Florida). The objective was to have them conduct surveys in suitable terrapin habitat indicating presence/absence of terrapins between Escambia and Franklin Counties. Those surveys began in 2005 and by 2010 had been conducted in all six counties with at least one verified record in each of the six counties (Escambia, Santa Rosa, Okaloosa, Walton, Bay, and Gulf). Terrapins did exist there.
Beginning in 2008 the team began to assess population status. Funding for mark/recapture was not available but a method of assessing relative abundance was being used in Mississippi and was chosen for the Florida panhandle. The method had made several assumptions –
- Each mature female nests every nesting season
- Each nesting female will lay more than one clutch each season but would not lay more than one within a 16-day period.
- The team had identified all terrapin nesting beaches in the region.
Based on this method, surveys were broken into 16-day intervals beginning April 1 and ending on July 1 (peak nesting period). Each track, or depredated nest, was counted and all sign of the track or nest removed so that it would not be recounted within that 16-day period. Each track would then represent a different female and over time the number of nesting females could be determined. Going on the argument that the sex ratio was 1:1 a relative abundance of adult terrapins could be determined. A study conducted in the Big Bend area of Florida by Suarez (Suarez, 2015) suggested the sex ratio was 1:3 in favor of males. A more recent study from the eastern panhandle conducted by Catizone (unpublished) suggests a 1:5 ratio in favor of males. Based on this we could develop a range of relative abundance from 1:1 to 1:5.
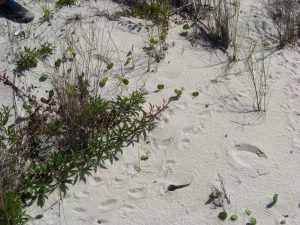
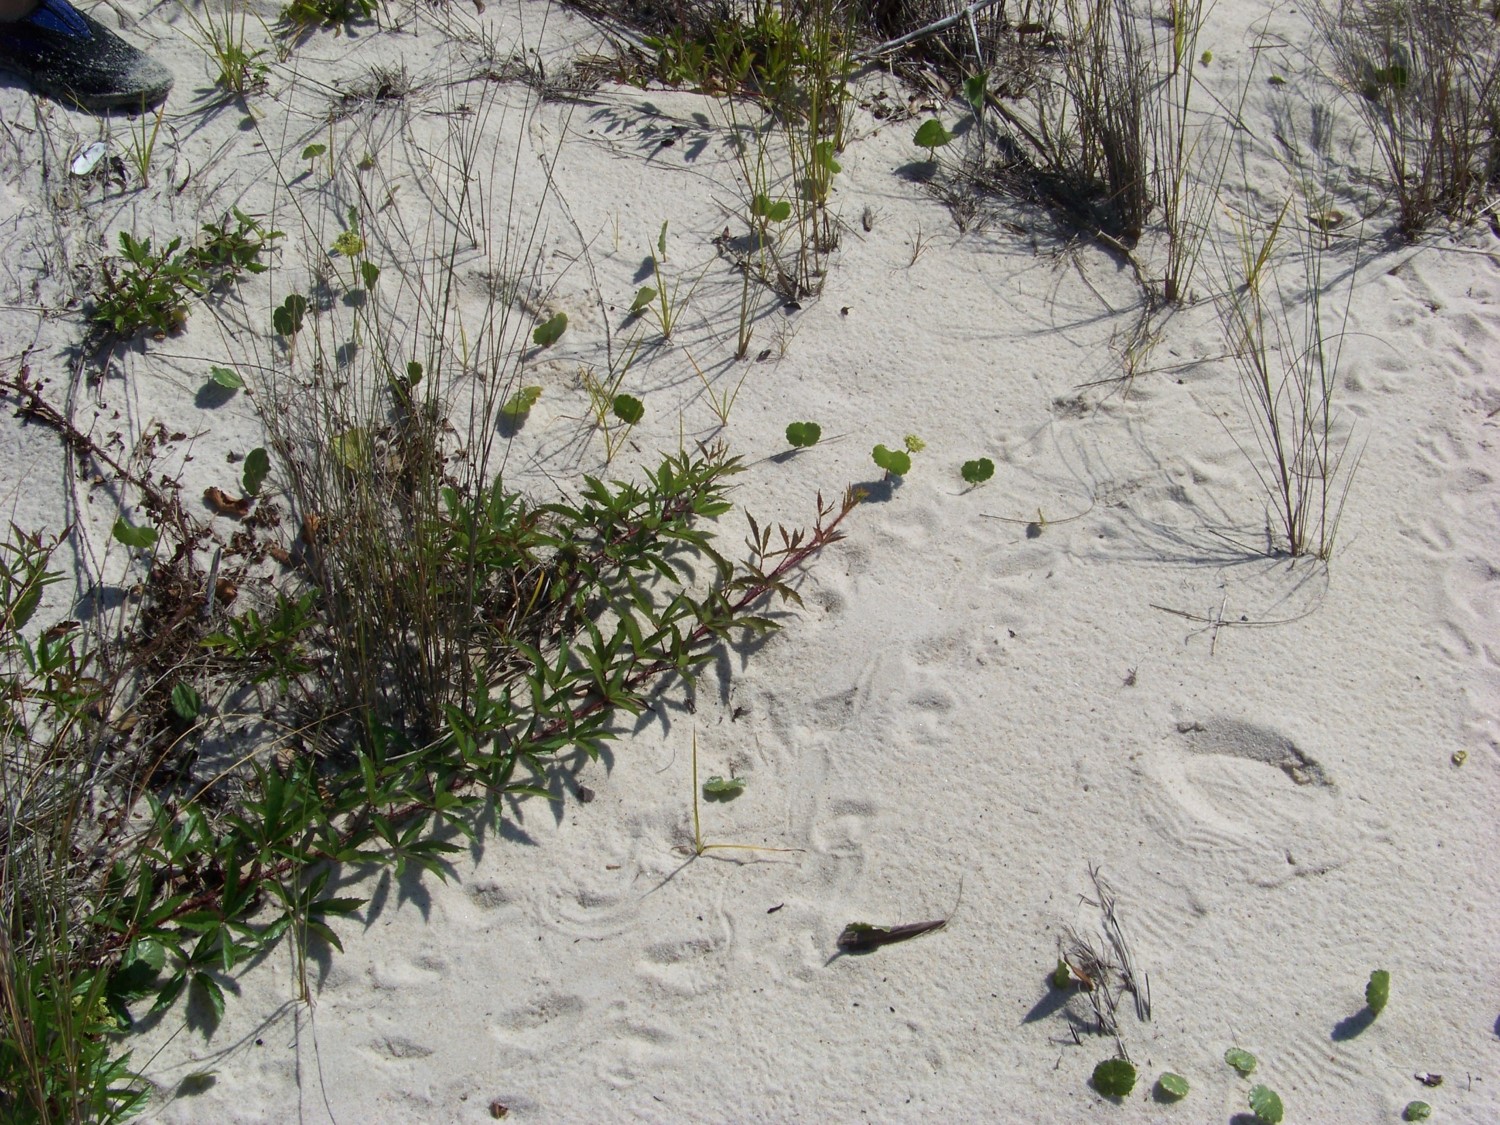
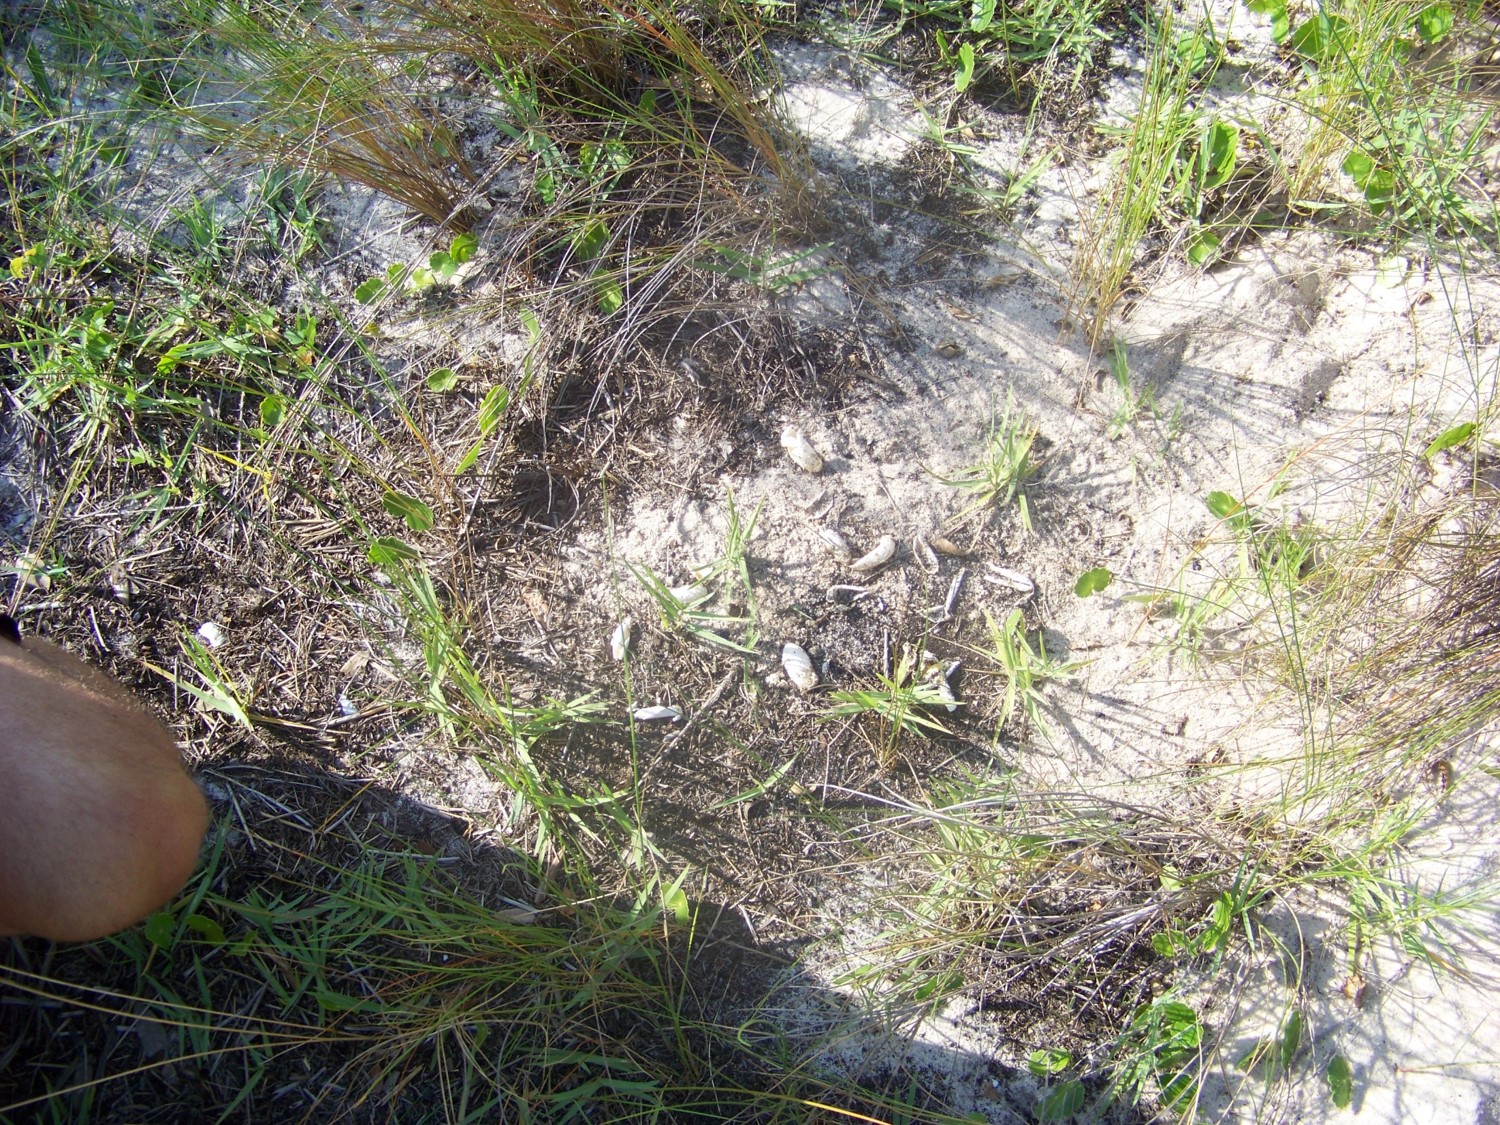
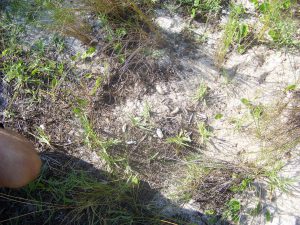
Note the track on this beach.
Photo: Rick O’Connor
Egg shells indicate a depredated nest.
Photo: Rick O’Connor
Another metric used to measure relative abundance was a 30-minute head count. The team would sit in kayaks within the ponds where adults resided and count the number of heads in that time period. Again, this does not indicate a population but a relative abundance within that location.
Finally, in 2008 the team began to deploy modified crab traps to capture terrapins for a potential mark/recapture study, marking using a scute notching method. The traps were modified so that a captured terrapin would be able to surface and breath. These traps were set in potential adult residing locations for a five-day period beginning on a Monday and ending on a Friday.
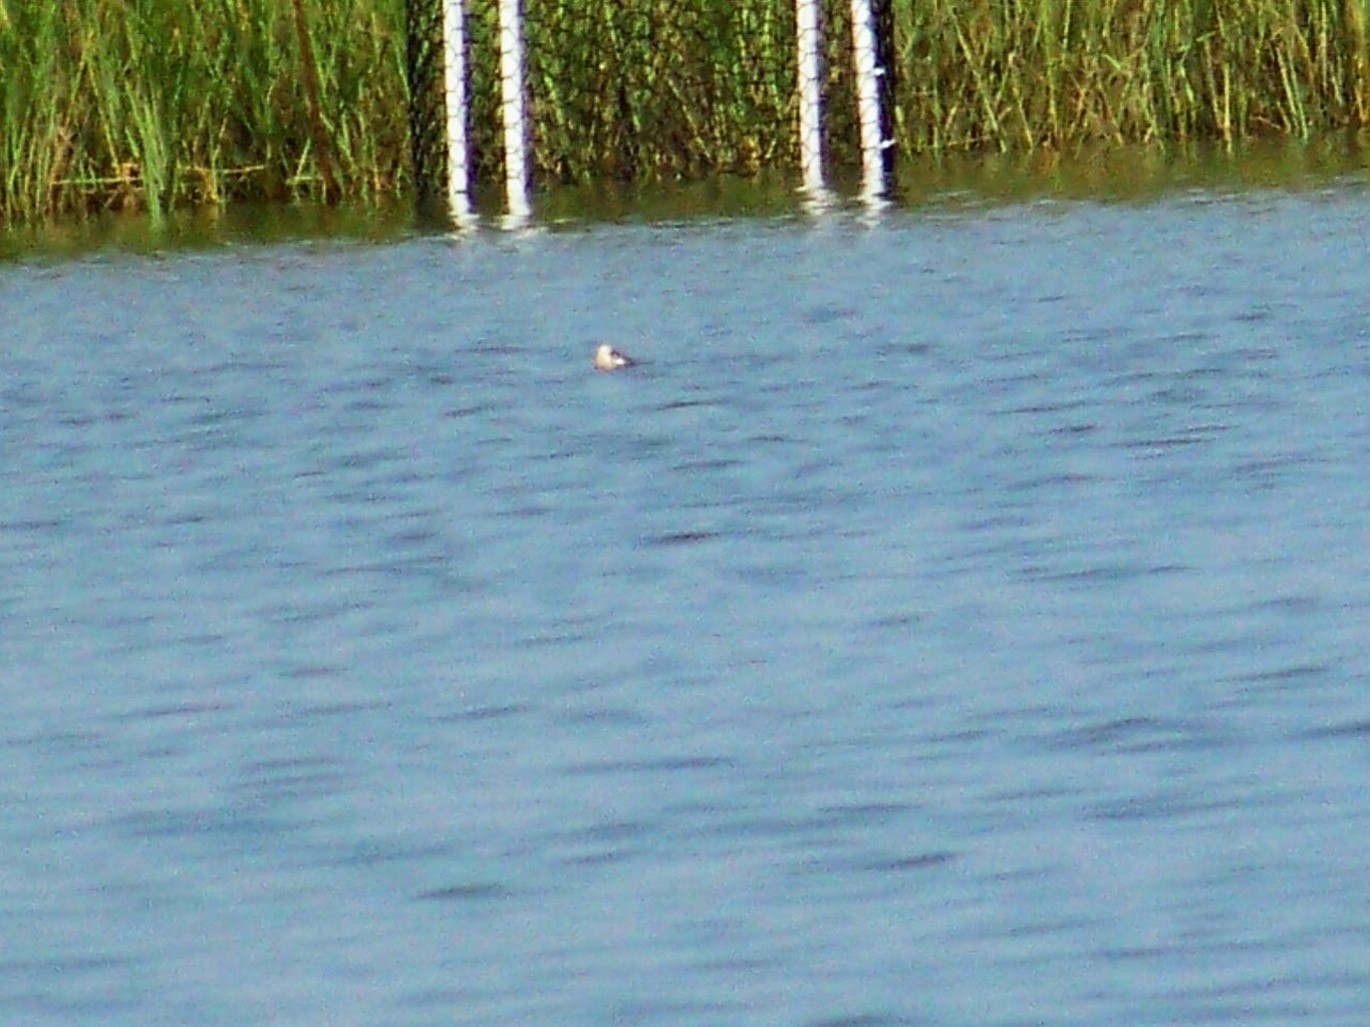
A terrapin swimming near but not entering a modified crab trap.
Photo: Molly O’Connor
The focus of the relative abundance and trapping portions of the project were Escambia and Santa Rosa Counties due to the fact the team resided there.
In 2012, the author left the marine academy and joined Florida Sea Grant. This project was not a high priority in the job description and effort on this waned until no surveys were conducted in 2014. However, in 2015 the author established a citizen science program to continue these surveys and they have done so since. The focus of those surveys has been frequency of occurrence (FOO – the number of surveys where either terrapins, or terrapin sign have occurred) and continuing the relative abundance data collection.

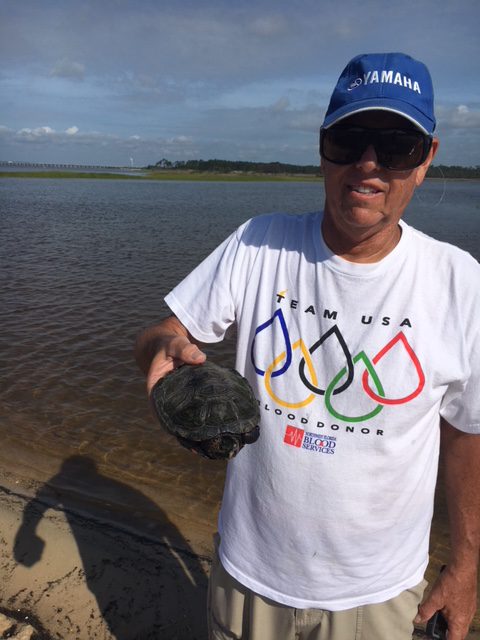
Citizen scientists have been crucial for the success of this project.
Photo: Rick O’Connor
In 2018 the U.S. Geological Survey joined the team. One member of USGS began coordinating citizen science work in the eastern panhandle (Bay, Gulf, and Franklin Counties as well as conducting research in the Gulf County area), and the author began coordinating citizen science work in the western panhandle (Escambia, Santa Rosa, Okaloosa, and Walton Counties). With USGS help some tagging has begun with both PIT and satellite tags.
RESULTS
The 2021 results are from the western panhandle portion of the project.
In the western panhandle during 2021, 263 surveys were conducted by 41 trained volunteers who logged 1832 hours. These surveys occurred in Escambia, Santa Rosa, and Okaloosa Counties. Surveys were conducted at known nesting areas with some occurring at potential new nesting sites. The number of surveys where either terrapins, or terrapin sign, were encountered was 52. This is a frequency of occurrence (FOO) of 20% of the surveys an encounter occurred. The breakdown by county is below.
2021 Data from the Western Panhandle
| County |
# of sites surveyed |
# of surveys |
FOO |
# of heads seen |
Nesting detected |
Relative abundance |
| Escambia |
8 |
86 |
.02 |
1 |
Yes |
8-24 terrapins |
| Santa Rosa |
2 |
79 |
.11 |
0 |
Yes |
4-12 terrapins
2-6 terrapins |
| Okaloosa |
5 |
98 |
.42 |
357 |
Yes |
20-70 terrapins
4-10 terrapins |
| TOTAL |
15 |
263 |
.20 |
358 |
|
|
Three of the eight sites surveyed in Escambia County were known nesting beaches, but evidence of nesting was only found at one. The other five locations were potential nesting sites, but no evidence of nesting was found. Based on these surveys, nesting activity declined in 2021.
Both sites surveyed in Santa Rosa County were known nesting beaches and nesting was detected at both. One site has long term data that, based on this year’s surveys, suggest a decline in relative abundance.
One of the five sites in Okaloosa was a known nesting site. However, evidence of nesting at a additional site was found. An encounter of some kind was logged at four of the five sites surveyed. All of these are relatively new survey sites to the project and relative abundance data is minimal. However, based on these data, the relative abundance is quite high.
Data from 2007 – 2021 for all sites
| County |
# of sites surveyed |
# of surveys |
FOO |
# of nesting beaches found |
| Escambia |
22 |
291 |
.11 |
4 |
| Santa Rosa |
13 |
441 |
.32 |
2 |
| Okaloosa |
12 |
123 |
.36 |
2 |
| Walton |
3 |
4 |
.25 |
0 |
| TOTAL |
50 |
859 |
.25 |
8 |
Since the beginning of the project 859 surveys have been conducted in the four counties of the western panhandle and terrapins have been encountered 25% of the time. Of the 50 sites surveyed, 8 (16%) of those have found nesting activity.
Objective 1 has been completed. There are terrapins in the Florida panhandle.
Objective 2 – the relative abundance – is still not completely understood. There was a significant decrease in encounters when the citizen science project began in 2015.
The citizen science effort the FOO was much higher and increased annually. The citizen science effort began in 2015 and the FOO was much lower but increased annually as well. It is believed that the cause of this decline is ability for volunteers to find terrapins, terrapin heads, or evidence of nesting. It is believed the volunteers are getting better and that the data will eventually provide better information on terrapin abundance.
DISCUSSION
Objective 1 has been answered. There are terrapins in the Florida panhandle.
Objective 2 is still not understood. It is believed the higher FOO between 2007 and 2011 was probably due to the ability of the volunteers to detect terrapin or terrapin sign. So, it is not known at this time whether the relative abundance of these animals have declined in the western panhandle or not. As the volunteers get better, we will see over time how the numbers change.
The effort of mark/recapture using modified crab traps has not been very effective. Traps have been deployed with much effort at four sites with very little success. That portion of the project has been suspended while searching for a better method of capture.
At two of the long-term monitoring sites, the relative abundance data suggests a decline in terrapins at those locations. However, as mentioned, confidence in the relative abundance data needs to increase before any strong conclusions can be drawn. These data do suggest small populations at all locations, between 20-50 animals. The citizen science effort will continue, and we hope a more robust population study will follow.
ACKNOWLEDGEMENTS
The author would like to thank the students from the Institute of Coastal and Marine Studies at B.T. Washington High School for assistance developing and conducting the early portion of this project.
Tom Mann from the Mississippi Department of Wildlife for the protocol on relative abundance based on nesting activity.
George Heinrich (Florida Turtle Conservation Trust, Florida Diamondback Terrapin Working Group)
Dr. Joe Butler (University of North Florida, Florida Diamondback Terrapin Working Group)
Dr. Andy Coleman (Birmingham Audubon Society, Gulf Coast Diamondback Terrapin Working Group)
Dr. Thane Wibbels (University of Alabama Birmingham, Gulf Coast Diamondback Terrapin Working Group)
Dr. Ken Marion (University of Alabama Birmingham, Gulf Coast Diamondback Terrapin Working Group) for their assistance, guidance and advice on this project.
Dan Catizone (U.S. Geological Survey, University of Florida)
Dr. Margaret Lamont (U.S. Geological Survey)
for their assistance, guidance, advice, and supply support.
Bob Pitts (Gulf Islands National Seashore)
Bob Blais (Navarre Beach Sea Turtle Conservation Center)
Jeanna Kilpatrick (Choctawhatchee Basin Alliance)
for taking the lead as county volunteer coordinators as well as surveyors.
And the 40 plus volunteers who have logged thousands of hours surveying sites in the western panhandle. We could not have done this without you.
Submitted:
December 22, 2021.