by Carrie Stevenson | Jul 7, 2025

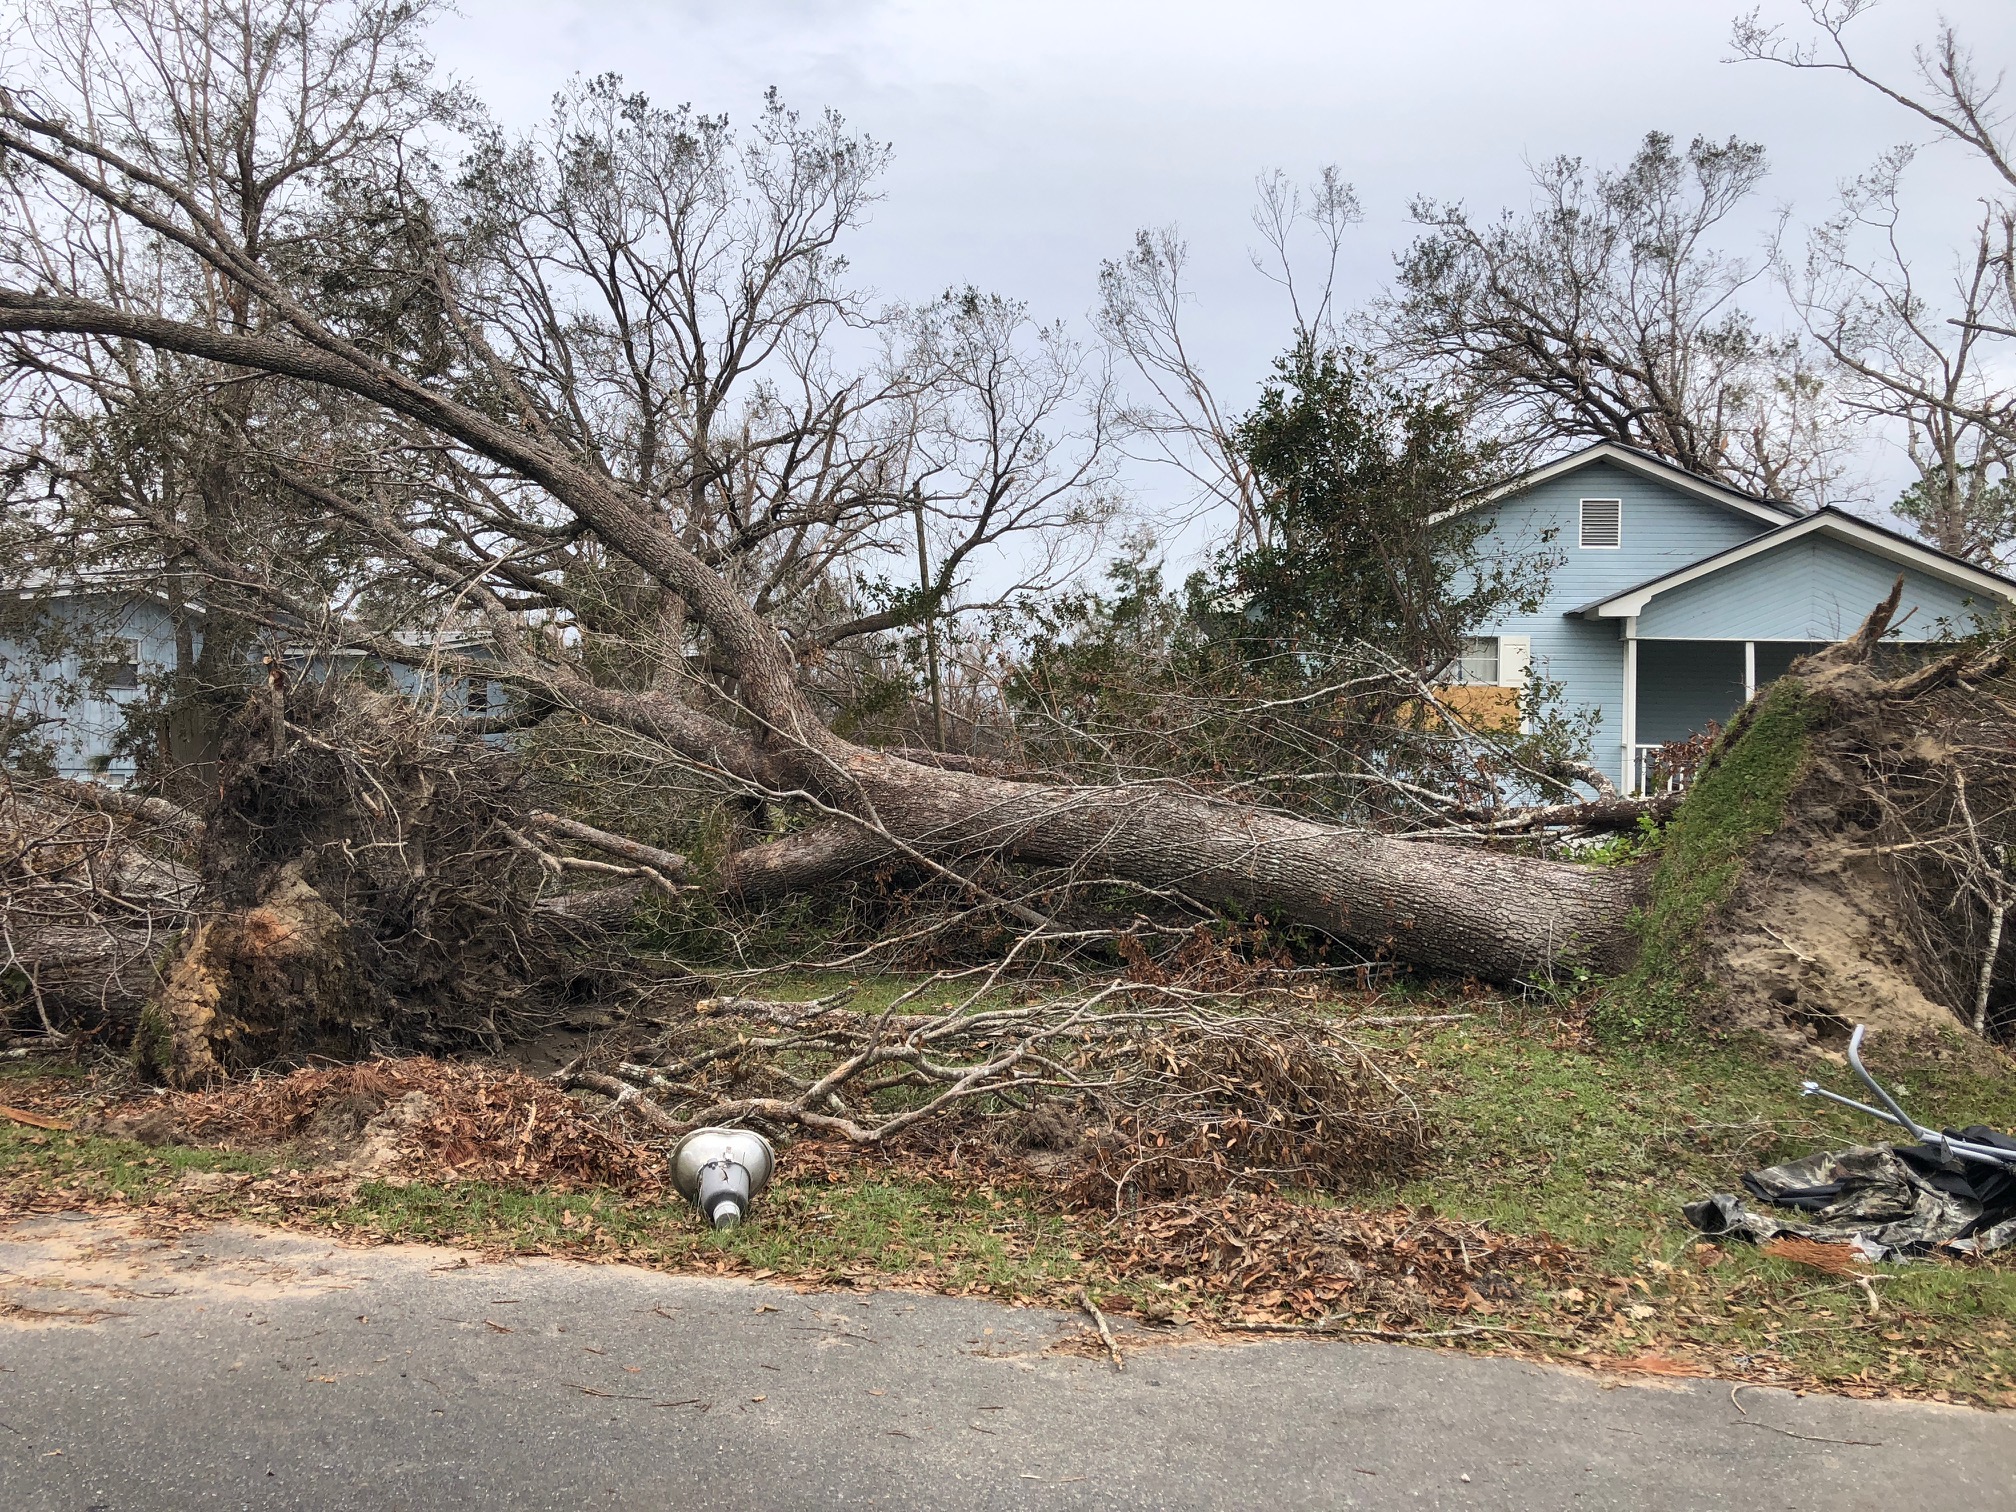
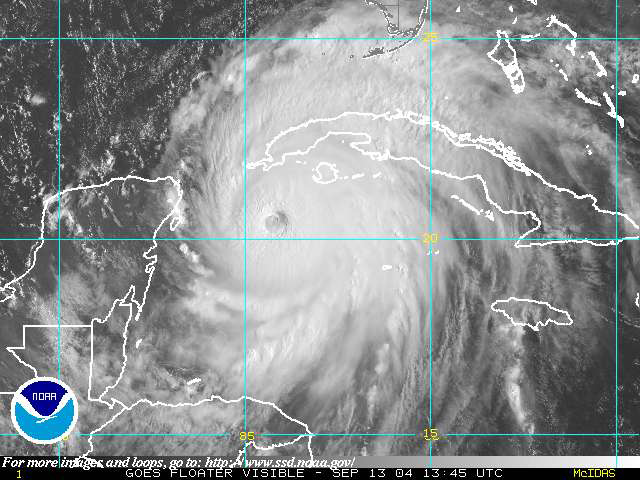
This tree was downed during Hurricane Michael, which made a late-season (October) landfall as a Category 5 hurricane. Photo credit: Carrie Stevenson, UF IFAS Extension
There are plenty of jokes about the four seasons in Florida—in place of spring, summer, fall, and winter; we have tourist, mosquito, hurricane, and football seasons. The weather and change in seasons are definitely different in a mostly-subtropical state, although we in north Florida do get our share of cold weather (remember that snow this year?!).

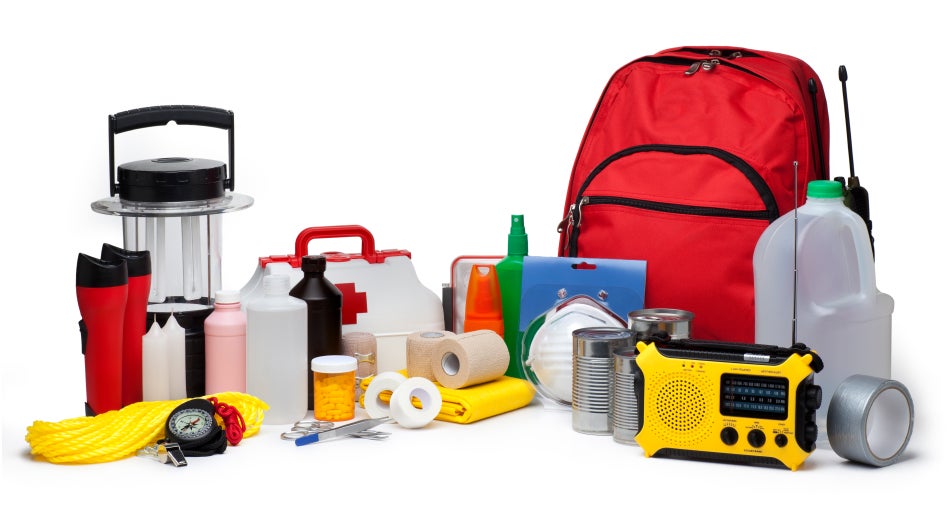
A disaster supply kit contains everything your family might need to survive without power and water for several days. Photo credit: Weather Underground
All jokes aside, hurricane season is a real issue in our state. With the official season having recently begun (June 1) and running through November 30, hurricanes in the Gulf-Atlantic region are a legitimate concern for fully half the calendar year. According to records kept since the 1850’s, Florida has been hit with more than 120 hurricanes, double that of the closest high-frequency target, Texas. Hurricanes can affect areas more than 50 miles inland, meaning there is essentially no place to hide in our long, skinny, peninsular state.
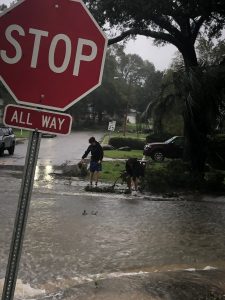
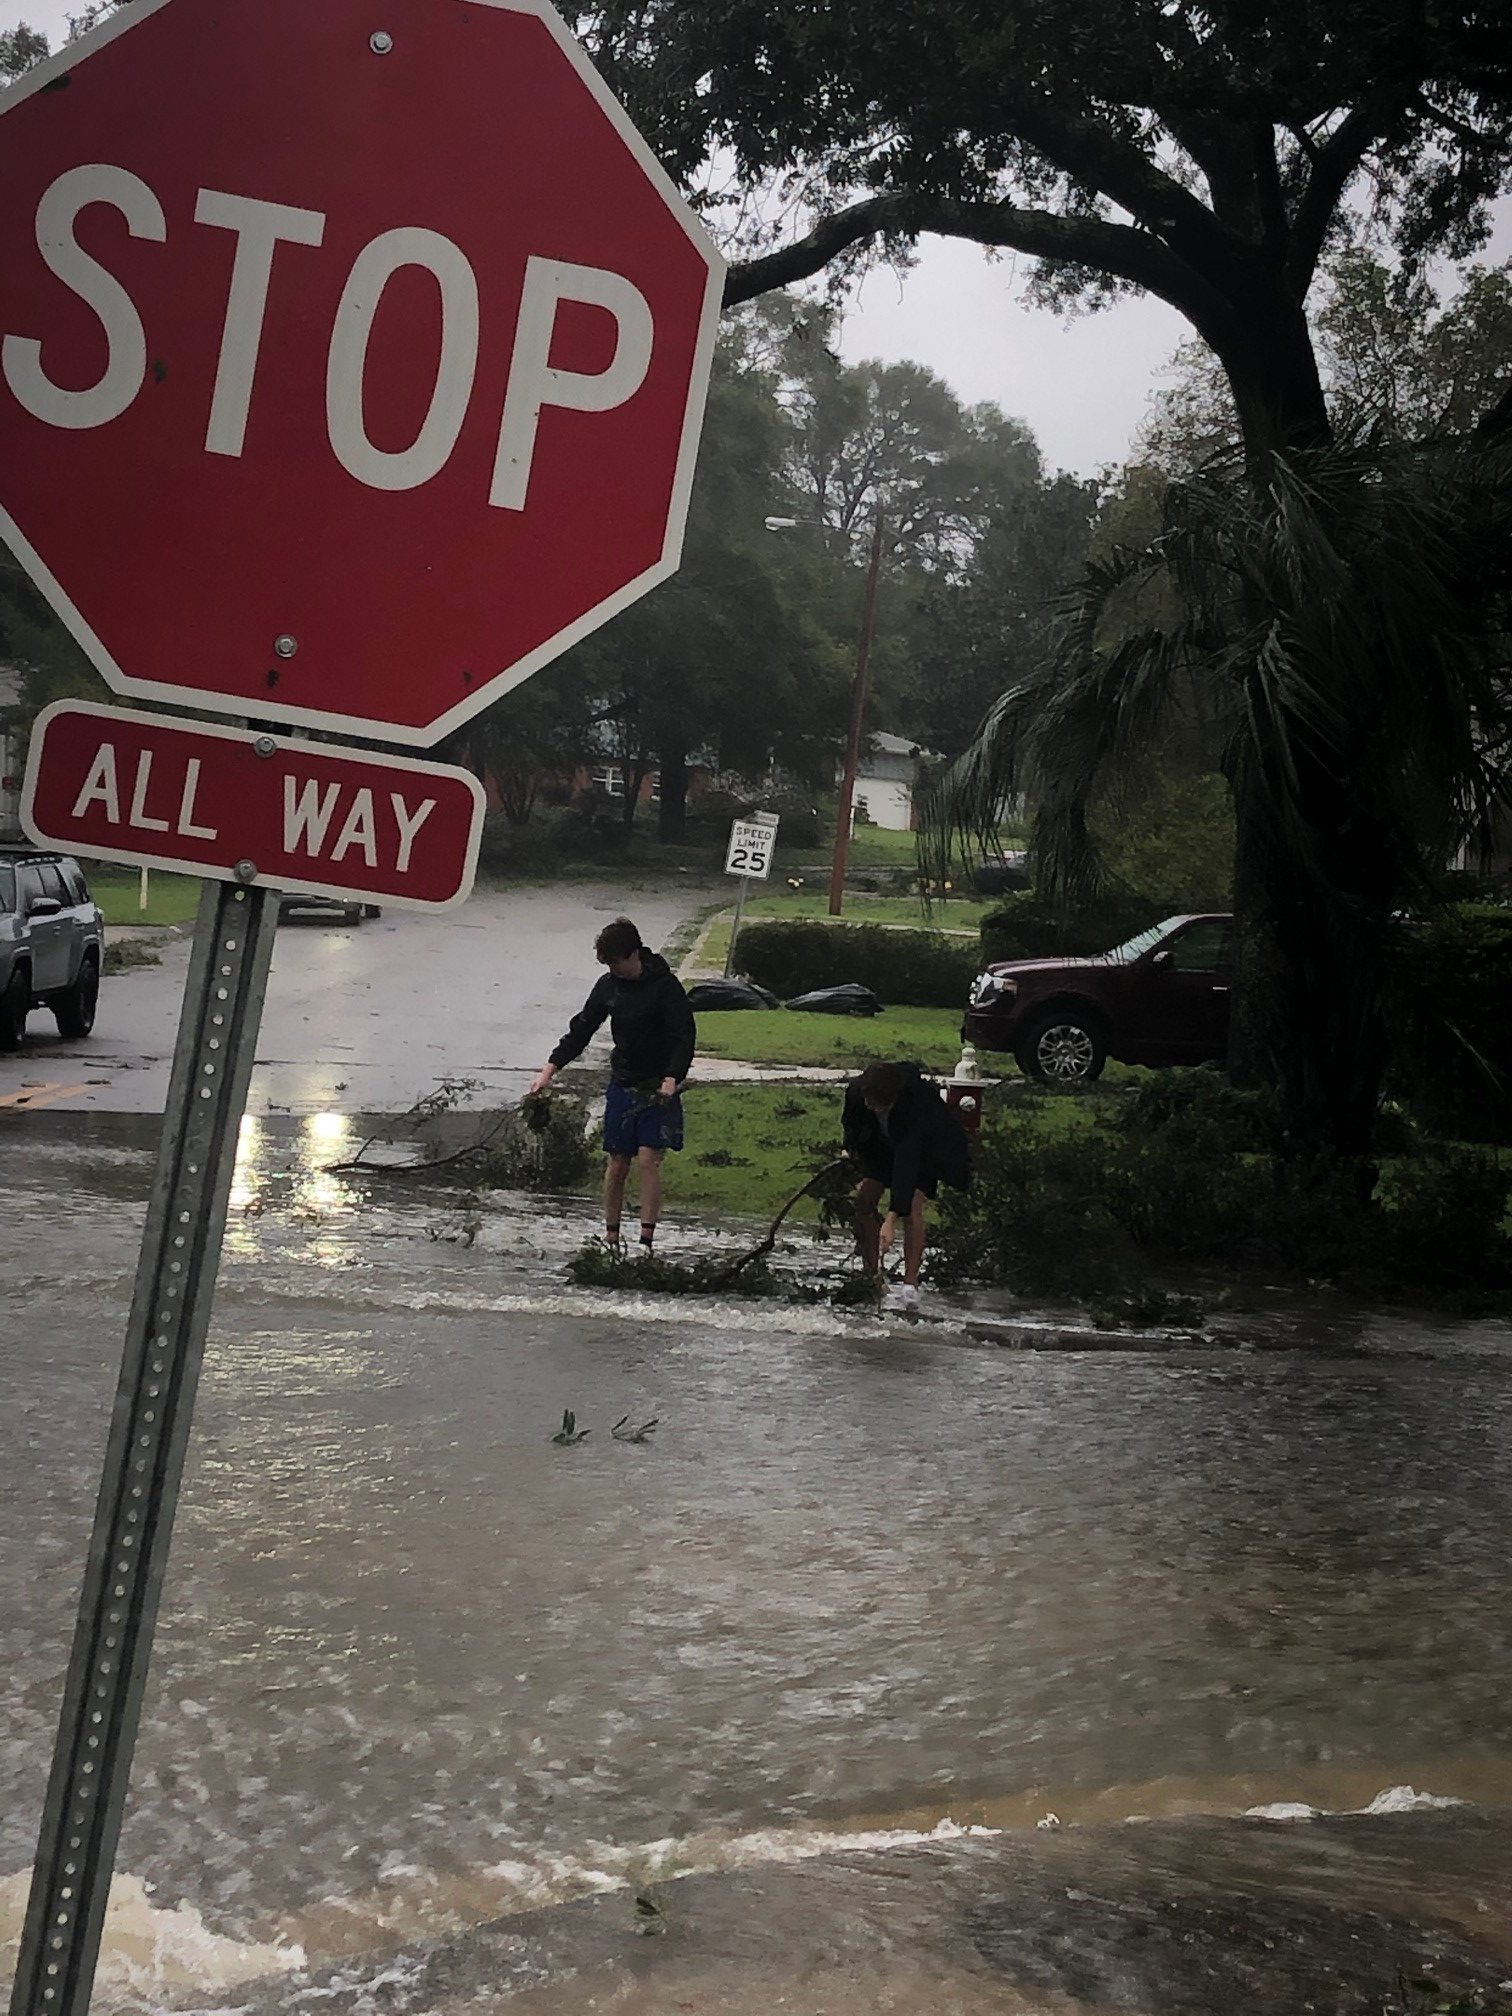
Flooding and storm surge are the most dangerous aspects of a hurricane. Photo credit: Carrie Stevenson, UF IFAS Extension
I point all these things out not to cause anxiety, but to remind readers (and especially new Florida residents) that is it imperative to be prepared for hurricane season. Just like picking up pens, notebooks, and new clothes at the start of the school year, it’s important to prepare for hurricane season by firing up (or purchasing) a generator, creating a disaster kit, and making an evacuation plan. We even have disaster preparedness sales tax exempt holidays in Florida; one in early June and another in the heart of the season, August 24-September 6.
Peak season for hurricanes is September. Particularly for those in the far western Panhandle, September 16 seems to be our target—Hurricane Ivan hit us on that date in 2004, and Sally made landfall exactly 16 years later, in 2020. But if the season starts in June, why is September so intense? By late August, the Gulf and Atlantic waters have been absorbing summer temperatures for 3 months. The water is as warm as it will be all year–in 2023 even reaching over 100 degrees Fahrenheit–as ambient air temperatures hit their peak. This warm water is hurricane fuel—it is a source of heat energy that generates power for the storm. Tropical storms will form early and late in the season, but the highest frequency (and often the strongest ones) are mid-August through late September.
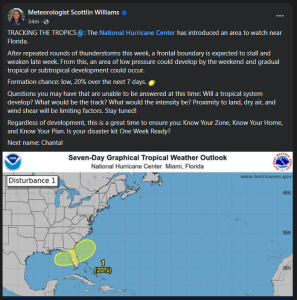
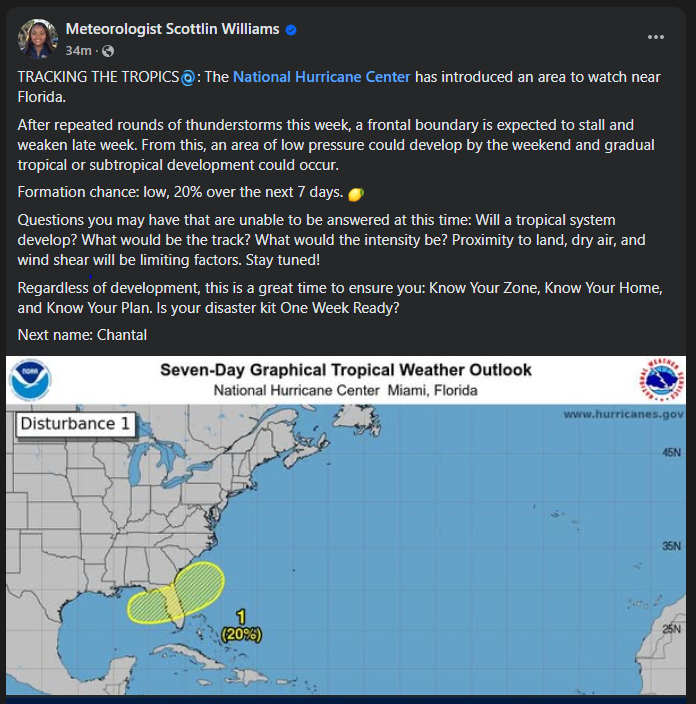
Pay attention to local meteorologists on social media, news, and radio. This alert was posted just yesterday online by the Escambia County Emergency Management Coordinator.
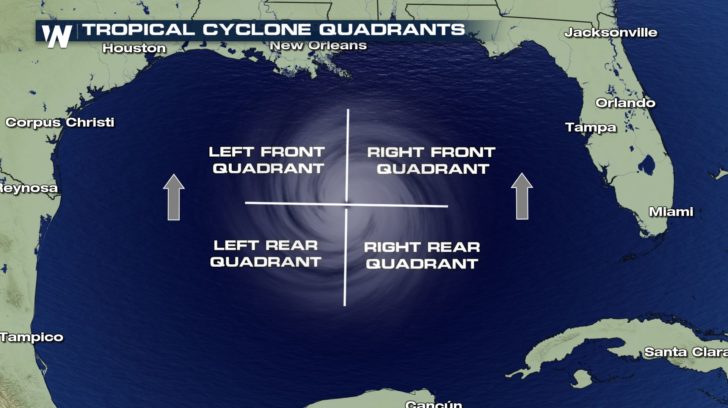
If you have lived in a hurricane-prone area, you know you don’t want to be on the front right side of the storm. For example, here in Pensacola, if a storm lands in western Mobile or Gulf Shores, Alabama, the impact will nail us. Meteorologists divide hurricanes up into quadrants around the center eye. Because hurricanes spin counterclockwise but move forward, the right front quadrant will take the biggest hit from the storm. A community 20 miles away but on the opposite side of a hurricane may experience little to no damage.

The front right quadrant of a hurricane is the strongest portion of a storm. Photo credit: Weather Nation
Hurricanes bring with them high winds, heavy rains, and storm surge. Of all those concerns, storm surge is the deadliest, accounting for about half the deaths associated with hurricanes in the past 50 years. Many waterfront residents are taken by surprise at the rapid increase in water level due to surge and wait until too late to evacuate. Storm surge is caused by the pressure of the incoming hurricane building up and pushing the surrounding water inland. Storm surge for Hurricane Katrina was 30 feet above normal sea level, causing devastating floods throughout coastal Louisiana and Mississippi. Due to the dangerous nature of storm surge, NOAA and the National Weather Service have begun announcing storm surge warnings along with hurricane and tornado warnings.
For helpful information on tropical storms and protecting your family and home, look online here for the updated Homeowner’s Handbook to Prepare for Natural Disasters, or reach out to your local Extension office for a hard copy.
by Rick O'Connor | Mar 7, 2025
The principles of life on land are not that different from life in the sea. It is believed that life began in the sea but, the creation of continents and islands, new habitat was available for colonization. However, the creatures who would colonize land would have to have different characteristics than those in the sea.
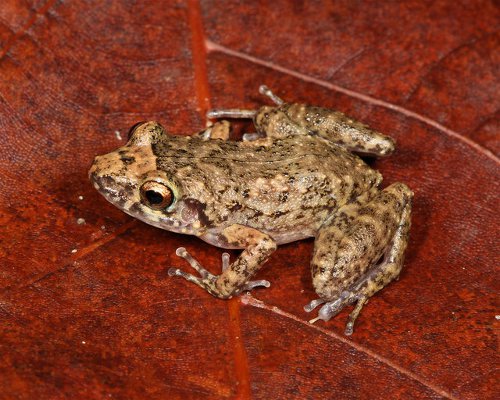
Frogs are land animals that use water environments as well.
Photo: U.S. Geological Survey
A limiting factor for the producers in the sea was light. Sunlight is the energy that fuels the process of photosynthesis. Thus, the producers had to either live in shallow water or be able to stay near the surface of the sea in order to function. For MOST locations on land, sunlight is not the issue. In fact, in some locations, too much sunlight can be an issue. You need sunlight, water, and carbon dioxide to photosynthesize – and on land, water would be the hardest to obtain. Many land creatures actually still live in water part time. There are rivers, lakes, and streams crossing over the landscape that can provide suitable habitat for both producers and consumers. However, most of the landscape is not water and photosynthesizing plants – like trees, grasses, and shrubs – developed root systems to absorb water from the ground.
Forest and trees are plants that have adapted to obtaining water from the ground.
Photo: Rick O’Connor
Another player in this game are the swirling ocean currents. As they rotate past the polar regions of the world, they become colder. As the cold currents pass land, they lower the humidity and produce less rainfall. Drier conditions meant plants had to adapt to both the issue of over evaporation and sufficient groundwater to support them. Desert plants have done just that. Often along mountain ranges the mountainside closest to the ocean, or warm currents will produce the greatest amount of precipitation. While the opposite will be drier and more desert like. The producers who live on each side of the mountain will be different due to this. Landscapes near warm ocean currents are humid and rainfall is high. Here the landscape is lush and green with some of the highest plant diversity found on the planet.
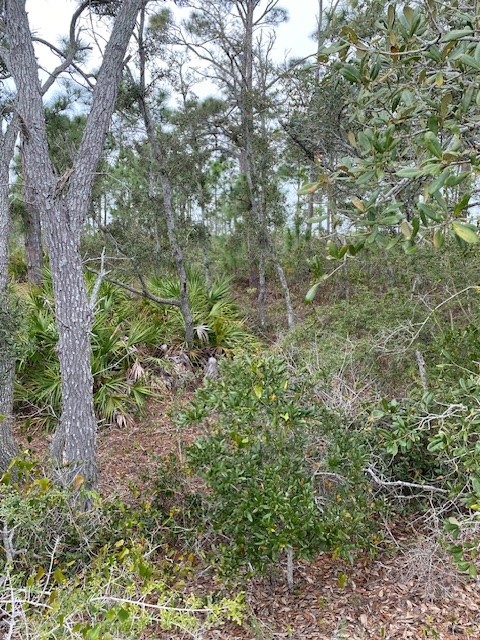
Deserts are found in locations where rainfall and humidity are low.
Photo: Rick O’Connor
Land dwelling consumers follow suit. They must first be able to deal with the amount of sunlight, temperature fluctuations, and humidity as the planets do. Then the primary consumers – those that feed on the producers – must be able to feed on the plants that have adapted to that area.
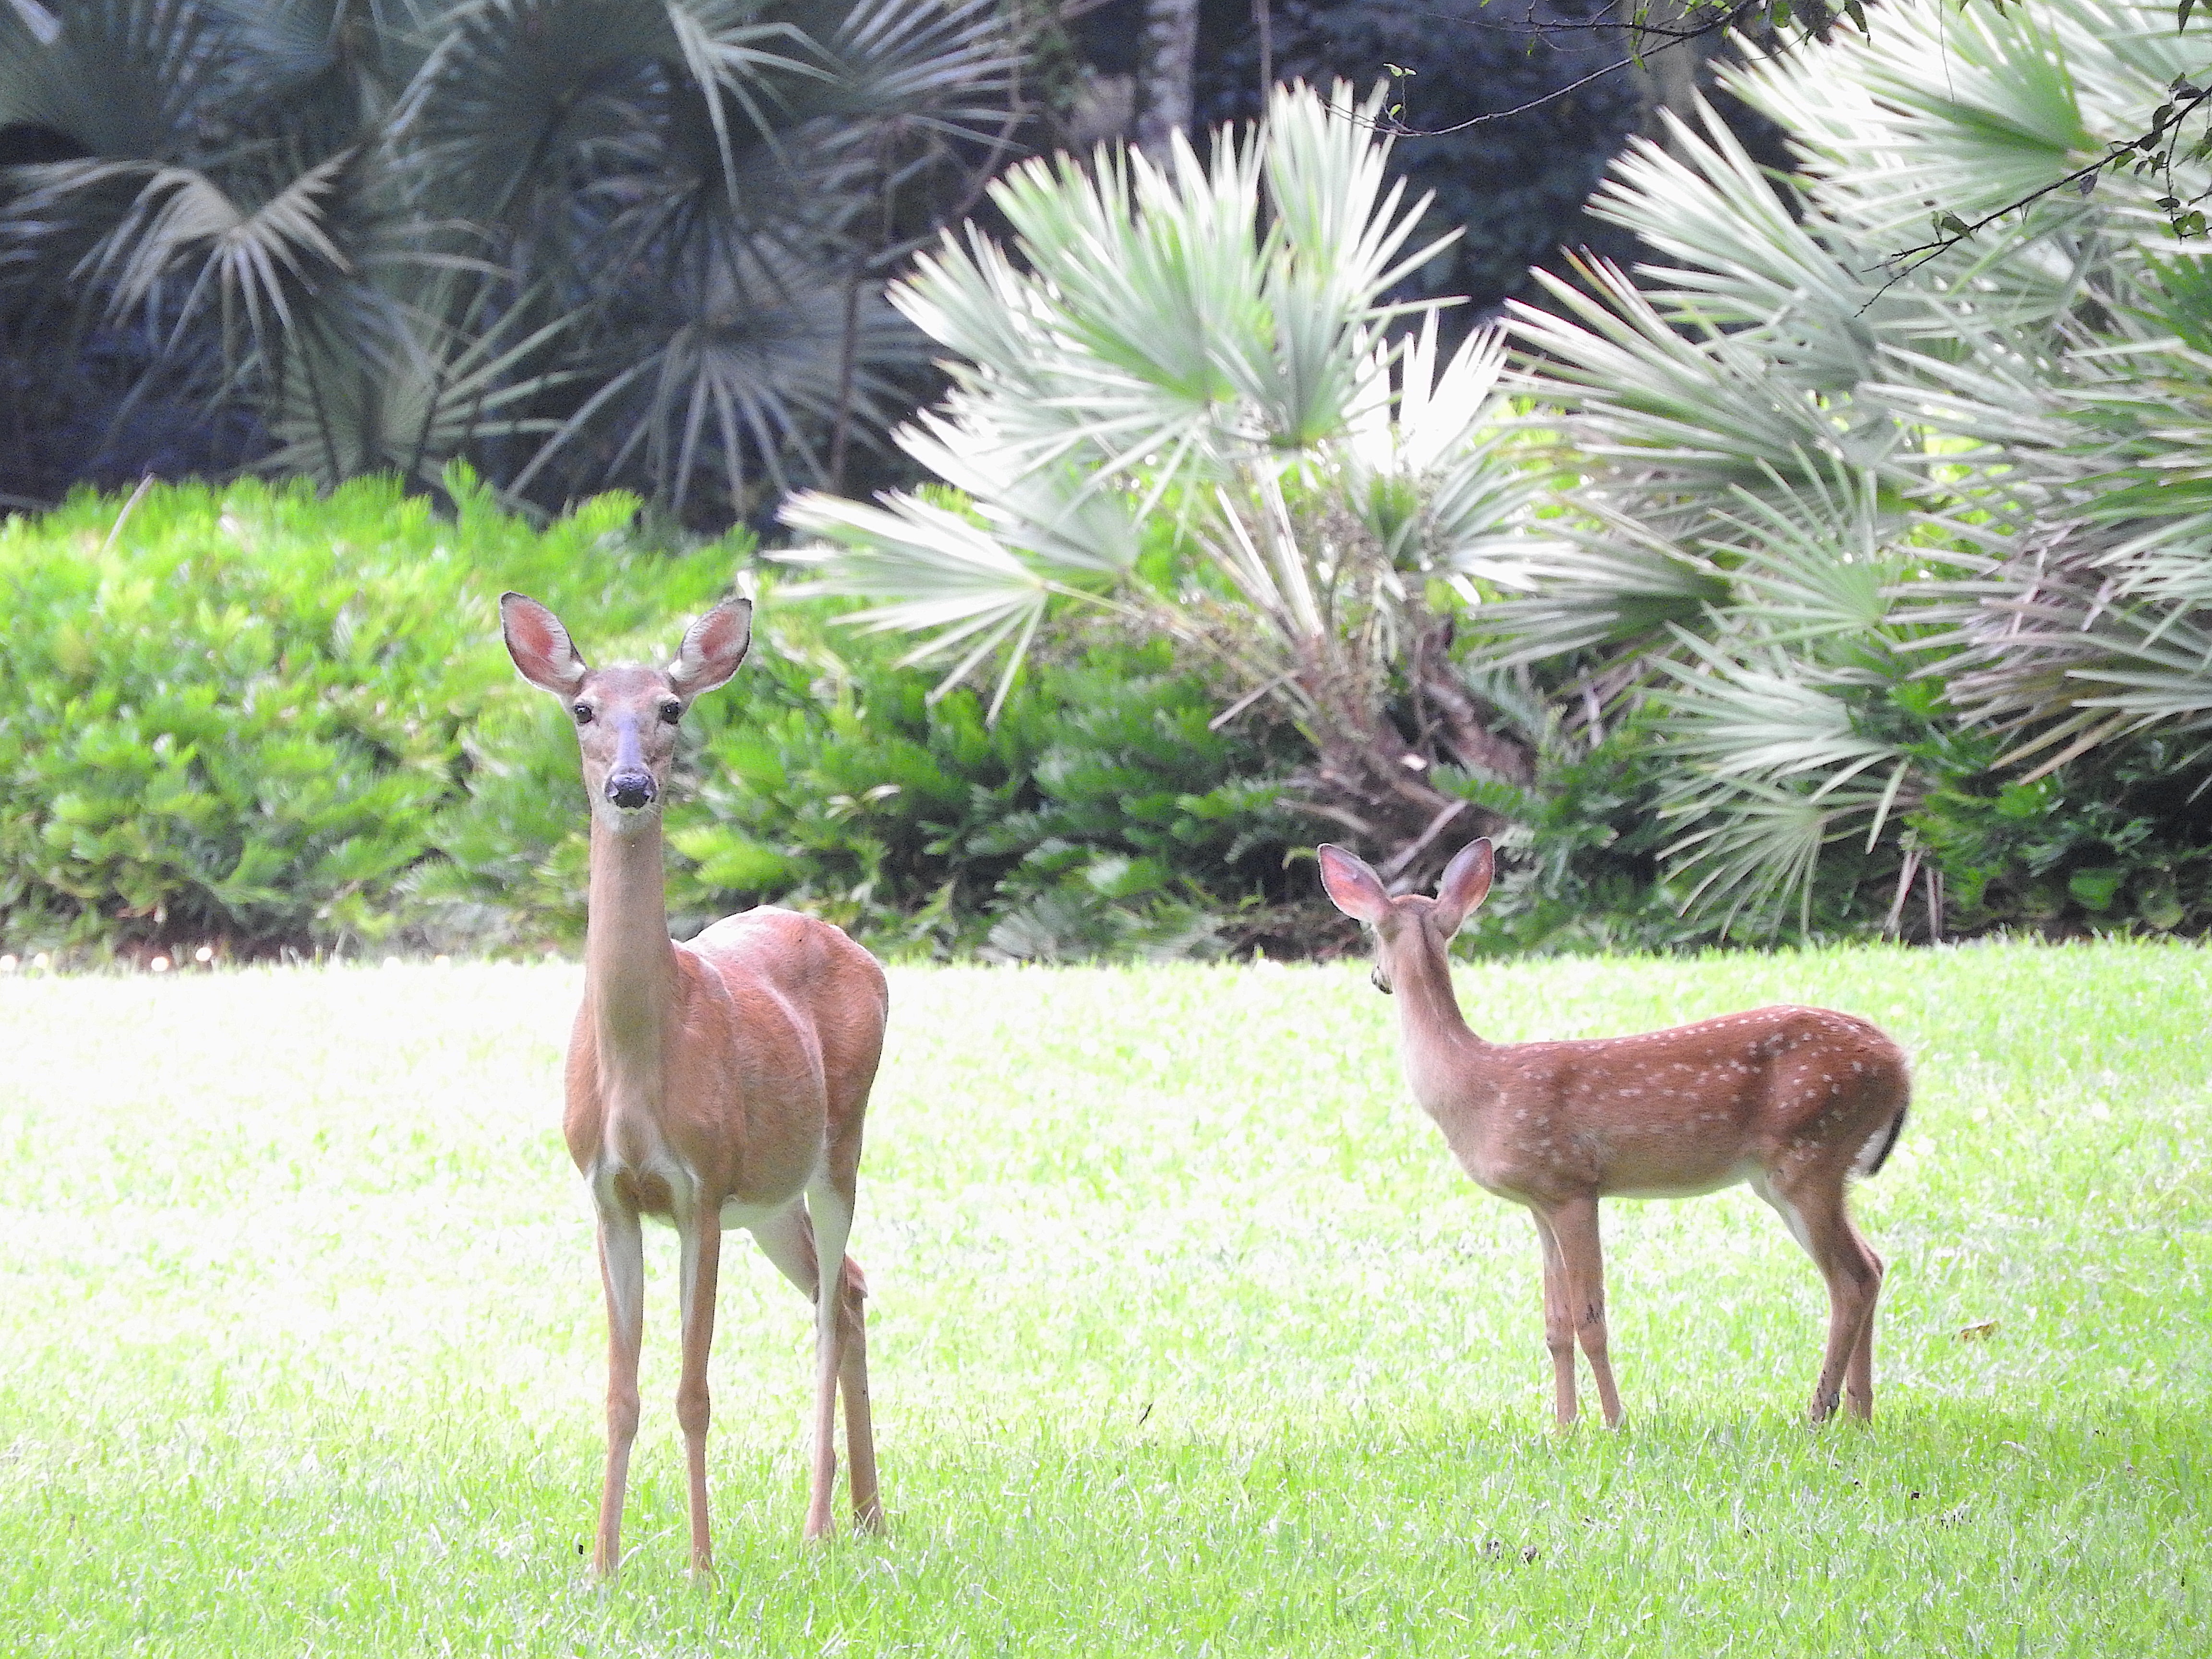
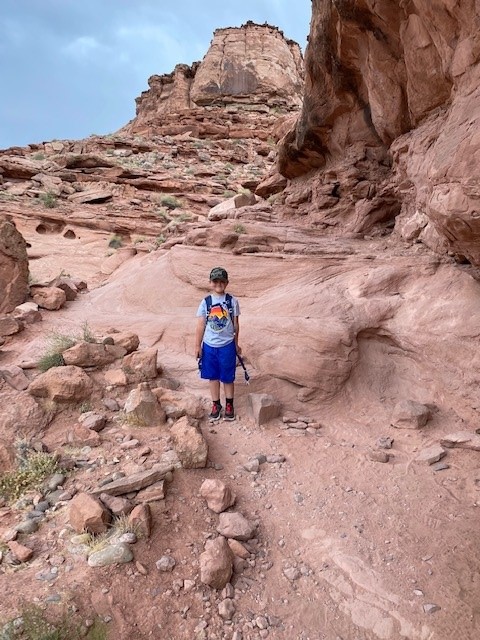
Deer are land animals that have adapted to several climates and feeding on land plants.
Photo: Carolina Baruzzi.
These climate conditions have formed what biologists call biomes – ecologically unique ecosystems. Examples of biomes are deserts, grasslands, alpine forests, hardwood forests, swamps, marshes, and more. Each possesses their unique plant and animal communities. And – like the systems found in the sea – they are constantly changing. Life on land has to deal with the seasons of the year more than those in the oceans do. Prey evolve to defend themselves from predators. Predators evolve to overcome these new defenses. Some species are very successful, others have gone extinct. Though large-scale climate changes – such as ice ages and warming periods – impact life in the sea, they tend to be more impactful for life on land.
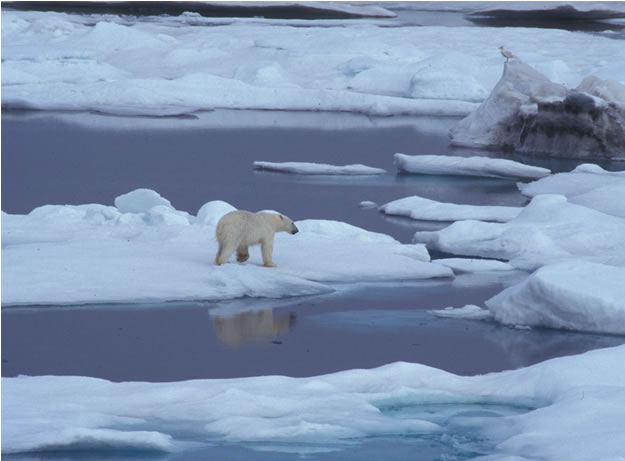
Polar bears have adapted to harsh conditions on land.
Photo: NOAA
Biogeography is the study of how creatures disperse across the landscape (or ocean), meet barriers, and define their biological range. Some creatures have large areas where they are found – such as seagulls, squirrels, and raccoons. These are called cosmopolitan species. Others have very small ranges – such as the marine iguana, Komodo dragon, and kangaroos – and are referred to as endemic species. There are many plants and animals that dispersed across North America and can be found on both coasts. Others are only found in one small area of the country. In our next article we will introduce one species that has dispersed across the entire planet – humans.
by Thomas Derbes II | Jan 31, 2025
Snow in Florida? Yeah, it happens. We sometimes get the dusting, we sometimes get the icing, but we never really get the good stuff, the “accumulation.” Well Tuesday, January 21st will go down as the snowiest day in Florida recorded history, and I was lucky (or unlucky) enough to be smack dab in 9 – 10 inches of snow.

“Snowmageddon” 2014 in Pensacola – Thomas Derbes
The week before the snow, I mentioned to fellow co-workers and oyster farmers that “snow is on the way,” and I kind of meant that jokingly. We joked “snow in Florida? That’s why we live here, to avoid that stuff.” Like I mentioned earlier, snow in Florida has happened. In January of 2014, Pensacola experienced a dusting/icing event that shut the town down for a day, and that is fully what I was expecting to happen. Fast-forward to 10:15 am January 21st, 2025. The snow had arrived, but I was still skeptical of the snow. I thought “maybe an inch or two, but there is no way we hit 3 inches.”

Dog’s Love The Snow – Thomas Derbes
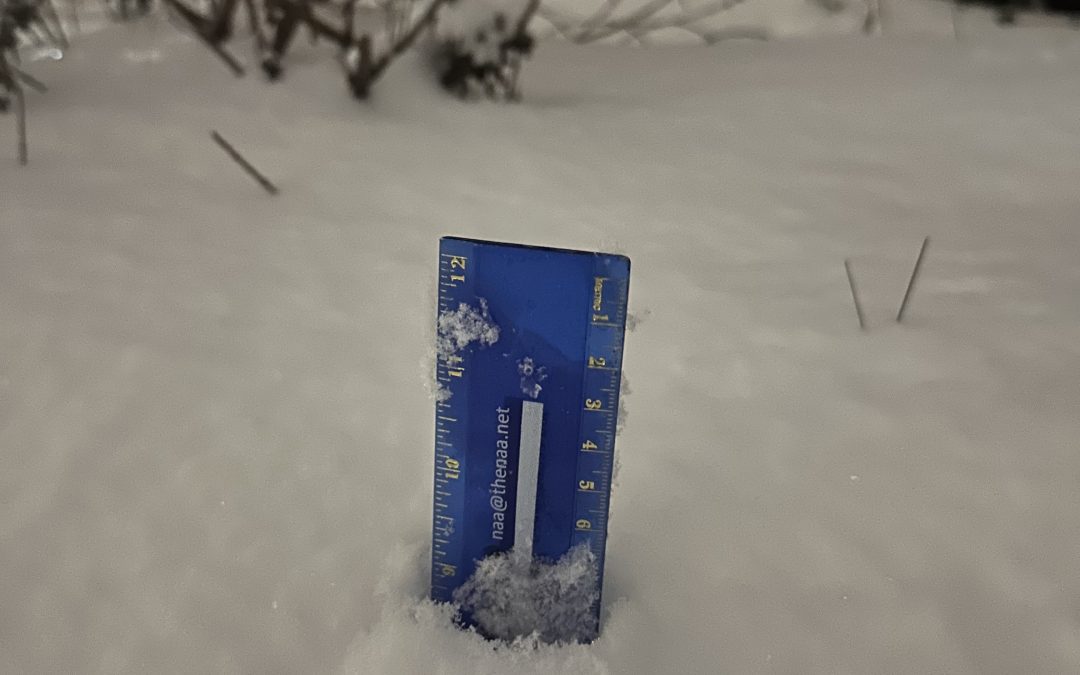
By 3:00 pm, my ruler measured 6 inches of the most beautiful, powdery snow I have seen other than Colorado. By 7:30, the snow had calmed and I was able to measure 9 inches in the front yard. The whole neighborhood was blanketed in snow, and the dogs were both confused and excited to enjoy this white, powdery cold stuff. Everyone’s minds were blown, and the area was shut down for a few days to let the snow and eventual ice melt.

9 Inches of Florida Snow – Thomas Derbes
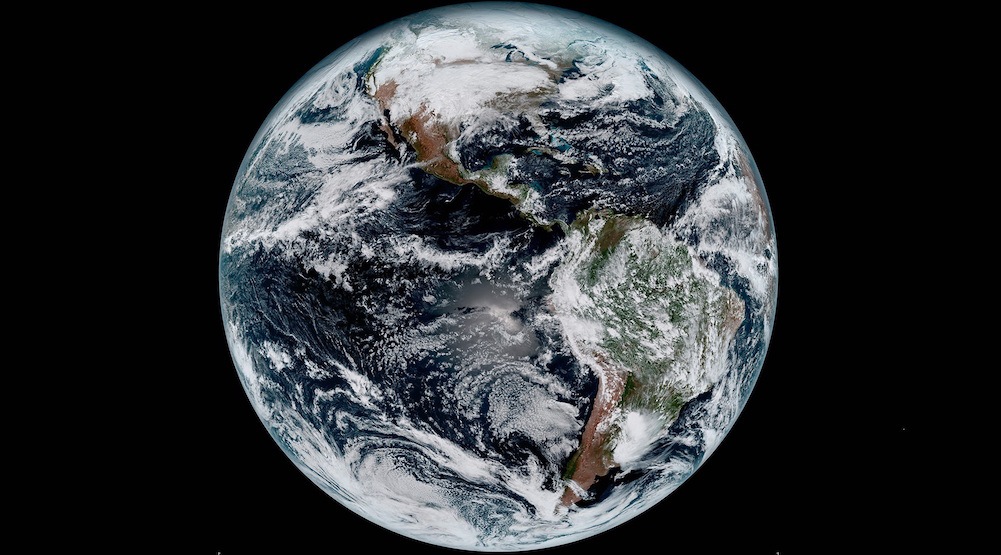
This rare winter storm was caused by a meeting of two systems. A low was forming in the Gulf of Mexico and was pulled up by the very strong Polar Vortex descending from the North. This “perfect storm” dumped record snowfall all along the Gulf Coast, from Texas to Apalachicola. NOAA recently released a beautiful satellite image of the snowfall.

Southern Snow Satellite – NOAA
One of the coolest things about the snow was the “snow glow” that happened Tuesday night. I had never witness this phenomenon before, and it was almost daylight outside. “Snow glow” happens when light reflects off individual ice crystals in freshly fallen snow, creating a bright, sparkling effect. Each crystal acts like a tiny mirror, bouncing light upwards. This phenomenon becomes even more pronounced under sunlight or artificial lights, such as street lamps, making the snow appear to glow.
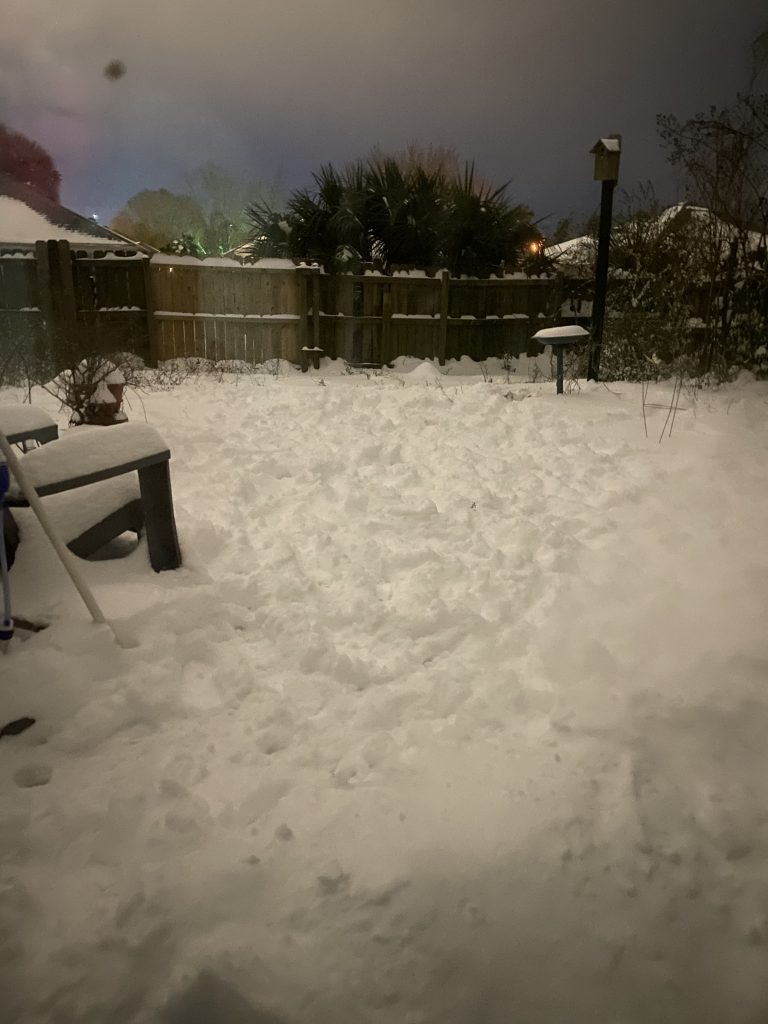
Backyard Snow and Snow Glow! Photo Taken With No Flash at 9:00 pm – Thomas Derbes
I hope you were able to enjoy a rare Florida snow day! Many people ask “can this happen again?” Even though I am not a meteorologist, it is typically a once-in-a-lifetime event. However, anything is possible!
by Rick O'Connor | Jan 31, 2025
Each year I survey the public to determine what their needs are – what they are most concerned about – and where Extension might help. One of the primary functions of Extension is to provide local clientele with solutions to their needs – our mantra at UF IFAS Extension has been “Solutions for Your Life”. Most years the primary concern for Sea Grant locally has been water quality. Habitat restoration and invasive species also score high. These are all important issues. We want to maintain a high quality of life and addressing these concerns will help do that. And as important as these are, and they are, if someone were to ask me about my highest concern, it would be climate change. The issues above can be connected directly, or indirectly, to climate change.
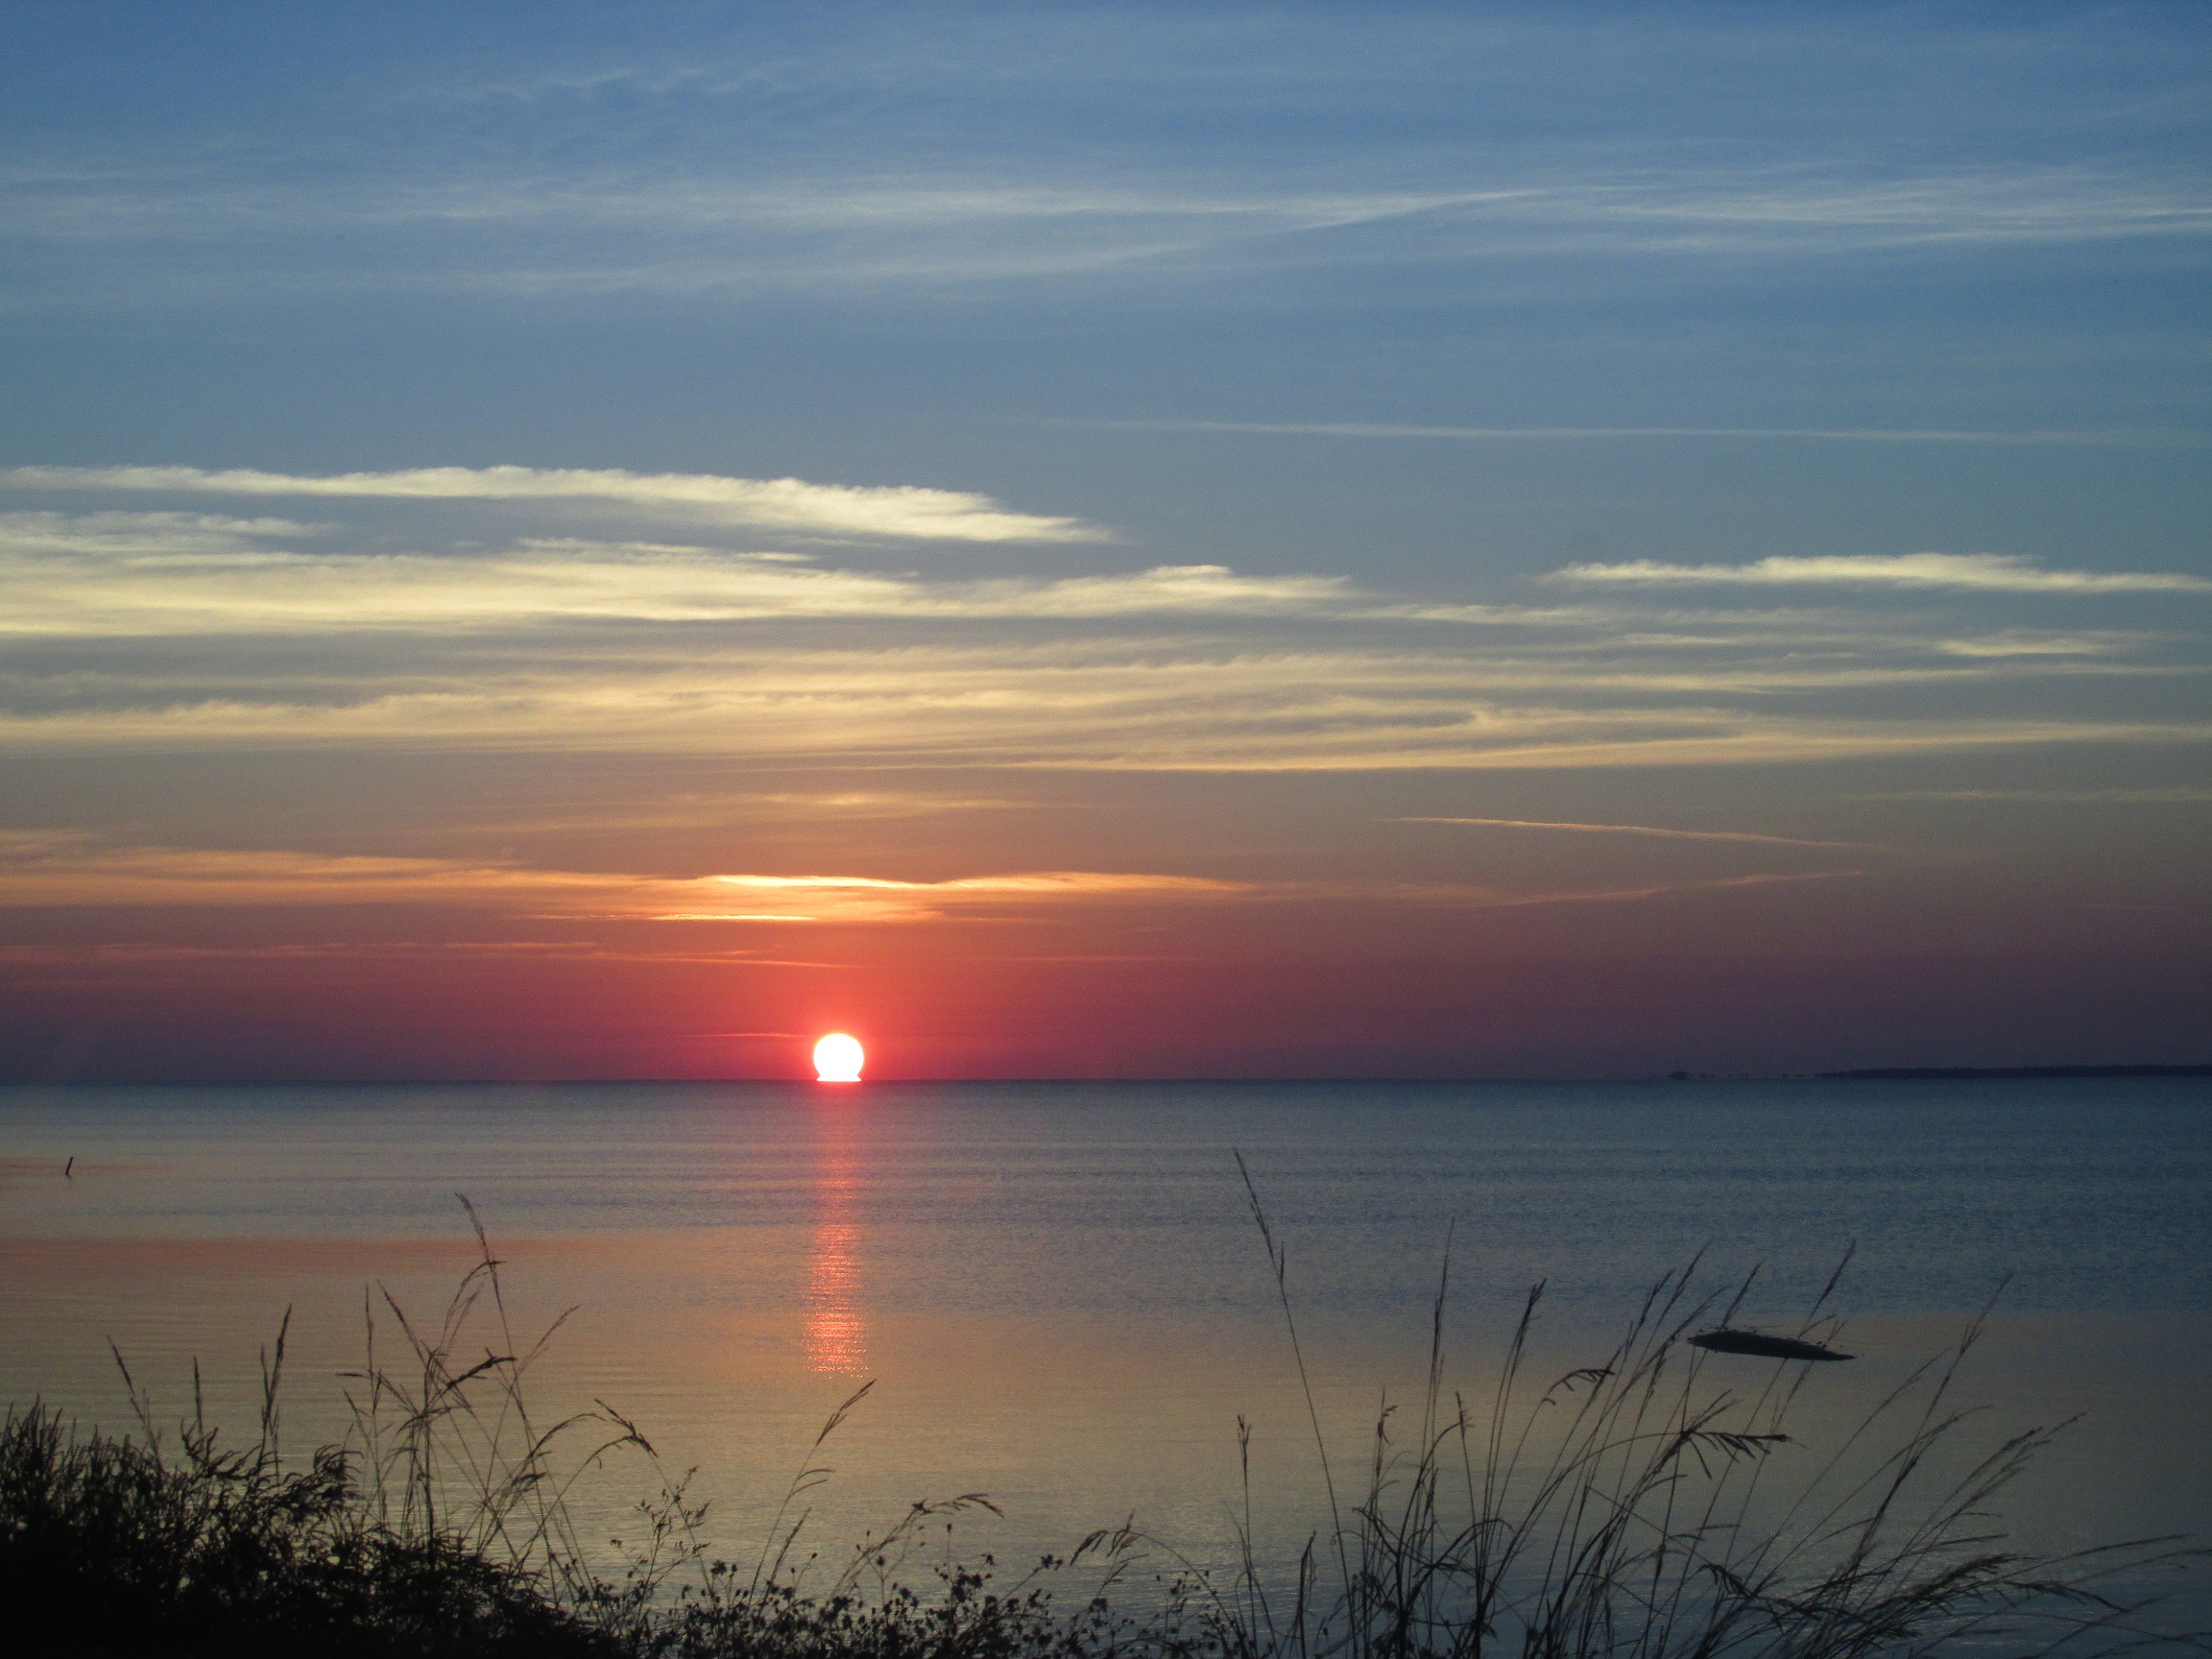
Sunrise over Apalachicola Bay in Northwest Florida
Scientists have predicted, and witnessed, the negative impacts of climate change for several decades now. Nonscientists have begun to notice as well. Increased number of hurricanes, increased intensity of some of these hurricanes, excessive and extended heat waves in the summer, drought conditions in some areas of the country, flooding issues in others, and wildfires out west. These things have all happened before but in recent decades they are becoming more common.
In 2024 I wrote four articles about our changing climate in response to the devasting hurricane season we had. The reason was my concern about climate change and that we all need to pay more attention to the issue. I wrote a total of 41 articles over the course of the year – including these four on climate. The articles on climate were the least read articles of the group. There could be a couple of reasons for this. It could be that most do not consider it a high priority concern – and I understand that. Again, water quality and habitat loss are real concerns and climate maybe less so for many people. It could be that people understand the concern about climate but what can you do? It is too big of an issue for me to deal with and so, I will focus on what I can do something about. It may be because the topic is so negative – and I get this also. I taught environmental science at Pensacola State College for 15 years. Despite there being many positive lessons in the course, many students were so depressed by the final exam they would add notes such as “I will never have children” and others similar to this. Discussing the state of our environment can be a “downer”, and they just do not want to deal with it. And it could be that they deny climate change is even happening. There are many who do feel this way. In their minds, there is no issue, nothing to discuss, nothing to read about – move on.
I posted my four articles and let it ride (links to them are posted below). However, with the tragedy of the fires in Los Angeles recently, I felt it needed to be brought back up. I watched a program about the fires and a science writer, who recently published a book about climate, made a statement to the effect that “nature is letting us know that something serious is going on… nature is letting man know that we are in this together and we need to make some changes”. I agree. Though the topics of water quality and habitat loss are concerning – and Extension will provide articles and programs during the year to help the community solve those problems – I also believe that the community needs to pay more attention to climate change and enact behavior changes to solve this very serious problem.
I have decided to post articles throughout 2025 mimicking the environmental science course I used to teach. I am obviously going to shorten the subjects – and may write more in-depth articles about some of them down the road – but the outline will follow that of the course. We will begin with how the planet works. This will be followed by the introduction of humans and how we have spread across the planet. There will be articles about how we have impacted our natural resources and the climate. And we will end with some suggested methods for solving some of the problems. I am not expecting a lot of people to follow this – but I hope you will. And I hope some positive change will come from it. Let’s begin…
Climate articles from 2024
Another Look at Climate Change – Part 1 Introduction
https://blogs.ifas.ufl.edu/escambiaco/2024/06/20/another-look-at-climate-change-part-1-introduction/.
Another Look at Climate Change – Part 2 How Might the Earth’s Temperature and Climate Change in the Future?
https://blogs.ifas.ufl.edu/escambiaco/2024/06/25/another-look-at-climate-change-part-2-how-might-the-earths-temperature-and-climate-change-in-the-future/.
Another Look at Climate Change – Part 3 What are Some Possible Effects of a Warmer Atmosphere?
https://blogs.ifas.ufl.edu/escambiaco/2024/07/03/another-look-at-climate-change-part-3-what-are-some-possible-effects-of-a-warmer-atmosphere/.
Another Look at Climate Change – Part 4 What Can Be Done?
https://blogs.ifas.ufl.edu/escambiaco/2024/07/08/another-look-at-climate-change-part-4-what-can-be-done/.
by Daniel J. Leonard | Jan 17, 2025
Over the last 10 years or so, the Florida Panhandle has gotten used to relatively warm winters, at least historically speaking. While we have experienced sharp cold snaps that were devastating to unprepared landscapes and gardens (the most recent being the late December dip down into the low to mid-teens in 2022), they haven’t lasted long and, overall, winters have been mild. Anecdotally, it seems like this winter (2024-2025) has been a return to a historical norm, with extended periods of cloudy, dreary cold; but does the data support that feeling? Let’s find out.
There are several ways of measuring the relative cold of one winter to the next. You could use weather station data and see what the coldest temperatures a given year received. You could track how many days the mercury dipped below freezing. You could measure the maximum temperatures and compare those year to year. However, for gardeners, commercial crop growers, and most other people, I think the most useful and intuitive comparison of winter intensity from year to year is chill hours.
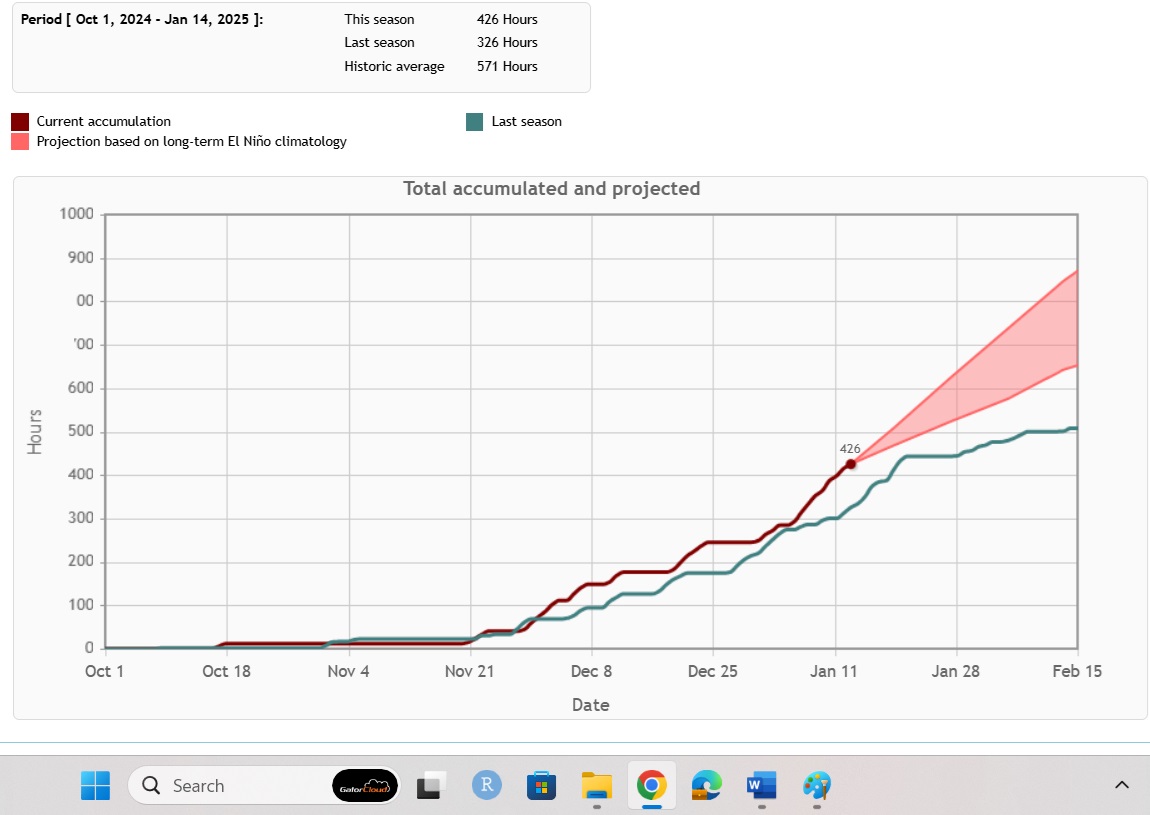
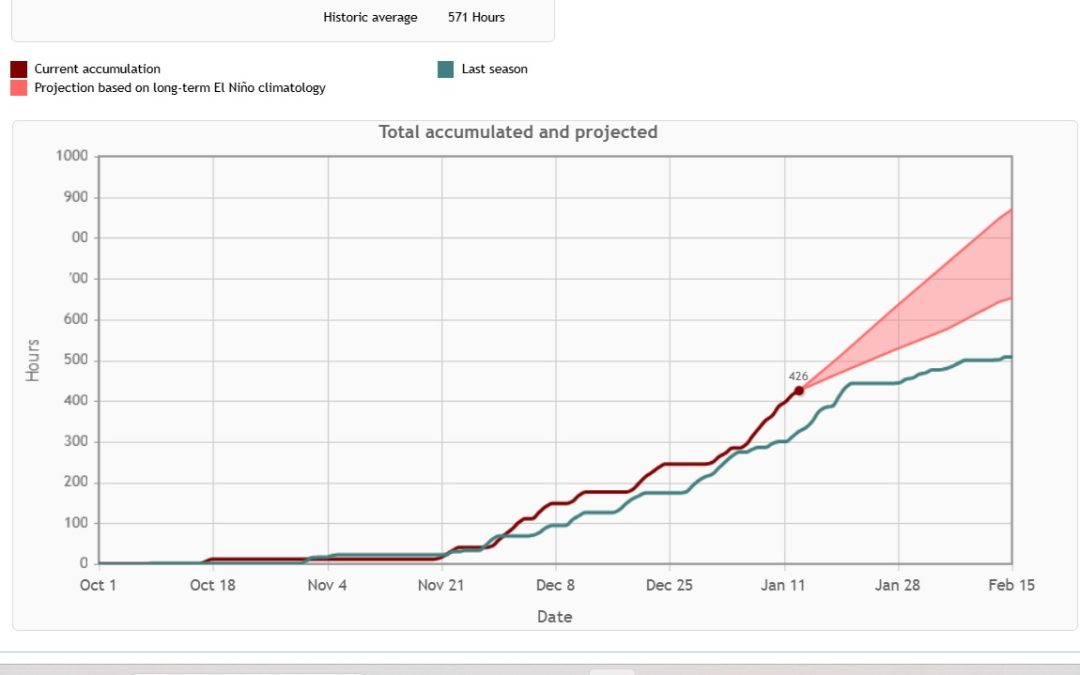
A chill hour is loosely defined as an hour below 45 degrees. Chill hours play a big role in deciduous fruiting plants flowering cycle and ultimately help determine if those plants make fruit the following year or not. While that is important to fruit growers, in this article, we’re more concerned with using chill as a relative comparison of winter intensity year to year. Last winter, the Florida Automated Weather Network (FAWN) station in Marianna (the closest one to Calhoun County that observes chill hours) logged 326 hours from the period of October 1 to January 14. This winter, that same weather station has logged 426 hours in the same period of time. A little elementary school math tell us we’ve received 100 more chill hours *so far* this year than we received last year – the equivalent of four entire 24 hour days under 45 degrees! That’s pretty significant. However, the historical average over the same time period is 571 chill hours, so we are still lagging behind what the area “used” to receive.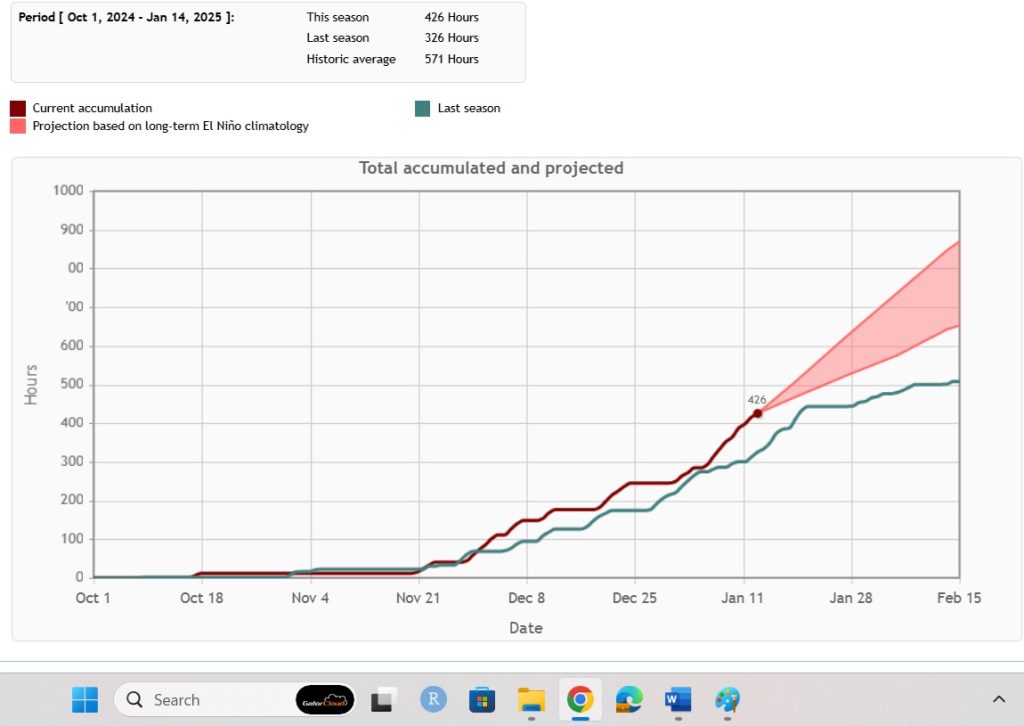
So yes, this winter has been colder than last at the time of this writing (January 16) and that isn’t even considering the extreme cold forecast for next week (week of January 20th) when you’re likely to be reading this. Things have been cold and are likely to remain that way for at least the rest of January, maybe beyond into February. However, it is important to remember that this year isn’t an outlier historically, as even this spat of recent cold finds us lagging our historical cold temperature norms a bit.
To track chill hours yourself, visit this website. For more information on our local natural resources and climate, contact your local Extension office. Bundle up out there an enjoy the coldest winter in several years!
by Daniel J. Leonard | Dec 20, 2024
The Panhandle isn’t known for its fall foliage. The best we can normally hope for are splashes of pale yellow amidst a sea of green pine needles, drab brown leaves killed by the first frost, and invasive Chinese Tallow trees taunting us with vibrant colors we know we shouldn’t have. However, in 2024, you’d be forgiven if you forgot you were in Florida and had instead been transported to a more northern clime where leaves everywhere turned brilliant shades of yellow, orange, purple, and red. I’ve heard comments from many folks, and I agree, that this is the best fall color we’ve seen here in a long time – maybe ever. So, why were the leaves so pretty this year? Let’s dive in.
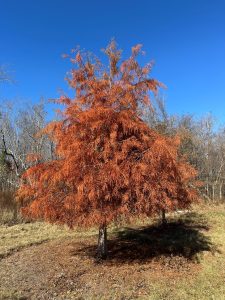
Bald Cypress displaying brilliant burnt orange foliage. Photo courtesy of Daniel Leonard.
What causes leaves to change colors in the fall?
First, what makes leaves of deciduous trees/shrubs (plants that shed their leaves in the winter) change color in the first place? The primary driver of leaf color change is daylength. During the summer, leaves appear green due to the presence of chlorophyll, which reflects green light, absorbs red and blue light, and is responsible for photosynthesis. When days shorten in the fall, plants sense that winter is coming and produce hormones that signal leaves to shut down chlorophyll production. They then initiate construction of a “wall” of cells that seals leaves off from the rest of the plant. When this happens, existing chlorophyll is “used up”, sugars build up in the now sealed off leaves, and other compounds that give leaves color, anthocyanins and carotenoids, take center stage. These compounds allow leaves to exhibit the familiar autumnal hues of yellow, red, orange, purple, and brown. However, plants go through this physiological process of shutting down growth and shedding leaves every year and excellent fall color, like what we experienced this year, doesn’t always result. There has to be more to the fall 2024 story.
Why were leaves so pretty this year?

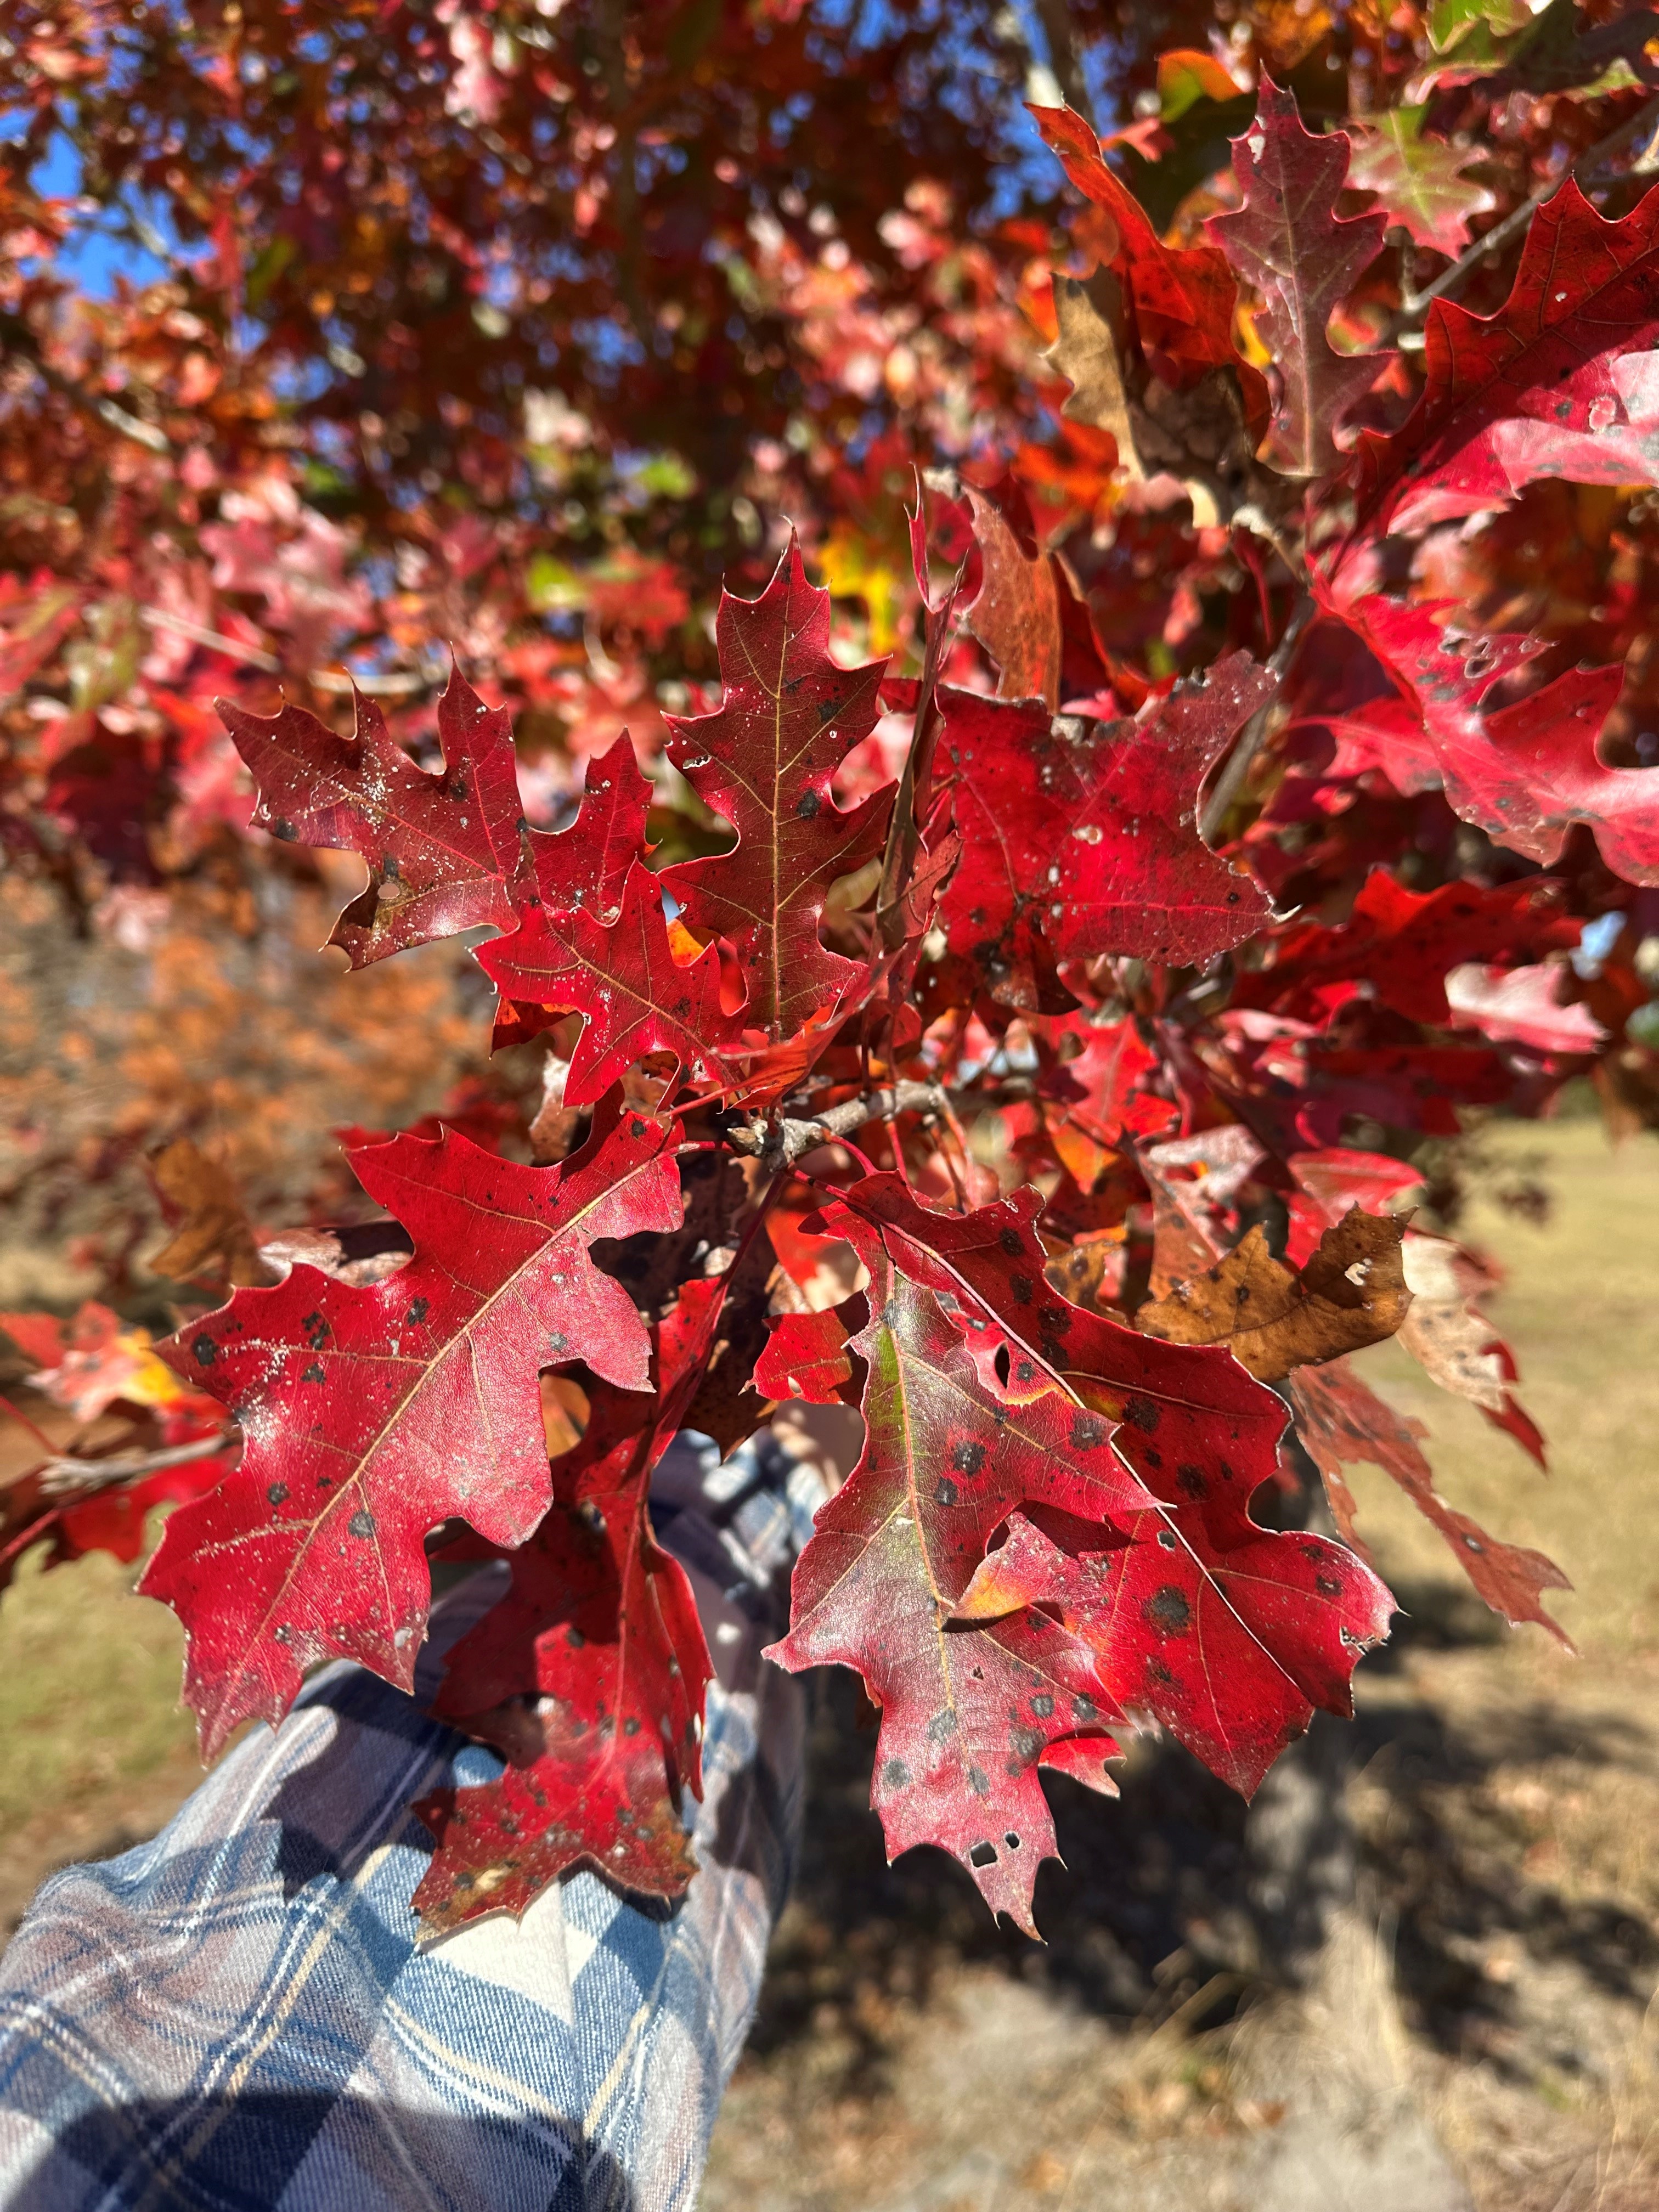
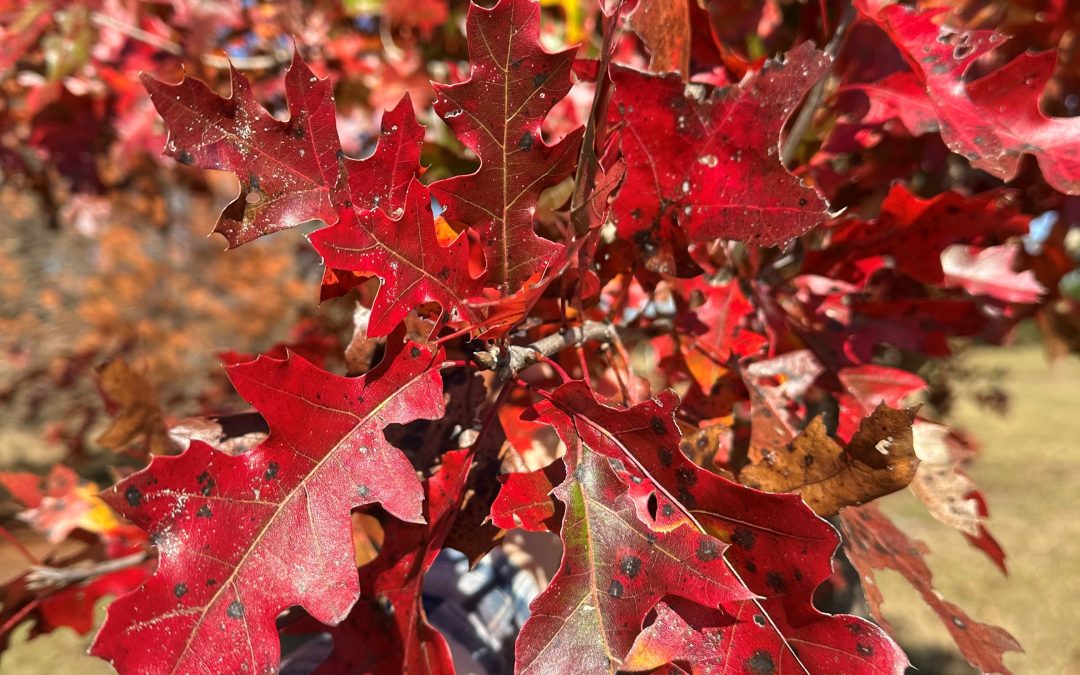
Shumard Oak exhibiting outstanding red fall foliage. Photo courtesy of Daniel Leonard.
A second factor is required for a great fall foliage show – weather. According to the U.S. Forest Service, ideal temperature and moisture conditions must be met for leaf color to be its most intense. Ideal autumn conditions include warm (but not hot) sunny days with cool (but not freezing) nights and adequate (but not excessive) moisture. Too hot and plants become stressed, lessening fall color potential. Too cold, and frost can kill foliage – turning it immediately brown and preventing color development. Too rainy or windy, and leaves can be blown off prematurely. 2024 brought neither extremely hot, extremely cold, or extremely wet conditions, and we were blessed to experience a Goldilocks fall color season.
Did Some Trees Have Better Color than Others?
While pretty much all deciduous trees exhibited their peak color potential this year, there were definitely standouts! Fortunately, many of the prettiest trees this fall also make outstanding landscape trees. Be on the lookout for the following trees in nurseries this winter and consider adding a few to your yard to take advantage of the next Goldilocks fall color year:
- Red Maple (Acer rubrum) – brilliant red fall leaves.
- Florida Maple (Acer floridanum) – yellow/orange.
- Deciduous Oaks (Quercus spp) – generally red to purple. Some species like Sawtooth Oak ( acutissima) are yellow.
- Green Ash (Fraxinus pennsylvanica) – yellow.
- Swamp Tupelo (Nyssa sylvatica) – crimson to purple.
- Sweetgum (Liquidambar styraciflua) – highly variable but generally reds, oranges, and purples.
- Bald Cypress (Taxodium distichum) – burnt orange.
For more information about fall color, which trees and shrubs produce great fall color and perform well in landscapes, or any other horticultural topic, contact your local UF/IFAS County Extension office. Happy Gardening!