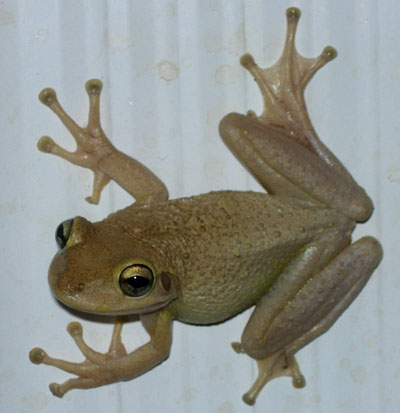
First, the invasion seems to be silently spreading. A just a couple of years ago we had very few records, one off individuals that were removed by those reporting. But they have slowly, and quietly, been spreading. A couple of years ago there was a report of a small group of them near Tyndall AFB in Panama City. Dr. Steve Johnson, University of Florida, decided to see if this small group survived the winter, they did. It was confirmed as the first breeding population in the panhandle. Then the one off reports began increasing again.
Photo by: Dr. Steve Johnson
One area in Santa Rosa County was recording numerous individuals. These reports continued over the winter, and it seems they were breeding there as well. In my neck of the woods, Pensacola, I am getting more calls about them. EDDMapS currently list 18 records in the panhandle. This is definitely underreported. Most of those are in the Panama City area. The entire invasion reminds me of the Cuban (Brown) Anole; quietly increasing numbers while we watch and wonder what to do.
Second has to do with that issue… what to do. Managing invasive plants seems to be easier that invasive animals. People seem to be fine with pulling or spraying weeds. But euthanizing animals is another thing. And I get it, I like frogs too. Ending any life is hard to do. This makes managing this species much harder.
One way to look at next steps is to stop the introduction of any more species. We are pretty sure the primary method of introduction is what we call “hitchhiking”. Most of the plants we purchase for our landscaping projects come from large commercial nurseries in south Florida. Here they are grown by the hundreds of thousands, loading on trucks, and brought to our part of the state. Unbeknown to us, other small creatures are hitchhiking on these plants and their containers. Some of these are invasive species like the Cuban (Brown) Anole, and the Cuban Treefrog. At one time, this was not as much of a concern because they would not survive our cold winters. But our winters are not as cold anymore. Hard freezes do occur, and this may still be our best management plan, but with fewer hard freezes breeding populations will be allowed to continue the invasion. And it could be that with higher numbers of Cuban Treefrogs in the area, some will survive these freezes to continue. This has certainly happened with the Cuban (Brown) Anole.
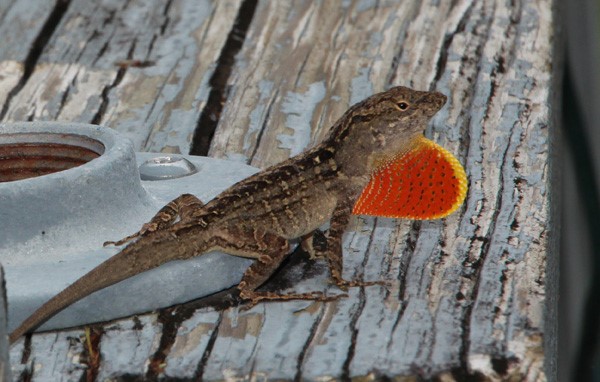
Cuban Anole. Photo credit: Dr. Steve A. Johnson, University of Florida
So, I am not sure. The answer may be no to this one. One thing we can do is help monitor their populations. When we see a Cuban Treefrog report it to EDDMapS or your county extension office. This will give us a better idea of how the invasion is going and whether they are surviving our winters.
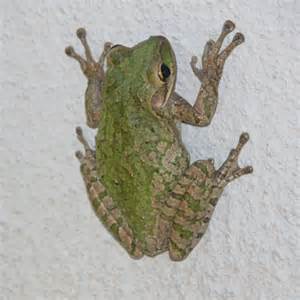
How do you know a Cuban Treefrog from our native species. Here are a couple of articles on how to do this.
If you choose to euthanize them, how do you do this humanely?
You can catch them using 3-foot sections of PVC pipe about 1.25” in diameter. These are placed vertically in the ground along the outside wall of a building near an exterior light source (where bugs are attracted). In the morning, check the inside of the pipes. If treefrogs are present, try to identify them. Cuban Treefrogs are the only ones in the panhandle that reach lengths of 4-6 inches. If they are all small, you will need to collect them and identify them using one of the publications listed above.
If you positively identify one, the first step is to confirm it. You can do this by contacting your county extension office. Second, report it to EDDMapS (www.EDDMapS.org). If confirmed, and you choose to euthanize it, the following link will explain how to do this humanely.
This situation is similar to the lionfish invasion we experienced 10 years ago. We know they are here, and we know they can be a serious problem. We are not sure we can eradicate them, but they should be managed. We will see how this goes.
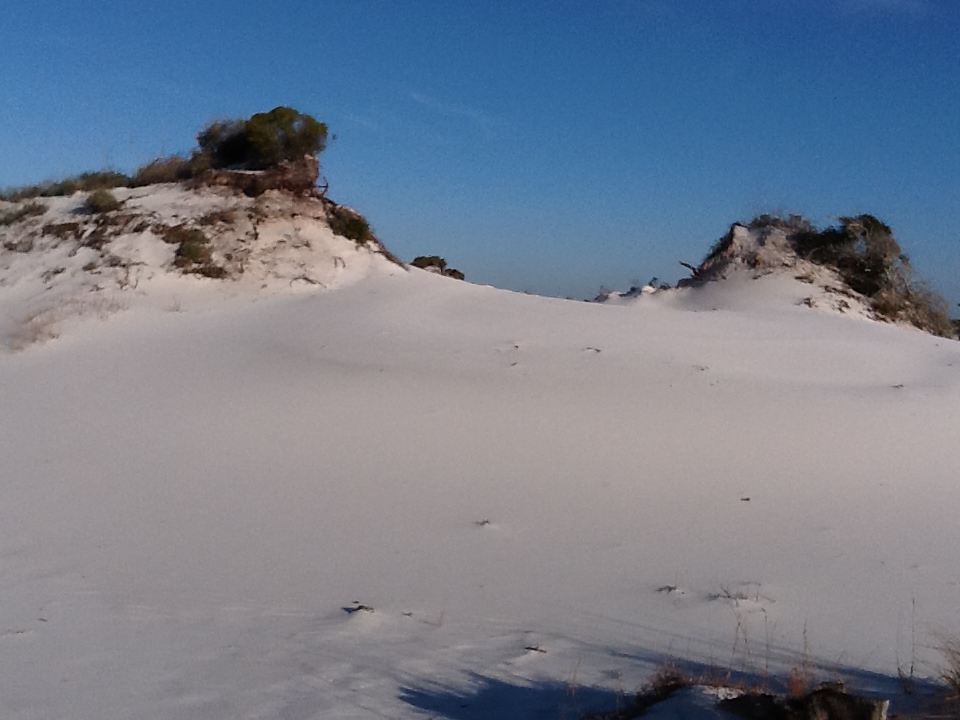
There are a lot of cool and interesting creatures that live on the barrier islands of Northwest Florida. The conditions out there require they make changes and adaptations different from what they would do in a more upland or wetland environment. Some creatures are unique to these beach and dune systems and found nowhere else. But to begin this series lets first look at the islands themselves.
The white beaches of the Florida panhandle are primarily quartz. Photo: Rick O’Connor.
The name barrier island comes from the fact that they do serve as a barrier between the open Gulf of Mexico and the mainland of the Florida panhandle, protecting coastal communities from storm surge and waves of the all too frequent hurricanes and tropical storms. They are basically sandbars formed with sands from the Appalachian Mountains. There the wind, rain, and temperature erode the granite rock into its mineral components and wash them downstream. First in the fast-moving mountain streams, then into creeks, into rivers which eventually discharge into the Gulf. The different minerals settle out based on their size, type, and densities. Quartz is one of the less dense and is the dominant mineral forming the coastal barrier islands, making them some of the whitest beaches on the planet.
When these quartz sands reach the Gulf, they encounter longshore currents that are formed from the winds blowing across the open water. In this part of the Gulf of Mexico these currents tend to move from the east to the west in most cases. As the rivers reach the passes that connect the estuaries to the open Gulf and the longshore currents move the sand into long thin spits at the mouth of the bays running parallel to the coastline. In some cases, the sand bars form perpendicular to the coastline, and we call them capes. Initially still connecting to land, many creatures can venture out on these sand spits searching for food. Some of the sand spits are very small and seem to come and go as the winds and waves move them. At times these smaller spits may actually close off the opening into the bay as they once did on Perdido Bay and still do with the Walton County dune lakes. In other cases, the spits accumulate more sand, become long and can eventually break contact with the mainland forming an island.
From the Pensacola Lighthouse you get a great view of the open Gulf and the eastern end of Perdido Key. Here the pass separates Perdido Key (on the left) and Santa Rosa Island. Photo: Molly O’Connor.
At first these islands can be nothing more than sand bars. Barely above sea level, moving and changing very quickly, sometimes disappearing and reappearing in slightly different locations after storms, such as Sand Island off Dauphin Island Alabama. In others they are larger, harder to move quickly and may be vegetated so that movement is slower and the island more established, such as Santa Rosa Island near Pensacola. The creatures on any of these islands will need to be able to adapt to the new conditions. Some will be able to leave and return the mainland when they need or want to. Birds are very common on all forms of barrier islands due to the fact they can fly. In some cases, the distance from the mainland is not a far swim for those who can, such at Indian Pass near St. Vincent Island. In some cases, the distance may not be as close and the currents between very swift during tide changes making crossing more difficult. In these cases, the creatures who find themselves on these islands must adapt to the new conditions or risk losing their populations entirely.
Island conditions can be tough. There is a lot of wind, and this wind carries salt spray. There is little cover from the intense sun during the summer months. Needed freshwater can be hard to find. Some islands will develop freshwater systems, but others will not. And then there is the fact that it is an island. Thus, a finite amount of resources and space for each species, and, at times, fierce competition for those.
In Part 2 we will explore the different habitats that developed on these islands that available for the different wildlife that exploit them.
The wind sculpted plants of the tertiary dunes. Photo: Rick O’Connor.
Based on the number of EDDMapS records for the panhandle – yes… we can.
And if these records are accurate – yes… we should.
I have seen the impact this plant can make. It has invaded Texas and Louisiana and has caused enough problems for the USDA to list it as one of America’s most noxious weeds. In Texas they have had “all calls” for anyone able to come to the state and help with management.
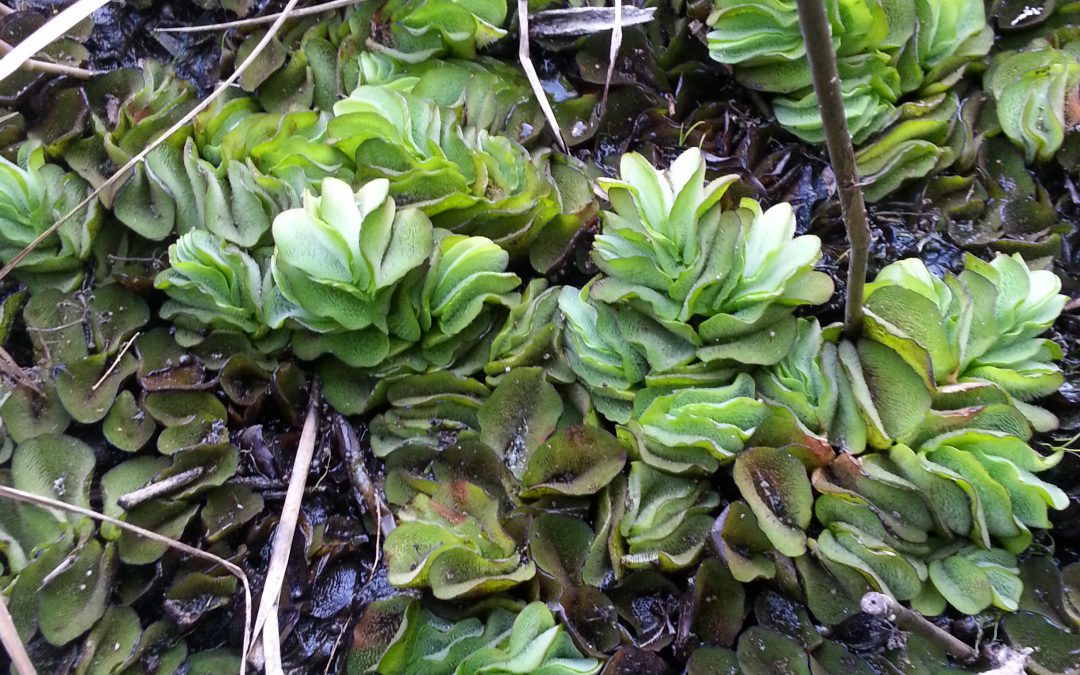
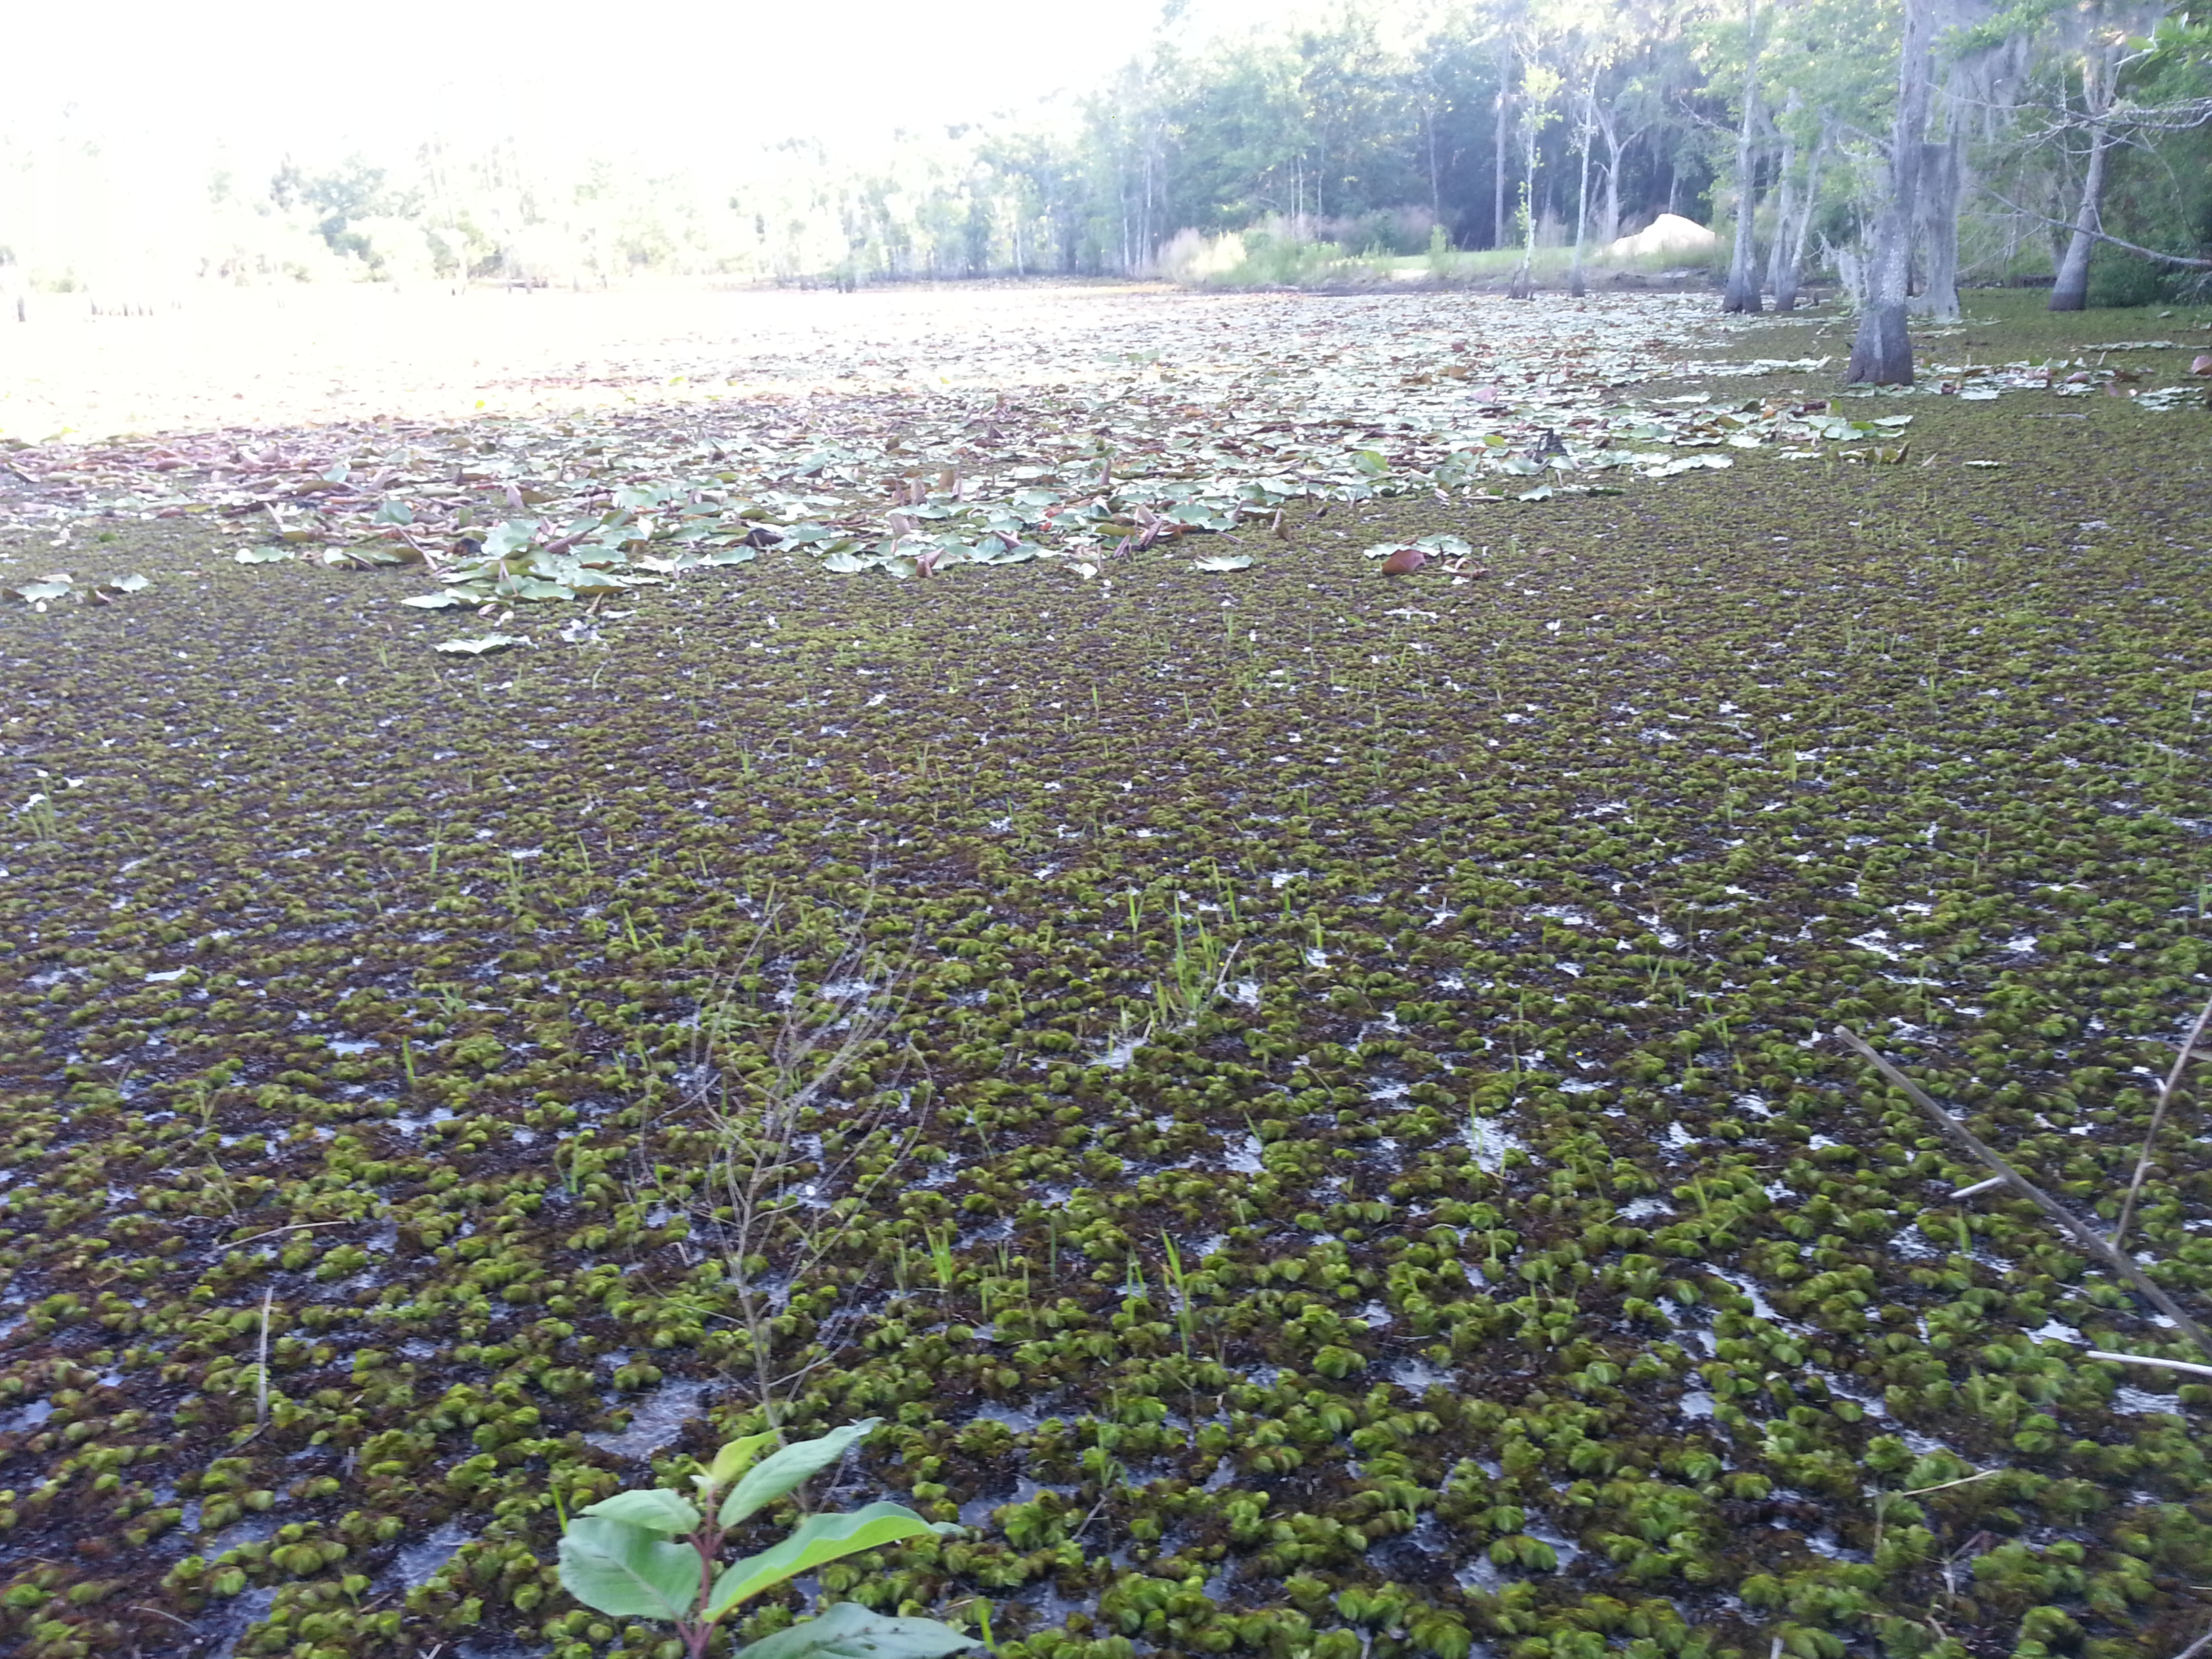
Giant Salvinia mats completely covering Bay County pond. This fast growing invasive can double in coverage every two weeks! Photo by L. Scott Jackson
I was camping in a state park near Shreveport LA. After we set up camp my grandson and I went to look at the lake. You could tell it was once clear water and cypress trees, but the water was completely covered with plant growth that looked, from a distance, like dollar weed and that there was no visible water at all. Completely covered. And then it hit me… THIS IS SALVINIA! Shortly after I saw the sign along the shoreline describing the plant and what to do to avoid spreading it. There was a yellow boom stretched across the surfacce to keep the plant from getting into the swimming area – but no one was swimming. The bottom was muck and I did not see any fish. There was no recreational activity at all. The boat ramp was completely choked with the weed, and I am not sure you could paddle through it anyway. It was a mess.
According to EDDMaps, there are only 14 records statewide, 11 of those are in the panhandle, and 9 of those are in Pensacola. We are certainly ground zero for the problem and FWC has been working over the last couple of years to eradicate it. All nine records are in Bayou Chico, and if FWC is successful at eradicating it, this will significantly make strides to eliminating the plant from the state. The other two locations in the panhandle are a retention pond at the northern arm of Deer Point Lake in Bay County, and a pond near Quincy FL.
Is this all of it?
Are there other sites with this plant that we do not know about?
I have been following EDDMapS records for a couple of years now and there are new records in central and south Florida -so, maybe.
If so, they need to be reported so that FWC can begin treatment. How would you know if the plant is present? How do you identify it?
Here are links to learn more about the plant. It prefers quiet/slow moving freshwater systems with plenty of nutrients. If you think the plant is present in your community, contact your county extension office to verify and report it.
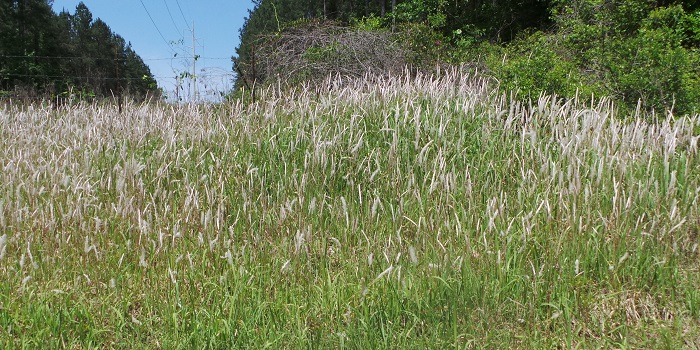
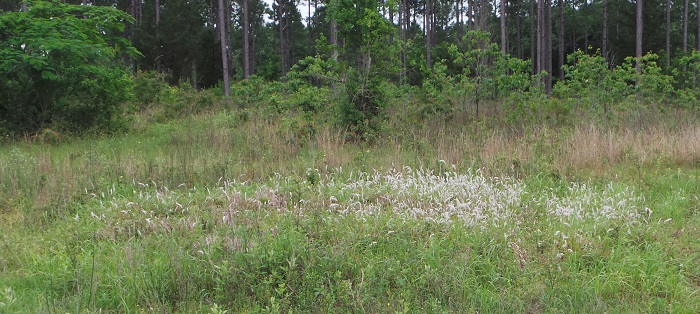
Most of us have heard of invasive cogongrass (Imperata cylindrica). It arrived in the early part of the of the 20th century near Mobile Alabama and has spread across the lower southeast. It is an aggressive growing grass with serrated leaves and silica imbedded in its tissue. This makes it very undesirable for livestock and a threat to pastureland across the region – though there are reports of wild hogs consuming it. It can also invade timberlands where it burns hot during prescribed fires to a point where it can kill the trees you are trying to manage. It is considered one of America’s worst noxious weeds.
A relatively new patch of cogongrass recently found in Washington County.
Photo Credit: Mark Mauldin
The abundance of this grass across the uplands of the Florida panhandle would indicate that it is far too established for eradication to occur. But what about the barrier islands? Is it a threat there and, if so, can it be eradicated?
I personally have seen the plant growing on Perdido Key in western Escambia County. I know of two locations where it currently resides. One is on public land, the other private, but we have not conducted a proper survey of the distribution on the Key at this point. Something we plan to do in 2023.
I also know it is found along Highway 98 at Gulf Islands Naval Live Oaks near Gulf Breeze in Santa Rosa County. I am not sure how many records the National Park has of the plant, or how widespread it is on the Gulf Breeze peninsula, nor do I know if it is on Santa Rosa Island/Pensacola Beach. Again, surveys are planned for 2023. We obviously need to know this before we can answer the question.
As of Nov 27, 2022 – there are 82,106 records of cogongrass in the U.S. – all are in the lower southeastern portion of the country. There are records as far north as North Carolina and as far west as the LA/TX line. Alabama is completely covered, as is much of the Florida panhandle.
As far as barrier islands, it is found on each of those within the state of Mississippi (10 records total). There are eight records on Dauphin Island AL, 16 on Ft. Morgan peninsula, eight in Gulf Shores AL proper, and nine in the Orange Beach AL area.
In Florida there are five records on Perdido Key proper, 13 more along the north shore of Big Lagoon, 125 along coastal NAS Pensacola, seven at Ft. Pickens on Santa Rosa Island in Escambia County, seven more at Naval Live Oaks in Gulf Breeze, six on Eglin property on Santa Rosa/Okaloosa Island, and 32 on Okaloosa Island between Ft. Walton and Destin. Here the western panhandle islands end. Between Perdido Key, Santa Rosa, and Okaloosa Islands proper – there are 50 records of the grass.
Along the coast between Okaloosa Island and Shell Island in Bay County, there are 44 records. There are no records on Shell Island itself but there are 86 records on Tyndall AFB. There is one record on Cape San Blas in Gulf County, one on St. Vincent Island and another along Highway 98 just west of Apalachicola in Franklin County. The barrier islands between Apalachicola and Bald Point have no records.
Based on this, the islands at the far eastern end of the panhandle should easily be able to eradicate these plants. The islands on the western end have more work to do, but a total of 50 records ON THE ISLANDS should be doable. This, of course, is based on the number of records being accurate, and I am sure they are under reported.
Step 1 – conduct surveys.
As with beach vitex, the first step is to accurately survey our islands to determine how widespread the problem really is, and then develop a management plan to possibly eradicate them.
Step – management
There are currently no known biological controls for this invasive plant.
Repeated disking and deep plowing have been shown to be effective in agricultural lands where it is possible to do. Mowing and/or burning when not in seed AND THEN CHEMICAL treatment has also had success. This should be done in the fall. Mechanical management alone has not been effective.
The chemical active ingredients of choice are glyphosate and/or imazapyr. As mentioned in the beach vitex article, imazapyr has a much longer soil activity and replanting cannot be achieved for several months. Replanting with native plants has been found to help control cogongrass but to do so quickly would require the use of glyphosate. In all studies, one chemical treatment was not enough.
This is a very tough noxious weed and early detection – rapid response (EDRR) is crucial at eradicating this species. We will begin Step 1 in Escambia County this year. If there are groups in other counties interested in doing the same, let us know and we will help where we can (roc1@ufl.edu).
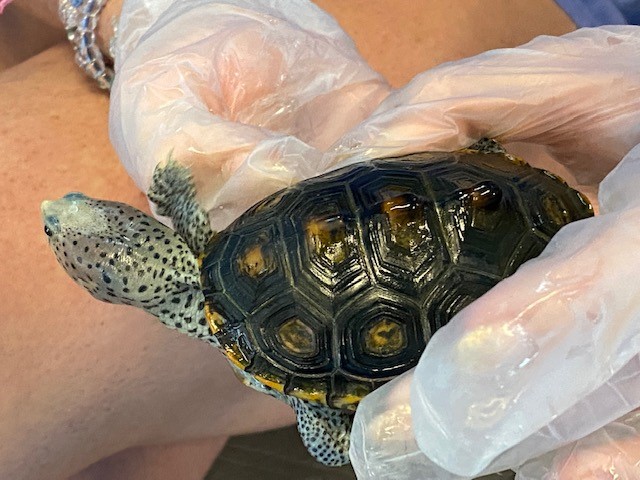
The diamondback terrapin (Malaclemys terrapin) is the only resident brackish water turtle in the United States. Ranging from Massachusetts to Texas. This estuarine turtle spends much of its time in coastal wetlands such as marshes and mangroves but have been found in seagrasses. They feed primarily on bivalves, have strong site fidelity, and live to be 20-25 years in the wild. Studies on their basic biology and ecology have been published throughout their range with the exception of the Florida panhandle.
In 2005 the Marine Science Academy at Washington High School (MSA) was asked to survey coastal estuaries within the Florida panhandle to determine whether diamondback terrapins (Malaclemys terrapin) existed there.
Methods – Presence/Absence
To determine presence/absence MSA identified boat ramps near suitable terrapin habitat. “Wanted” signs were placed at these ramps with our contact information and beach walk surveys were conducted seeking terrapins or terrapin sign. Since the best time to conduct beach surveys is May and June (not suitable for high school), that part of the project moved to program director and his family.
Surveys were conducted and terrapins were found in each of the six counties between the Alabama state line and the Apalachicola River.
Methods – Relative Abundance
The next question was to assess their relative abundance. To do this the team followed a protocol used by Tom Mann with the Mississippi Department of Natural Resources we call the “Mann-Method”. There are recognized assumptions with this method.
Every sexually mature female within the population nests each season.
Each female will lay more than one clutch per season but never more than one in a 16-day period.
You know where all nesting beaches are located.
The sex ratio to males is 1:1.
Going on these assumptions, every track, nest, or depredated nest on the nesting beach within a 16-day window is equivalent to one female. If the sex ratio is 1:1, then each female is equivalent to one male, and you have a relative abundance of the population. That said, there are publications suggesting the female: male ratio could be 1:3 or even 1:5 in the Florida panhandle. We would report the relative abundance as 1:1 – 1:5 for each nesting site.
Another method of estimating relative abundance is conducting a 30-minute head count. From a fixed location, or drifting in a kayak across the lagoon, every head spotted in a 30-minute period is logged. The assumption here is that if the average number of heads / 30-minutes increase or decreases over time, the relative abundance within the population is increasing or decreasing as well.
Trained volunteers conducted these surveys at least once a week at each nesting beach from April 1 to June 30 each year.
2022 Data Update
47 volunteers were trained in March of 2022; 21 (45%) participated in surveys.
173 surveys were conducted; 346 hours were logged.
Terrapins (or terrapin sign) were encountered during 43 of the surveys – Frequency of Encounters = 25% of the surveys.
Surveys occurred in Escambia, Santa Rosa, Okaloosa, and Bay counties. Encounters occurred in all counties except Bay.
Beach Surveys – 2022
County
# of Surveys
# of Encounters
Frequency of Encounters
Escambia
29
4
.14
Santa Rosa
58
15
.26
Okaloosa
43
25
.58
Bay
43
0
.00
TOTAL
173
43
.25
Head Count Surveys – 2022
County
# of Surveys
Range of Heads/30-min
Mean of Heads/30 min
Escambia
0
ND
ND
Santa Rosa
2
0-49
24
Okaloosa
17
0-32
11
Bay
0
ND
ND
Estimated Relative Abundance Using the Mann-Method
County
Nesting Beach Surveyed
Ratio 1:1
Ratio 1:3
Ratio 1:5
Relative Abundance for the County
Escambia
1
4
8
12
4-12 terrapins
Santa Rosa
1
12
24
36
2-48 terrapins
2
2
4
6
3
16
32
48
Okaloosa
1
24
48
72
2-72 terrapins
2
4
8
12
3
2
4
6
Bay
1
ND
ND
ND
ND
2
ND
ND
ND
Year
County
Relative Abundance
2008
Santa Rosa
14-35
2009
Santa Rosa
14-35
2010
Santa Rosa
32-80
2011
Santa Rosa
10-50
2015
Santa Rosa
12-30
2018
Santa Rosa
16-40
2021
Santa Rosa
4-12
Escambia
8-24
Okaloosa
4-70
2022
Santa Rosa
2-48
Escambia
4-12
Okaloosa
2-72
Terrapins Captured – tagged – and tissue samples collected
County
# of Terrapins Captured/Tagged/Tissue Collected
Escambia
1
Santa Rosa
2
Okaloosa
2
Bay
0
TOTAL
5
Results
At the beginning of this project Objective 1 was to determine whether diamondback terrapins existed in the Florida panhandle. That objective has been met – they do, we have at least one verified record in all six counties between the Alabama state line and the Apalachicola River.
Objective 2 is to determine the relative abundance within these counties. The first step in addressing this objective is to determine where terrapins are nesting in each. Nesting beaches have been identified in Escambia, Santa Rosa, and Okaloosa counties – but we are not sure whether ALL of the nesting beaches in those counties have been identified.
Known nesting beaches in Escambia County have changed over time. Two of the three nesting locations have become inactive in recent years and other potential beaches have not been adequately surveyed to determine whether they are being used or not. Based on one active nesting beach, the relative abundance of terrapins in Escambia County is low. Estimations using the Mann-Method suggest that there are between 2-24 terrapins present.
There are numerous potential nesting locations in Santa Rosa County but only a few have been adequately surveyed. Currently there two active nesting beaches being surveyed and the relative abundance at these has run between 30-80 animals at one location, 6-36 at the other. Going with this, there are between 6-80 terrapins present.
Okaloosa has only recently been surveyed. There are currently three active nesting beaches being surveyed and most of the nesting is occurring at one of those. The location of these beaches suggests that these are all animals of the same group or clad and part of the same population. Based on the results there are between 2-72 terrapins present.
Surveys are JUST getting underway in Bay County and no surveys have been conducted in Walton.
These data suggest that the relative abundance in each county is less than 100 and small when compared to other locations within their range.
Discussion
The results are only as good as the data being used. The volunteers participating in this project are doing an excellent job, but the frequency of nesting beach visits and head counts surveys are lower than needed to make accurate assessments. Several of the nesting beaches are in difficult places for volunteers to reach frequently and thus not surveyed as frequently as we would need. More volunteer participation could help this. Keep in mind that the Mann-Method also focuses on nesting females and males, immature females are not accounted for so the population would be slightly larger than estimated using this method. That said, we do believe that the populations in this part of their range are most likely smaller than other parts of their range. These surveys will continue. Questions or comments can be directed to Rick O’Connor, Florida Sea Grant, University of Florida IFAS Extension, roc1@ufl.edu.