by Rick O'Connor | Mar 3, 2022
The name lets you know that these are probably not good. What we call the Dirty Dozen are those invasive species who are in the high part of the invasive species curve. The section to the right that is red. They are widespread and abundant. They are here and not going anywhere. We are not going to get rid of them. Which brings us back to our first article, why bother then?
Here is analogy that many of you may relate to. There is a native green vine with thorns that grows in the Florida panhandle known as green briar (Smilax). It can be a horrible plant. Vines growing everywhere, thorns tearing at your skin and cutting your clothes. I have seen it growing next to my house literally overtake a large pine tree. It grows over shrubbery, landscape lattice, just a real pain. We do not like it. I cannot get rid of it, it is here to stay, so – why don’t I just walk away and let it grow?
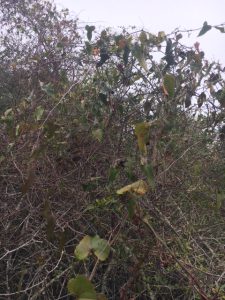
Smilax, green briar, is a nuisance native plant.
Well, we know what will happen. It will overtake our landscape a create a ball of briars and thorns. I ran into such a place while hiking on Pensacola Beach recently. It was absolute hell trying to get through and I will always walk around such a mess again. Yes… we will manage it in our yard. We will not let it go. And so goes the Dirty Dozen. We should not ignore.
The Dirty Dozen are the top 12 problematic established invasive species within the Six Rivers CISMA selected by its members. A lot of species could be on the list, but the members felt they were having the toughest time with these twelve. Let’s meet them… (these are in no particular order).
- Callery (Bradford) Pear. Yes… this was listed as an EDRR yesterday. I am not sure where this fits. It is either a large EDRR issue, or a small Dirty Dozen (D-12) problem. There are 174 records of this plant in the Florida panhandle and most records come from the Blackwater Forest area. I think this is because they have an aggressive invasive species management program and do an excellent job reporting. It is probably quite common everywhere.
- Chinese Privet. Interestingly, in my mind, this is a north Florida problem. During my travels in south Florida, I never see it, but along I-10 you see it everywhere. It is sort of our Brazilian pepper (a major south Florida problem). And it is everywhere. There are very few places, urban or natural areas, where I have not seen it. Many may not even know what it is.
- Chinese Tallow. This is the famous popcorn tree and yes, its everywhere. One thing I have noticed about this plant is that it seems to move into disturbed areas. Along roadsides and trails, housing developments and agricultural lands. I have seen one grove take over a retention pond, this plant does not seem to have a problem with wetland habitats. This is also the one that beekeepers say make great honey. It is toxic to livestock and wildlife.
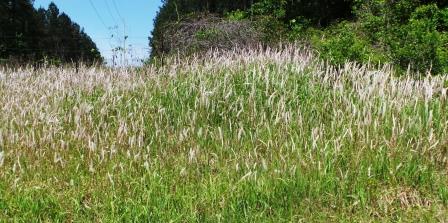
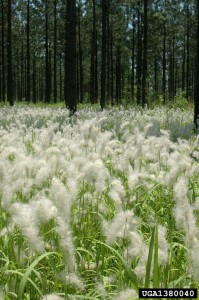
- Cogongrass. This invasive plant appears to have entered the U.S. on pallets entering the Port of Mobile. It quickly spread from there across south Alabama, Mississippi, and covers much of Florida. It is easily transported by mowing vehicles that try and mow it down. Many land managers have now learned this and have adopted better practices. It has leaves with serrated edges and silica. Livestock and wildlife do not eat it. It is considered a federal noxious weed and one of the worst invasive species we deal with by many land managers and biologists.
- Feral Hogs. Wild pigs, or feral hogs, are a problem. They destroy large tracks of habitats digging for food. They are very resilient to management efforts and are a real problem for private and public landowners.
- Japanese Climbing Fern. This is the north Florida cousin to south Florida’s Old World Climbing Fern. Both are bad news completely overtaking the landscape as green briar does. Managing it is difficult and it spreads easily by spores. Sometimes managing it can enhance its dispersal.
- Japanese Honeysuckle. My experience with this plant is that it is not as abundant as Japanese Climbing Fern, but where it is found it is aggressive and most be managed.
- Kudzu. Enough said… This could be the poster child (and often is) for invasive species problems. It is a much larger problem in Alabama and Georgia, but north Florida certainly has its problems with it. Like so many of these D-12, it is difficult to manage.
- Mimosa. I grew up with this tree in our landscape and had no idea it was (a) nonnative and (b) an invasive plant. It falls into that category of invasive species that is pretty and people enjoy having it in their landscape. The problem associated with it is that it out competes native species. There is the threat of decrease biodiversity and so, it is listed as invasive. For those trying to manage it in our area, they consider it one of the D-12.
- Red Fire Ant. No one likes this creature. Well, maybe Dr. E.O. Wilson did, but everyone else does not like this animal. We are all too familiar with how aggressive this animal can be and how painful their bites are. They can be found in a variety of landscapes and spread quickly. Their impacts are huge and, as many of you probably know, their management difficult.
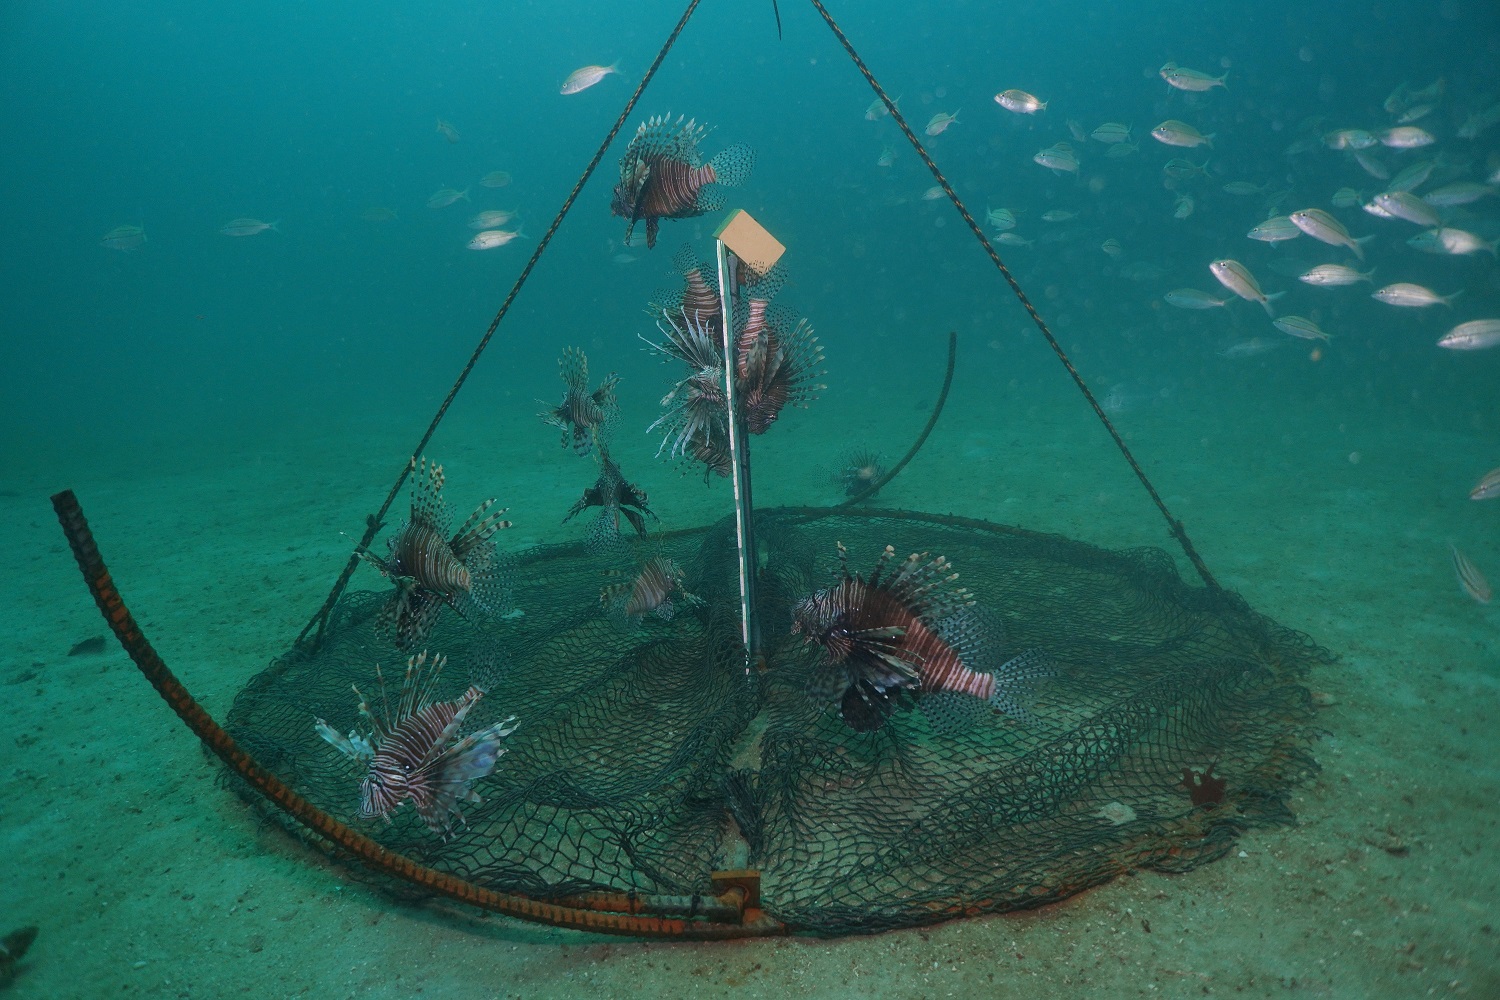
- Red Lionfish. This is one that most know about now. This has been reported as being one of the worst invasions of all invasive species ever. Producing an average of 30,000 fertilized eggs/female/week and the fact that they can live to depths of 1000 feet makes management very difficult. However, there has been some success in depths less than 200 feet, and, like all D-12 species, you just have to keep at it. Don’t let the “green briar” overtake.
- Those who know this grass know how hard it is to manage and how quickly it spreads. The team with Gulf Islands National Seashore has been battling it for awhile now. It likes to grow along the waters edge and can be submerged for a short period of time. Those who do not know it, may have it along their waterfront.
Again, these are invasive species we let get to point where management is almost a full-time job and the cost of doing so it quite high. This is why it is so important to manage the EDRR species and avoid this problem. It begins with education of the issue, which we hope you are getting.
Tomorrow is the last day of NISAW 2022, and we will finish with a discussion on what you can do to help manage this problem.
by Rick O'Connor | Mar 2, 2022
Early Detection Rapid Response (EDRR)
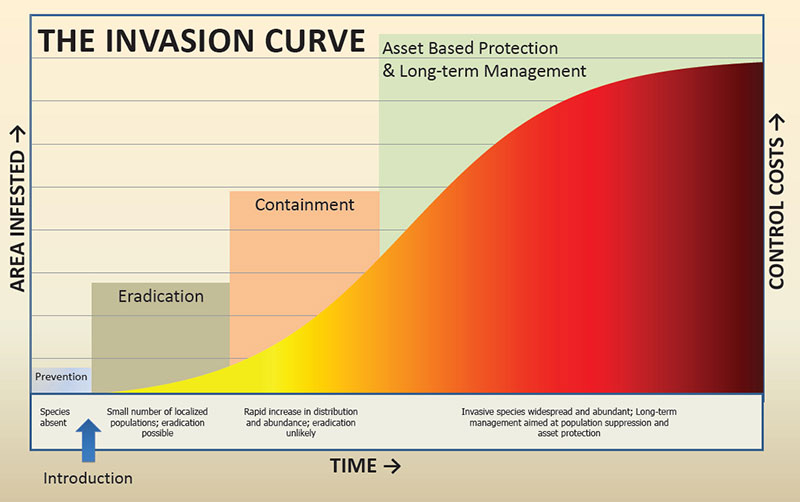
To understand better what this is you can look at the graphic below of the “invasive species curve”.
You will notice that across the x-axis is time, increasing from left to right. On the y-axis you have area covered on the left and control costs on the right. You will notice the longer you allow an invasive species to go unchecked in your community, the more it will spread, the more it will cost to manage, and you will reach a point where eradication is no longer an option. As a matter of fact, if you are serious about eradication, you will need to manage this species in the early stages of the invasion.
We have mentioned in previous articles the cost of managing invasive species. Annually, the U.S. spends about $120 billion doing this. If you want to reduce these costs, and avoid the problems these species bring with them, you need to identify and remove them from the landscape early in the invasion.
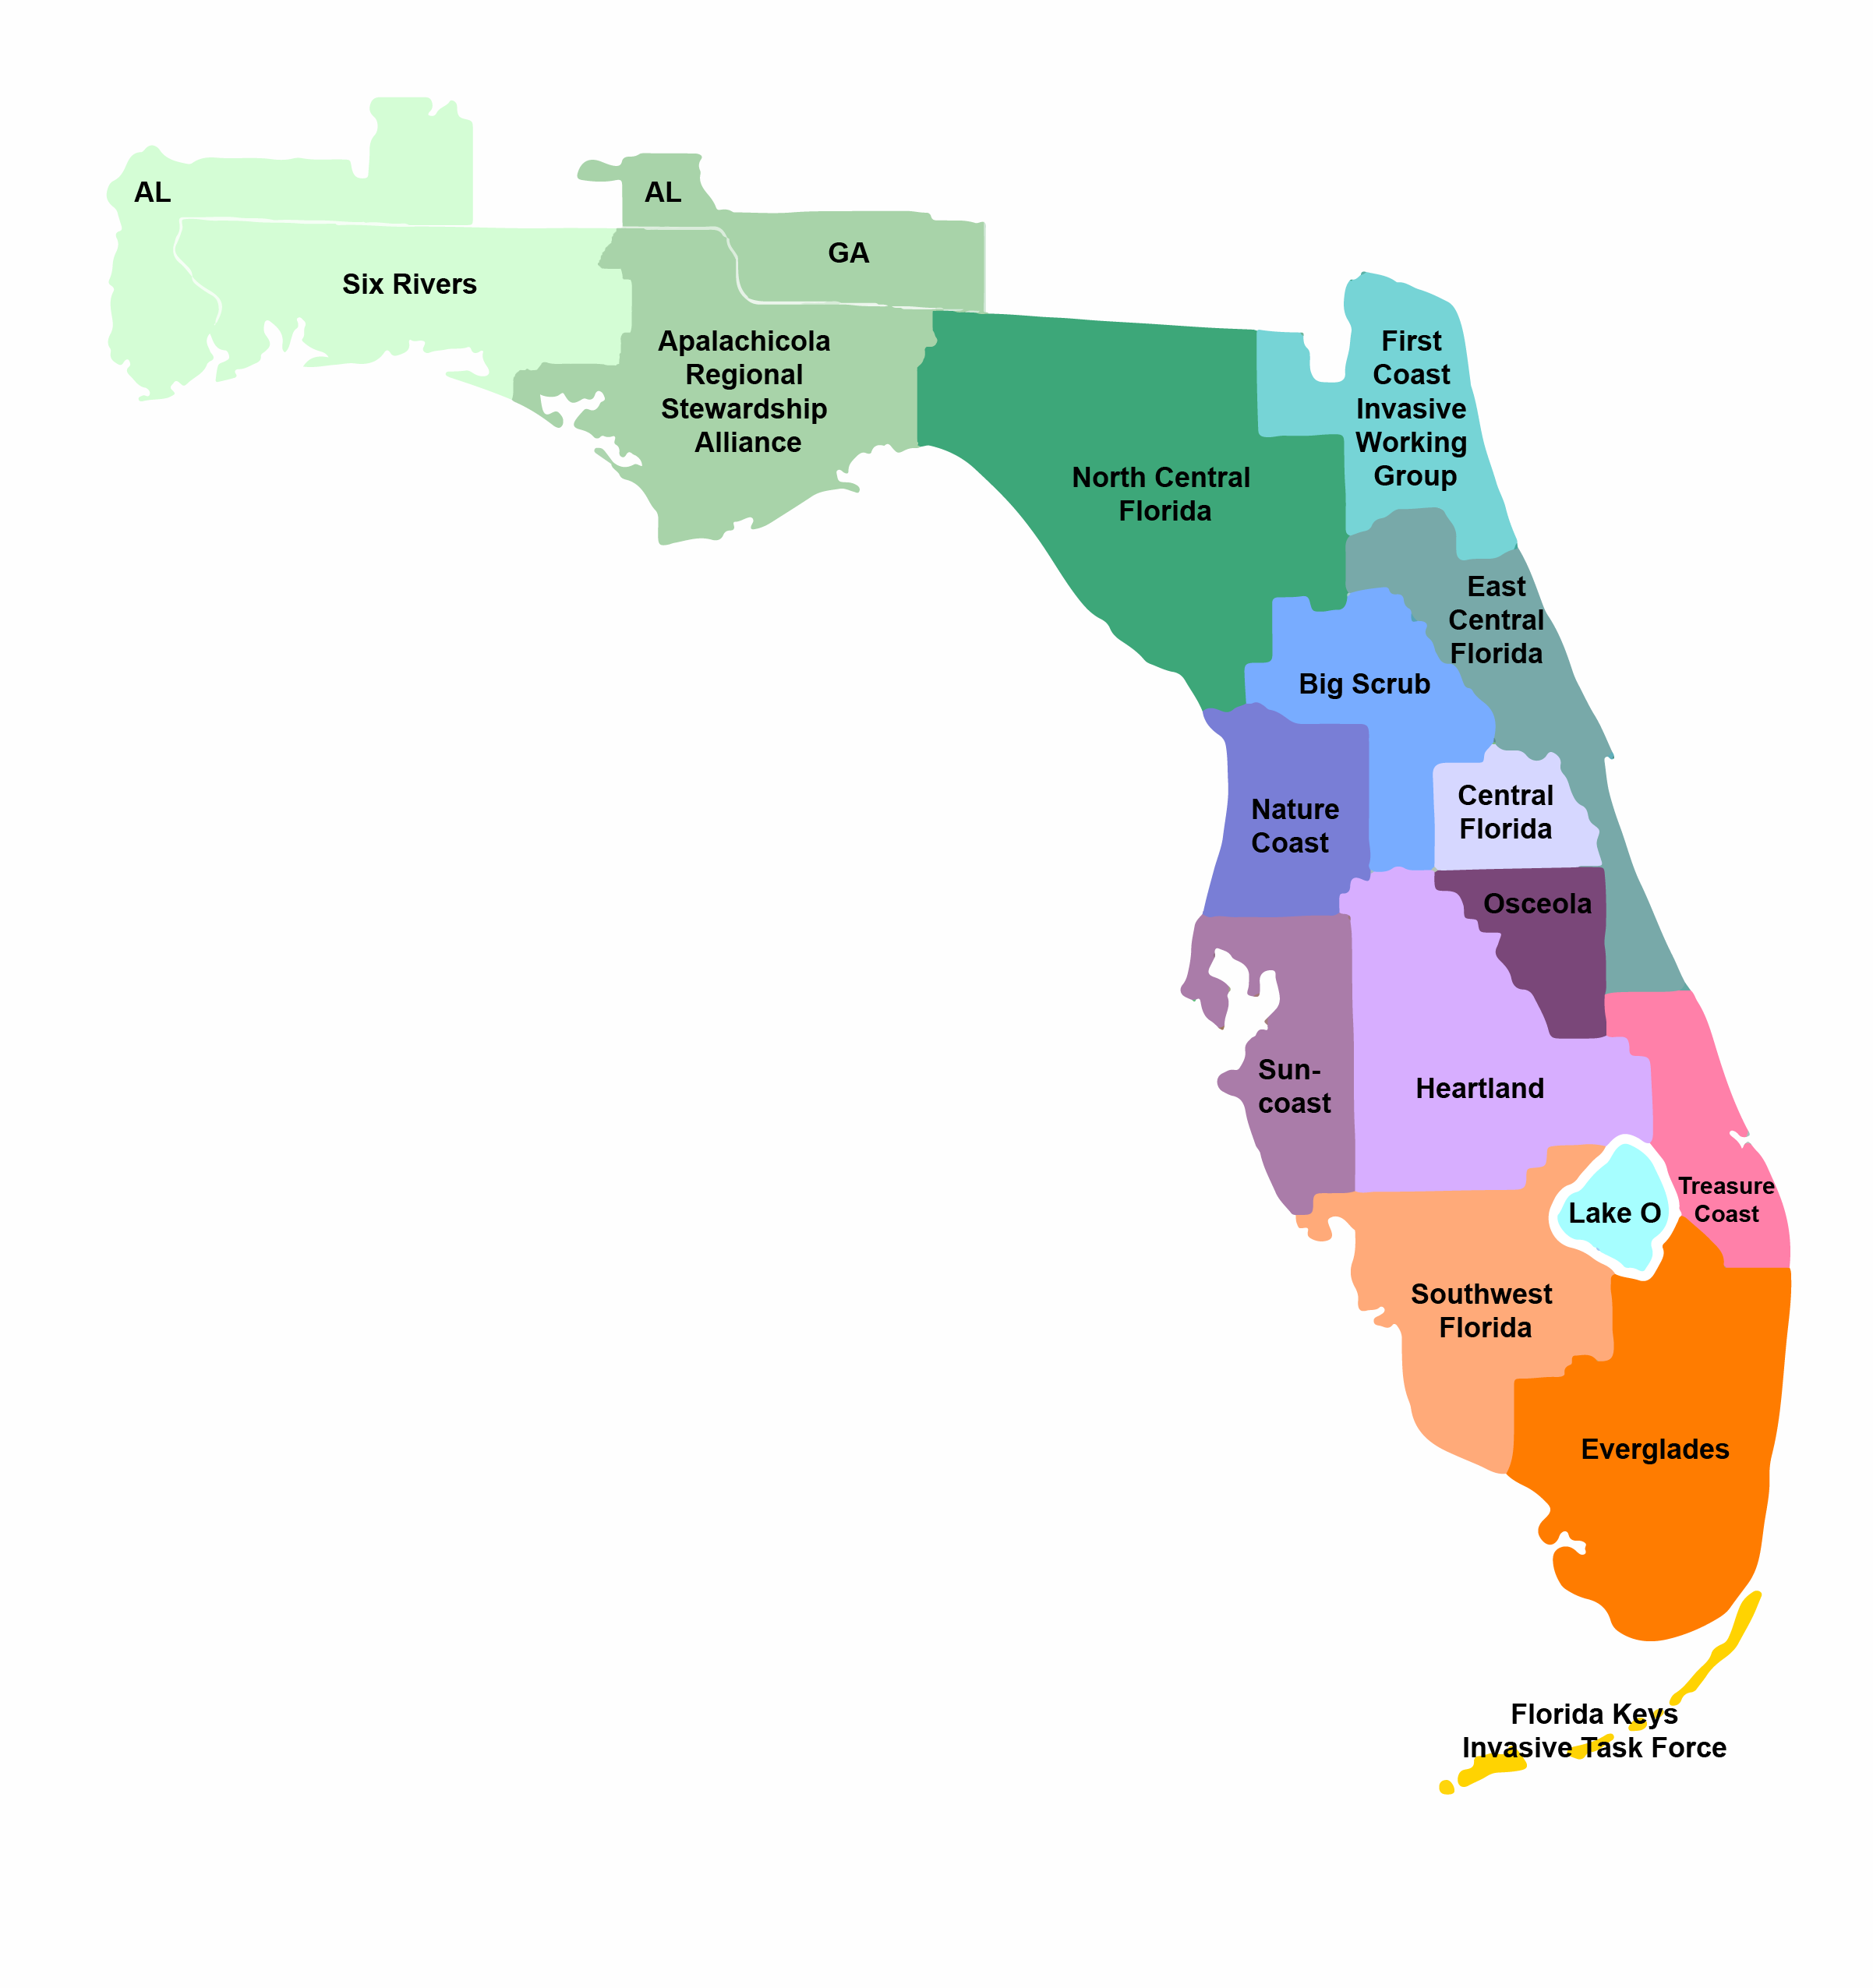
Florida CISMAs
Early Detection Rapid Response (EDRR) species are those that are not present in your community but are in nearby ones or are in your community but in very low numbers. You will see step 1 in the curve is to prevent the species from reaching you. The state of Florida is divided into 15 Cooperative Invasive Species Management Areas (CISMAs) where professionals within manage and educate the public about invasive species. One method of detecting a potential EDRR species is to see what nearby CISMAs are dealing with. You can find records of these species by searching EDDMapS, a national invasive species database (www.EDDMapS.org). Often the records are under reported and the actual number within/near your CISMA is higher. At that point you can educate your community about them and possibly prevent them from entering your CISMA. Likewise, if they are already within your CISMA in low numbers, it would be considered an EDRR species and action should be taken now.
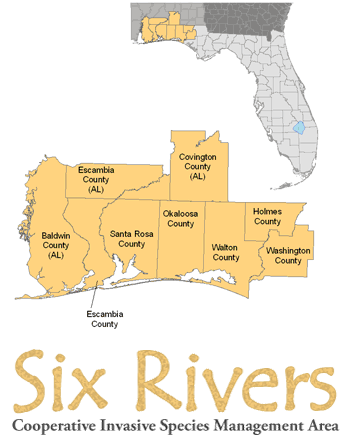
Here in the western panhandle, we belong to the Six Rivers CISMA, which includes three counties in Alabama. During the shutdown of the pandemic, we were able to update our EDRR list and are currently developing fact sheets for each. Here is our EDRR list – it is in no particular order.
- Eurasian milfoil. This is an aquatic weed that was introduced via the aquarium trade. There are currently 12 records within Six Rivers and 12 in the eastern panhandle for a total of 24 records. There is quite a lot of this plant in the Mobile Delta area.
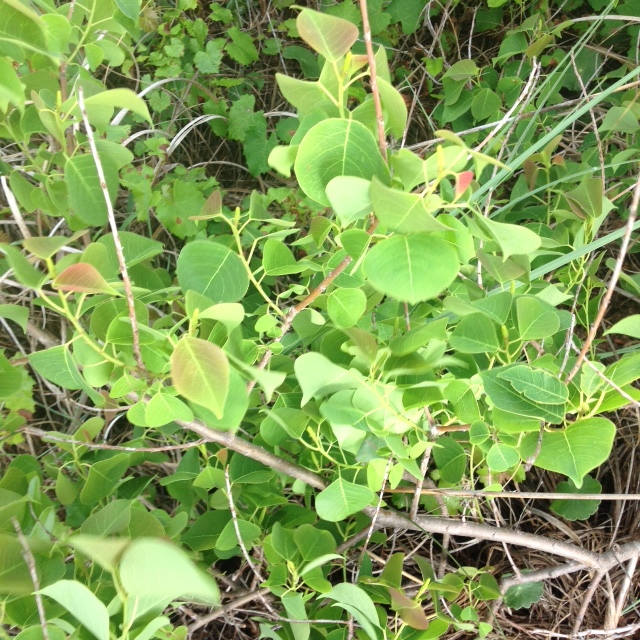
- Beach vitex. This is a beach/dune vine that eventually becomes a shrub. There are currently 83 records within the CISMA and five in the eastern panhandle for a total of 88 records. Almost all of the records are from the Pensacola Beach area.
- Argentine Black and White Tegu. This is a 3–4-foot lizard from South America that has caused a lot of problems in central and south Florida. There are seven records within Six Rivers and seven more from the eastern panhandle for a total of 14 records. There is no evidence of breeding populations here. It is believed these are escaped pets. One escape was from a breeder in the western panhandle, but all animals were captured but we keep an eye out.
- Callery (Braford) Pear. This is an ornamental tree that many have purchased and planted. There are 169 records within Six Rivers and another five in the eastern panhandle for a total of 174 records. This is most likely from better reporting in the Six Rivers, much of it coming from the Blackwater Forest area, where it is under management.
- Cane Toad. This is a large toad that produces a strong toxin that has killed dogs. It is a much larger problem in central and south Florida but there is one record within Six Rivers and another in the eastern panhandle for a total of two. Though there was a question on identification of the one within Six Rivers, it was eventually verified. Like the tegu, there is no evidence of breeding populations here, but we keep watch and remove if found.
- Channeled Apple Snail. This species is famous for the problems it has caused with the snail kites in central and south Florida. There are no records of it in Six Rivers and only two in the eastern panhandle, but it is feared that this species may be more common than the records suggest.
- Coral ardisia. This is a beautiful plant that produces beautiful red berries but is a problem. It takes over patches in hardwood habitats and has invaded natural areas. There are 14 records within Six Rivers and 407 in the eastern panhandle for a total of 421 records. This plant may have originally escaped cultivation in the eastern panhandle hence the high numbers there.
- Cuban Treefrog. This is a large treefrog that consumes all others, as well as other forms of wildlife. There are 13 records within Six Rivers and 19 in the eastern panhandle for a total of 32 records. There has been increasing number of reports from the Six Rivers CISMA suggesting that this is a species that needs immediate attention.
- Giant Salvinia. This is floating plant that resembles duckweed, but the leaves are larger. There are 10 records within Six Rivers and two more in the eastern panhandle. These are the only known records of this plant in the entire state. Those within Six Rivers are in Bayou Chico. There is an effort by FWC to eradicate this plant, but public help is needed.
- Green Mussel. This is a beautiful emerald, green mussel that grows in clumps on pilings and rocks in marine waters. There is only one record within Six Rivers and no records from the eastern panhandle. The lone specimen was found in Pensacola but was not verified. It is a problem in peninsula Florida so keeping an eye out for it is smart.
- Greenhouse Treefrog. This is a very small treefrog that has been found in local gardens. There are five records from Six Rivers and two others from the eastern panhandle for a total of seven records, but it is believed to be more common than this.
- Guinea Grass. There are 18 records of this plant within Six Rivers and five additional from the eastern panhandle for a total of 23 records.
- Hydrilla. This is another aquatic grass brought in for the aquarium trade. There are eight records within Six Rivers and 28 from the eastern panhandle for a total of 36 records. This is a big problem in the peninsula part of the state, and we spend a lot of money controlling it.
- Natal Grass. This is a wiry grass that grows in more open fields and has a pretty tuft of small red flowers at the top giving the landscape an interesting reddish look – but it is invasive and needs to be controlled. There are 31 records from Six Rivers and 21 more from the eastern panhandle for a total of 52 records.
- Skunk Vine. There is only one record within Six Rivers, but this is probably under reported. There are an additional 16 records from the eastern panhandle for a total of 17 records.
- The Snail. It is called “the snail” because no common name has been given. The scientific name is Bulimulus sporadicus and it appears to have been introduced in the Jacksonville area. From there the snail seems to have followed the railroad lines, possibly from cargo, and has begun to spread. There are no official records from EDDMapS from the Florida panhandle, but it has been found by many gardeners. More needs to be learned about this potential threat and more records are needed.
- Swamp Morning Glory. This is an aggressive growing vine that has been problematic for property owners who have it. Currently, there are only two records from Six Rivers and no records from the eastern panhandle, but this is probably another under reported species.
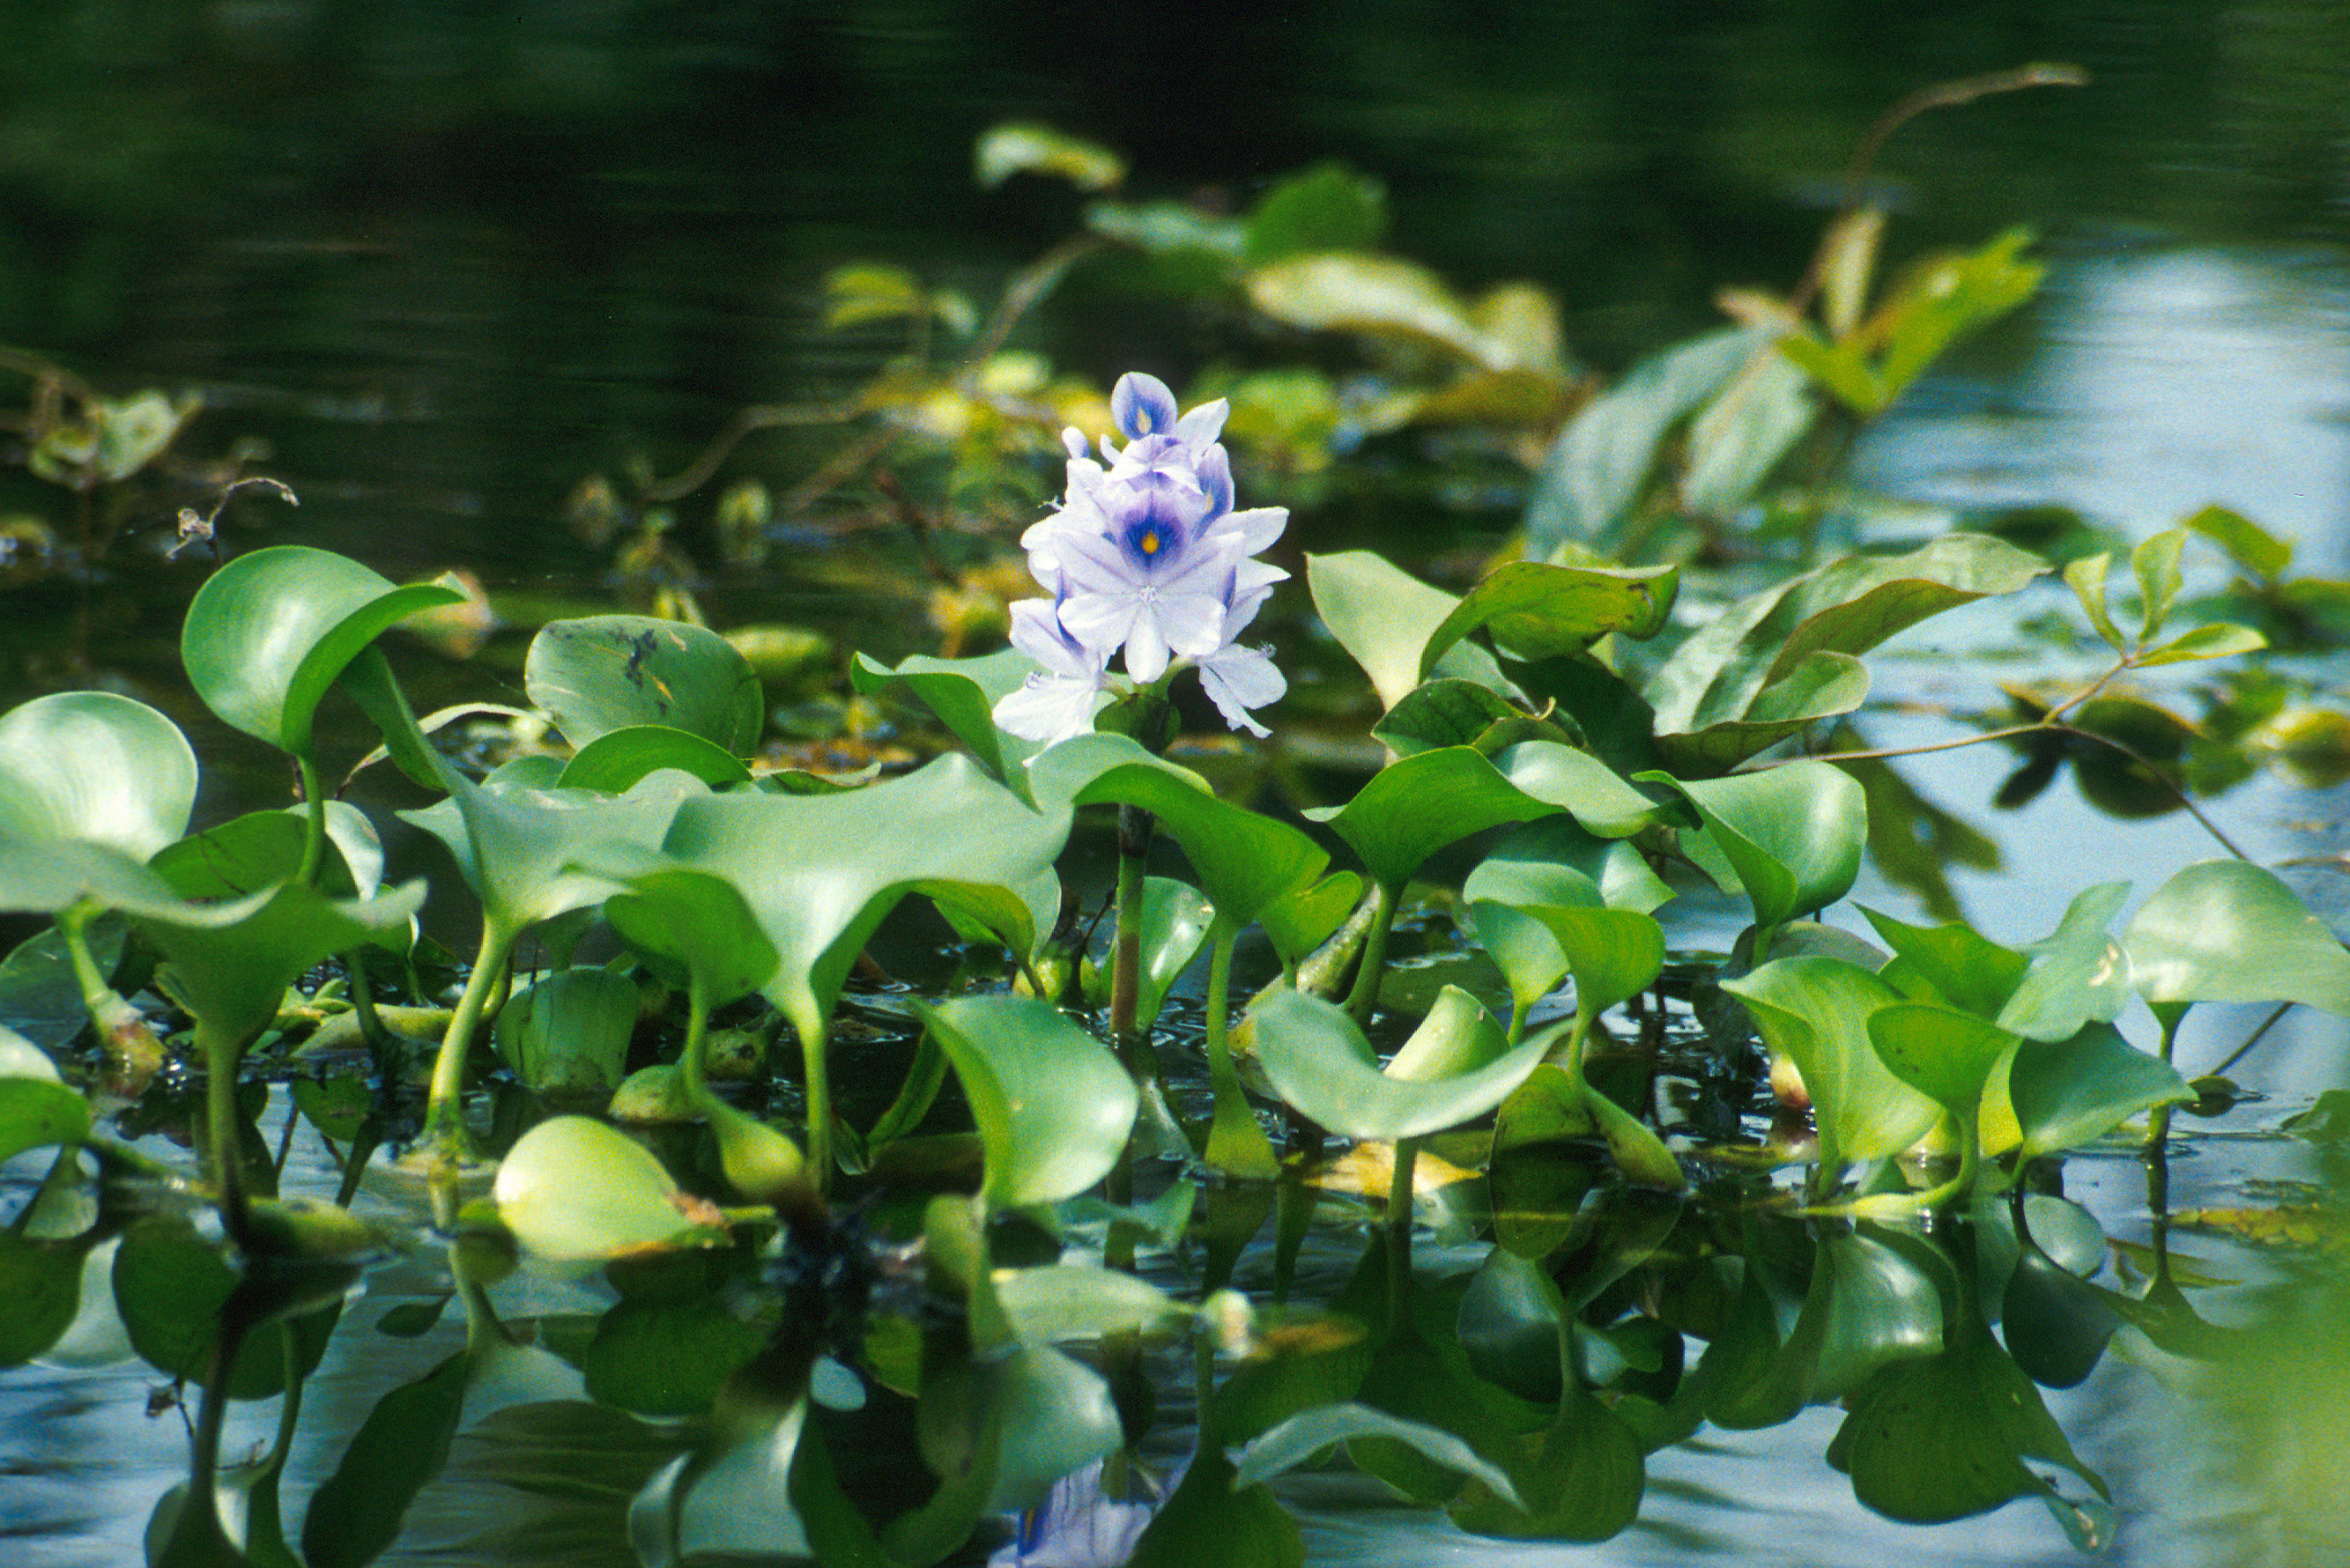
- Water Hyacinth. This is a well-known floating plant with beautiful purple flowers. But it will overtake waterways quickly changing the entire ecosystem and potential hampering economic opportunities within those waterways. There are 21 records within Six Rivers and 256 in the eastern panhandle for a total of 277 records.
These are the EDRR species for our area. As mentioned, they are under reported and help is needed to improve this. Help is also needed in preventing the spread of them. Cleaning equipment, like tractors, ATVS, and boats before moving is a good start. Being mindful of what you purchase at the store, and what may be “hitchhiking” on it is another good practice to help. And, if you do find on your property, reporting and removing it will also help.
If you have questions about identification and safe methods of removal, contact your county extension office. Tomorrow we will look at the “Dirty Dozen” invasive species for the Florida panhandle.
by Rick O'Connor | Mar 1, 2022
Based on the definition we use for an invasive species, they got here because of us. It may have been unintentional, but it was still humans who assisted their arrival.
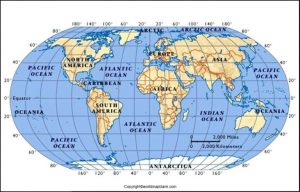
Each species has a biogeographic range.
All species have a biogeographic range. There is some point of origin, where they first appeared, and then a dispersal process as their populations moves across the landscape. Dispersal is driven by competition, usually with your own species, but can be with others as well. If there is no longer food or space for the number in the population, they move to new territory – dispersal. This dispersal continues until they encounter some sort of barrier, something that stops dispersal. Barriers can be physical, like a river or mountain range. They can be biological, like the lack of their needed food or the presence of a new predator that you have no defense against. They can be climatic; it is now too cold or too hot. Whatever it is, it stops dispersal, and the species now has its geographic range.
Mountains and rivers can be barriers to species dispersal.
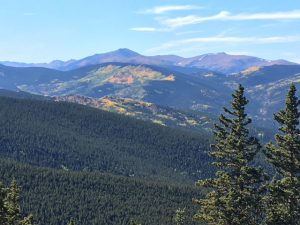
Kangaroos and wallabies are isolated on an island we call Australia. Australia is very large, and the physical features and climate vary so, kangaroos are not found over the entire continent. Many of the plant and animal species that originated in Asia would have a difficult time reaching North America. Many birds have few physical barriers because they can fly over most of them. But their dispersal can still be impeded by biological or climatic barriers. Species that have very large ranges are called cosmopolitan, like seagulls. Species with small ranges are referred to as endemic species, like the marine iguana of the Galapagos.
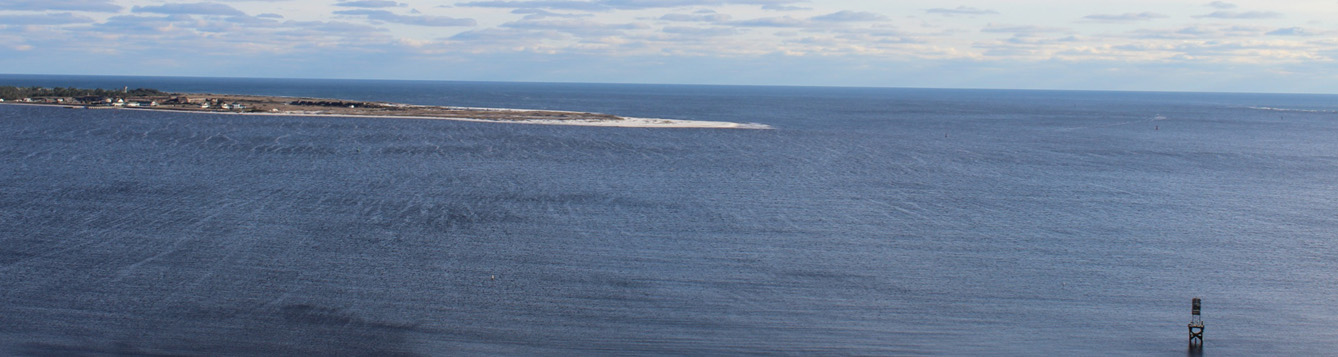
Islands can be difficult for many species to reach.
For invasive species then, we are talking about those that would have a very difficult, if not impossible time, reaching Florida – but did so because we brought them here, we got them past their natural barriers.
In many cases this is intentional. In the early history of Key West, it was the home of many sea captains who often brought exotic plants from around the world to plant in their yards. Banyan trees for example, are not native to Florida, but are found in Key West. Orange trees were introduced by us, as were thousands of ornamental plants for landscaping, and sugar cane for agriculture. Most of these would not have found their way to our shores without us.
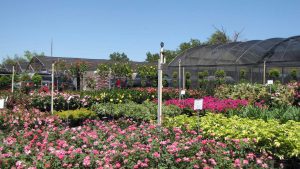
Nurseries provide native and nonnative plants.
And there were many animals that reach Florida because we intentionally brought them. Horses, pigs, cattle to name a few. There are of course exotic pets like boas, monitor lizards, and tropical fish. There are reports of some coyotes being introduced for the purpose of hunting, though we know that coyotes dispersed into Florida naturally as well.
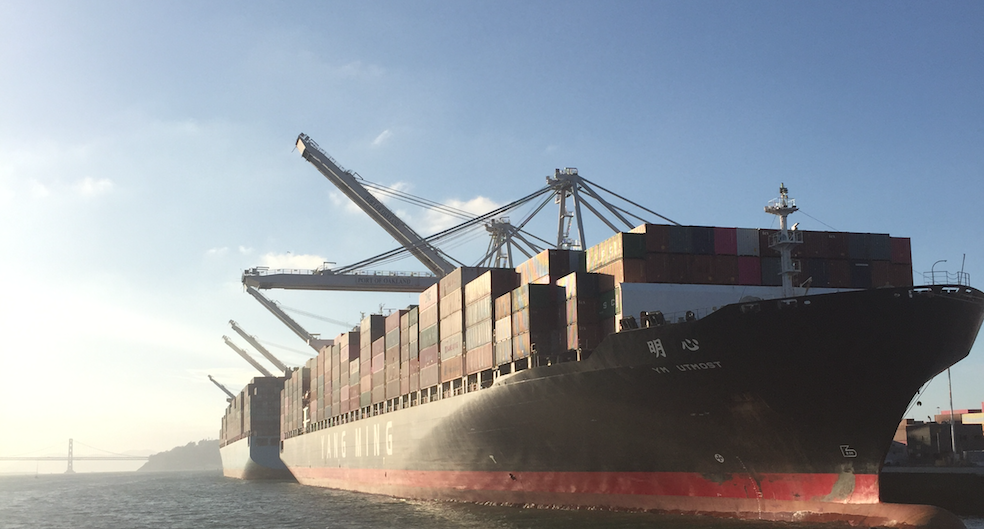
And then there are those that reached us due to hitchhiking. We load cargo on ships, trucks, and planes from all over the world and deliver them to new destinations like Florida. As a matter of fact, Florida and Hawaii are two states with large invasive problems because of the amount of international traffic (planes and ships) and a subtropical climate that is suitable to many of them.

Nonnative species can be transported on ships and in their ballast.
Most of the Polynesian islands are very isolated and difficult for species to reach. During World War II the brown tree snake was accidentally dispersed by the U.S. Navy as they battled their way across the islands trying to reach Japan. On the island of Guam there are reported 20,000 snakes for each human on the island and no predators to control them. Hawaii is so concerned about this issue that all aircraft coming from that part of the world are isolated on a runway at the airport until a thorough check can be conducted, often using dogs. When I traveled there years ago, we had to complete a form asking if we were bringing any plants? Was their soil with the plants? If you had dogs, they had to be quarantined because there were no ticks on the island. And, like Guam, there are no native snakes on the island as well. I heard one story where a local on the Oahu decided to raise piranha, I suppose as a deterrent. The fish were confiscated, and the project destroyed.
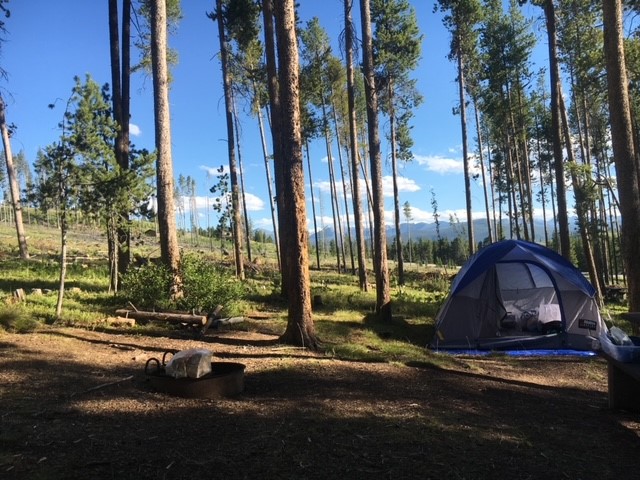
Firewood is now something biologist are concerned about. There has been an issue in many forest with insects that either eat the trees directly or make them weak and susceptible to diseases. Many campers like to gather firewood for camp and will take logs with them to their next camp in the next state, not knowing they are spreading the problem.

Campers can move species by carrying firewood with them to each new site.
Boating has been known to spread invasive plants. Launching and recovering your boat, the trailer may grab some plant, you move to the next lake an – wah-lah. This has become such a big issue out west that many lakes have check in stations where officers check your boat and trailer as you arrive AND when you leave – a point made in the last article, we are spending a lot of money on battling invasive species.
The Great Lakes area has a large problem with invasive species that are transported more by shipping. There are several major ports in this region. Ships carrying cargo have weight to make them stable when in rough seas. However, when they empty that cargo at port, they become light and the trip back could be a bit precarious. To offset the weight loss, they will add ballast. In the colonial period, this would have been stones from the surrounding area. The ships would unload the cargo, load the ballast, sail to their next destination, unload the blast (you have now moved this and whatever it was carrying), and get a new load of cargo – and so, it goes. Today ships use water as ballast. As a ship enters a port in the Great Lakes, they may discharge their ballast tanks of water they took on in another part of the world. Sometimes releasing things like zebra mussels.
Florida of course is no different than any of these other stories. International travel lands at our airports and cruise ship ports everyday bringing who knows what. Campers come from around the country harboring a variety of unknown hitchhikers. And then there are the intentional exotic plants and animals shipped in for the pet and landscaping industries.
Keep in mind that not all nonnative species are invasive. To labeled them so they would need to be causing a problem. Red fire ants entered the U.S. accidentally through the port of Mobile, Alabama. They have been a real problem wherever they have been found, they have been labeled invasive. But there are plenty of nonnative plants and animals that have not been problematic. Banyan trees may not be causing any real problem and thus would not be labeled invasive. You can say the same for many other nonnative plants.
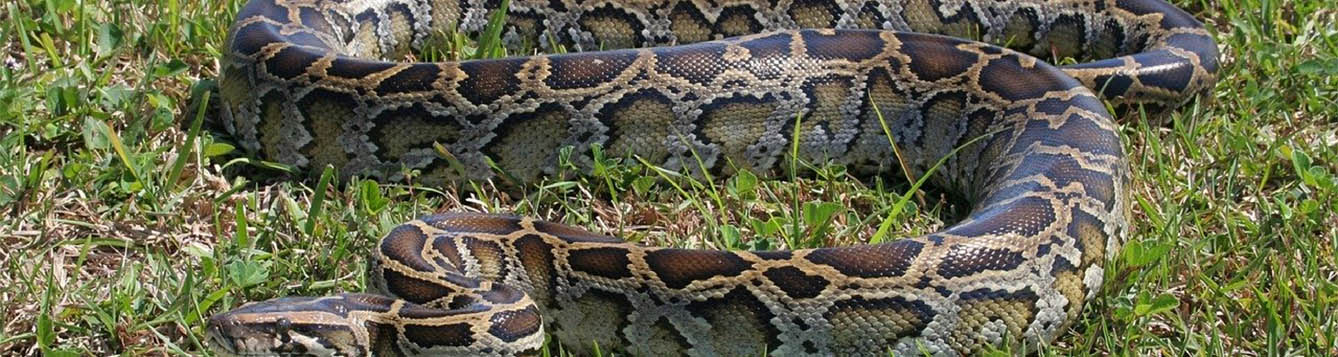
The problem we have is that some have “escaped” – coral ardisia, Brazilian pepper, Burmese pythons, have been found to be a problem and knowing which will be problems and which will not is tough. You really won’t know until they have spread, and the issue arises.
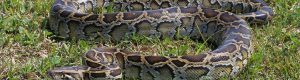
The Burmese python.
Photo: University of Florida
For us Miami is “ground zero” for such problems. It is a tropical international hub. There are numerous invasive species that entered our state here and have spread across central and south Florida. North Florida has fewer due to our climate, but we are finding (a) many species can tolerate our climate and are doing well – cogongrass, Chinese tallow, Chinese privet – and (b) our climate is warming allowing species that were once not a threat, to become one.
I’ll finish on a story from college. I was attending the University of Southern Mississippi. My roommate was from Afton, Wyoming. Unknown to him, he carried cockroaches’ home in his luggage one semester. This is an animal not found in the Rockies, it now lived in his house. It is very easy for us to carry hitchhikers across wildlife barriers. We will discuss how to prevent this in a later article, but up next will be an article discussing some of the new species that may threaten the Florida panhandle.
by Rick O'Connor | Feb 28, 2022
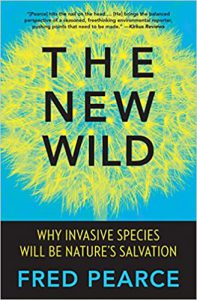
In recent years this question has come up more often. With the thousands of different invasive species taking over the landscape and waterways why are we spending so much time, money, and resources battling them when you are not going to win? It’s a fair question honestly and one that is the theme of the 2016 book The New Wild by science writer Fred Pearce.
The argument that Pearce makes is that life on our planet has worked under the premise that the stronger survive and pass on their genes to the next generation since the beginning of time. They compete with other species for space and resources and those best adapted will win out. If these invasive species are winning out, that is how nature intended it to be and that we should get use to the “new wild”.
Under this thought the forest of the southeastern United States would hold more Chinese tallow and cogongrass than it once did, and the reefs of the Gulf of Mexico would be home to a new species called the lionfish. Again, the thought makes sense and indirectly may be growing.
I say that because there are many who cannot euthanize an animal, no matter who it is or where it came from. There is a growing call to not euthanize them because it is wrong, and even some cases with green iguanas where rescues, and releases, from the cold are now occurring. There are some who found economic ways to benefit from some invasive species, lionfish dinners and Chinese tallow honey, and do not necessarily want to remove them. So, maybe these nonnative species are not all that bad.
So, why should we be concerned about them?
Why should spend the time, money, and effort to manage them (euthanizing when needed)?
Well, by using the definition accepted by the University of Florida IFAS Extension, they are bad. This definition states (1) invasive species are non-native to the area, (2) they arrived via humans (whether intentional or accidental), and (3) they are causing an economic and/or environmental problem. Lowering your quality of life has also been connected to a “problem”. And if it is truly a problem, and it should be to have the name invasive attached, then it needs to be managed. If they are not really causing a problem, then maybe they are not really invasive.
With invasive species we typically see a nonnative who moves into a disturbed part of the environment. Being nonnative, they have few natural predators, and their reproductive dispersal of the landscape is quick and effective. They have mentioned that the dispersal rate of the lionfish was one of the greatest “invasions” ever seen. This increase in their population decreases the populations of native species and, in many cases, the overall biodiversity of the system. Biologists and naturalists understand the importance of biodiversity in maintaining a healthy ecosystem. Monocultures of any species, even in agriculture, and be dangerous when a pathogen comes along. This pathogen could wipe out the entire ecosystem. I have heard this argument before. Most of the Everglades is sawgrass, sawgrass is grass, which provides food and oxygen for the rest of the system. If herbivores only need plants to survive, and they provide food for the carnivores, does it really matter which grass it is? Grass is grass.
However, if this grass species does become threatened by a pathogen, or the herbivores do not eat such grass, then we DO have a problem. The invasion of cogongrass is a good example of this. With the serrated blades and layers of silica within, few herbivores seek this plant out. If cogongrass is allowed to take over forest and farmland, there is certainly a problem, and this plant would need management.
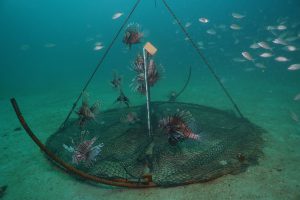
Deep water lionfish traps being tested by the University of Florida offshore Destin, FL. [ALEX FOGG/CONTRIBUTED PHOTO]
Lionfish is no different. There are some reefs in the northern Gulf of Mexico that have had densities of 200 lionfish/hectare or more. Some photos show only lionfish. Studies show they are like bullfrogs, consuming anything they can get into their mouths. There are at least 70 different species of small reef fishes that have been found in the stomachs of lionfish. The decrease of these small fish can impact the presence of larger, commercially sought-after species. They have also found that many of these small reef fish control algae growth on coral reefs and their decline can increase algae populations and the smothering of the coral themselves. They are indeed a problem.
We could go on and on with examples of how these species are problematic. Pythons, tegus, and Old-World Climbing Fern. There are those who cause problems in small quite ways such as the crazy ants, Cuban treefrogs, and the red fire ant.
And then there is the argument that WE, not nature, introduced this species. That is #2 of the definition. The argument that if nature introduced the species, then yes – we could except their presence as more natural and the process more natural. But nature did not introduce them – we did. This brings up the argument that the situation is more unnatural and since we “did it” we should “fix it”.
Even Pearce mentions in his book that some species need management. The argument that you are not going to win is true for some species. We are not going to eradicate Chinese tallow, cogongrass, and lionfish from Florida. However, we should be concerned about them. We should manage the locations where they currently exist and prevent the spread to new locations. In our next edition, we will discuss “how they get here” to help reduce the spread of current invasive species, and the introduction of new ones, from happening.
by Rick O'Connor | Feb 24, 2022
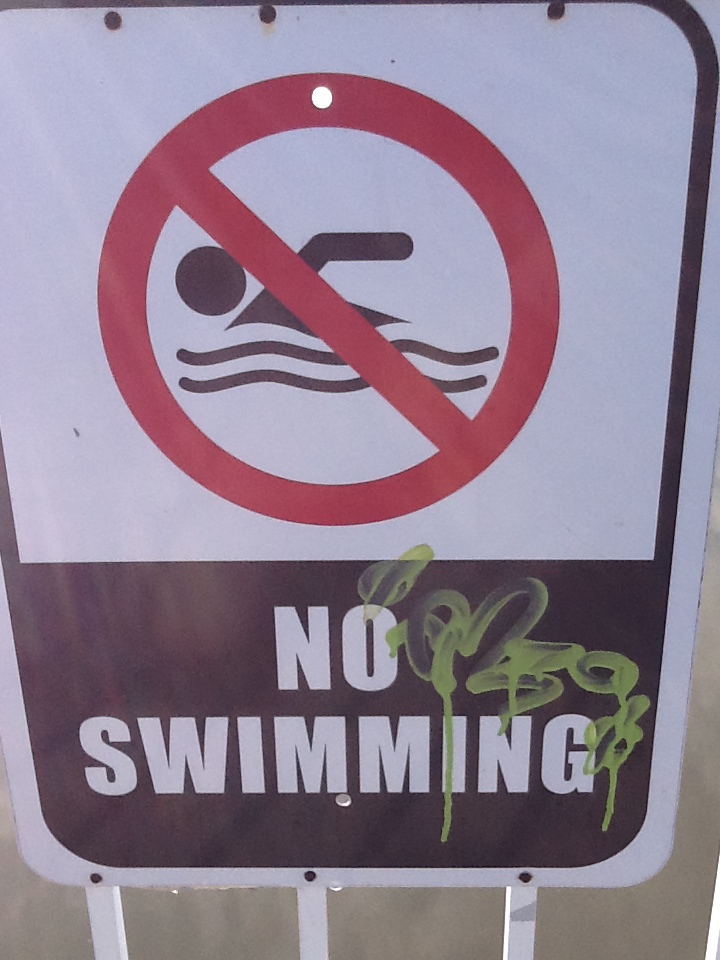
For many in the Pensacola Bay area, water quality is a top concern. Excessive nutrients, heavy metals, and fecal bacteria from run-off have all been problems. In recent years fecal bacteria has become a major concern, forcing both health advisories at public swimming areas, and shellfish harvesting closures. In a report from the Florida Department of Environmental Protection last modified in 2021, 43 sites in the Pensacola Bay area were verified as impaired and 11 of those (22%) were due to high levels of fecal bacteria1.
Closed due to bacteria.
Photo: Rick O’Connor
As the name implies, these are bacteria associated with the digestive tract and find their way into waterbodies via animal waste. Animal waste can harbor pathogenic organisms and contribute to algal blooms which leads to hypoxia (low dissolved oxygen in the water), and potential fish kills. As bad as hypoxia and fish kills can be, it is the health issue from the pathogens that are often the larger concern.
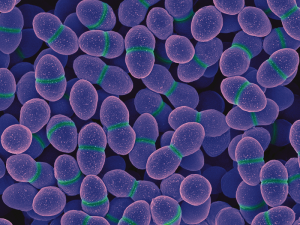
The spherical cells of the “coccus” bacteria Enterococcus.
Photo: National Institute of Health
In saline waters, the fecal bacterium Enterococcus is the species used for indication of animal waste. This bacterium is more tolerant of salt water than E. coli, or other fecal bacteria, and a better choice as an indicator for this reason. Enterococcus is found in the intestines for birds and mammals and enters waterways through their feces. Waterfowl, pets, and livestock can all be sources, but it is human waste that many point to when the bacteria counts are over the environmental thresholds set. Human waste enters the waterways either by septic or sewer overflows. It is the septic systems we will look at in this article.
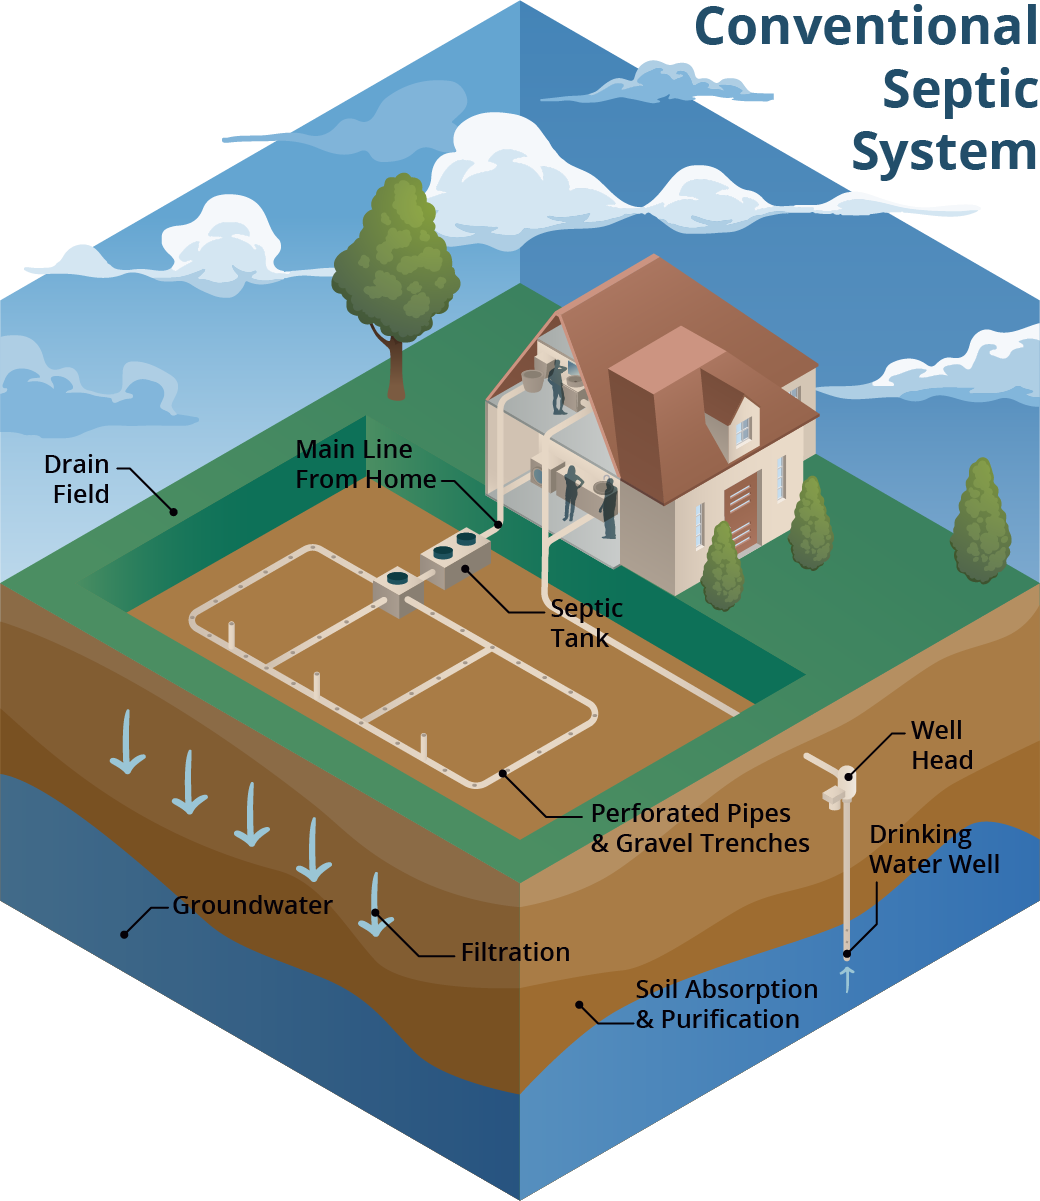
A conventional septic system is made up of a septic tank (a watertight container buried in the ground) and a drain field. Image: Soil and Water Science Lab UF/IFAS GREC.
How the septic system works…
The process of course begins when you flush. The wastewater leaves the commode and enters a pipe which leads to the septic tank outside. Here the wastewater separates. The solid waste will settle to the bottom forming a layer called sludge. Fats, oils, and grease float on water and form a top layer called scum. The untreated wastewater settles in the middle. This wastewater will drain from the septic tank into a series of smaller pipes and leach into a drain field. The drain field should be made of large grain material, like sand or gravel, that allows the filtration of the water as it dissipates into the environment. On paper this system should work well, and often does, but you can see where problems can occur.
- Was the septic system placed in the correct area? Often as a homeowner you have no control over where the tank is placed but there are regulations on this, and they should have been followed.
- Is there sufficient drain material for the effluent to effectively drain and filter (plenty of sand/gravel)?
- Is the site too close to the water table? Saturated ground will not allow for proper filtration and can create layers of untreated water to settle near the surface creating foul odors and leach into local waterways. Over the last decade the Pensacola area has seen an increase in the annual amount of rain. This increase can turn what was a suitable location into one that is no longer.
Again, many homeowners have no control over the placement of the septic but doing your due diligence when purchasing a home, you can do. Checking the situation of the septic can save you a lot of problems down the road.

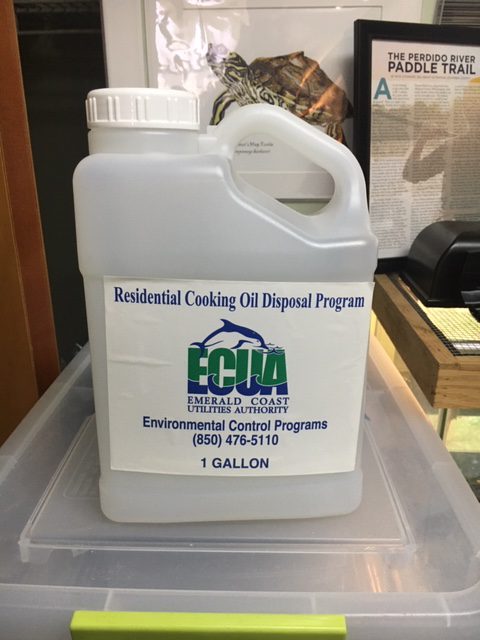
1-gallon container provided free to dispose of your oil and grease.
Photo: Rick O’Connor
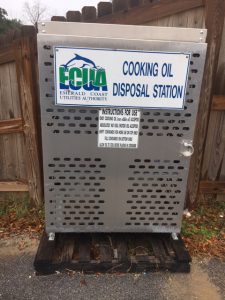
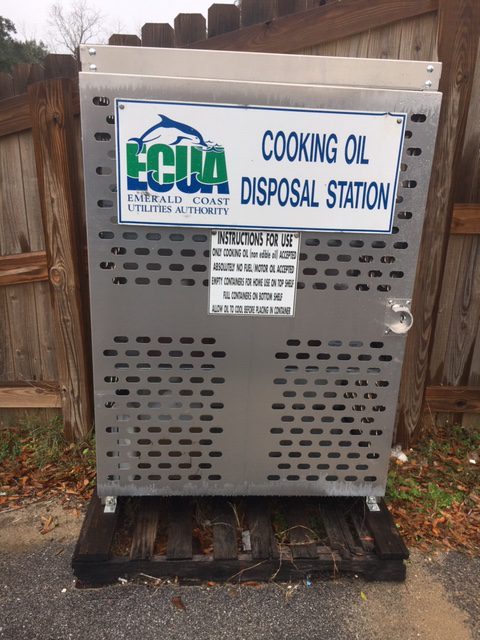
The FOG gallon containers are found in these metal cabinets placed around the county.
Photo: Rick O’Connor
- What are you flushing down the commode? Here you DO have control.
- Excessive amounts of fats, oils, and grease will increase the scum layer, and this can enter the pipes leading to the drain field causing clogging of those. Clogs can cause backups into the tank and leaks near the top as well as backups into your home. Not only can these overflows create problems in the home, but they can also end in our waterways creating water quality problems. So, what do you do with the oil and grease left over from cooking? In Escambia County, the Emerald Coast Utility authority provides what they call the FOG program2. This program provides free 1-gallon plastic jugs to place your oil and grease in. You can find these in metal cages at locations around the county, there is one at the extension office. You take it home, fill it up, and return it for a new one.
- Disposable wipes can be flushed, but they do not degrade. Excessive amounts of disposal products flushed into your septic system will certainly create clogs in the drainpipes and backups into the lawn, waterways, and your home. Do not flush these! Toss them into the trash can.
- Interestingly we are learning that milk will solidify after pouring down the drain. It forms solid chunks resembling concrete and can also create backups and overflows. This is relatively newly discovered problem. One suggestion is to pour unwanted milk on your garden, but you do not want to flush it down the drain to your septic tank.
- There has been discussion on chemical products marketed to clean your septic. Many of our experts believe that these can alter the good microbes within the tank that breakdown the solid waste layer, the sludge. This is not something you want.
- The last one is water itself. Not that you cannot flush water down the drain, but excessive amounts can create situations where either the scum or the sludge layers reach the drainpipes and form clogs. Do not use excessive amounts of water from different sources in your home at the same time. Do not overload the system.
- Driving over the septic tank or drain field.
Most understand that this can cause problems. It can compact the soil being used for the drain field, thus making it less effective at draining and filtering. It can also cause cracks in both the tank and the drainpipes, which can create leaks that allow untreated wastewater to travel away from the drain field. Be careful where you use heavy vehicle traffic on your lawn.
- Pumping out your septic system.
This is something few people do. The untreated wastewater should flow into the drain field and percolate through the sand/gravel bed. However, the scum and sludge do not drain and need to be pumped periodically. The recommended cycle for pump outs is once every 3-5 years. Again, this is something most homeowners do not do until backup problems occur. We do recommend having your system pumped on that cycle.
- Convert to a sewer system.
This is not an option for everyone, and we know for some in which it is, they are not eager to do so. But converting to a sewer takes the maintenance issue off the homeowner and onto the local utility. The conversion can be expensive but, in some communities, there are cost share programs to help with this. Check with your local utility for more information.
If placed, used, and maintained properly septic systems can last 25-30 years and not be a major problem for local waterways. Converting to a sewer system can help, but there are also problems here. We will address those in our next post.
Reference
1 Florida Department of Environmental Protection. 2021. Verified Lists for Group 4 Basins Cycle 2 – Pensacola Bay.
https://floridadep.gov/dear/watershed-assessment-section/documents/verified-lists-group-4-basins-cycle-2-pensacola-bay.
2 Fats, Oils, and Grease (FOG). Emerald Coast Utility Authority (ECUA).
https://ecua.fl.gov/live-green/fats-oils-grease.