by Daniel J. Leonard | Dec 20, 2024
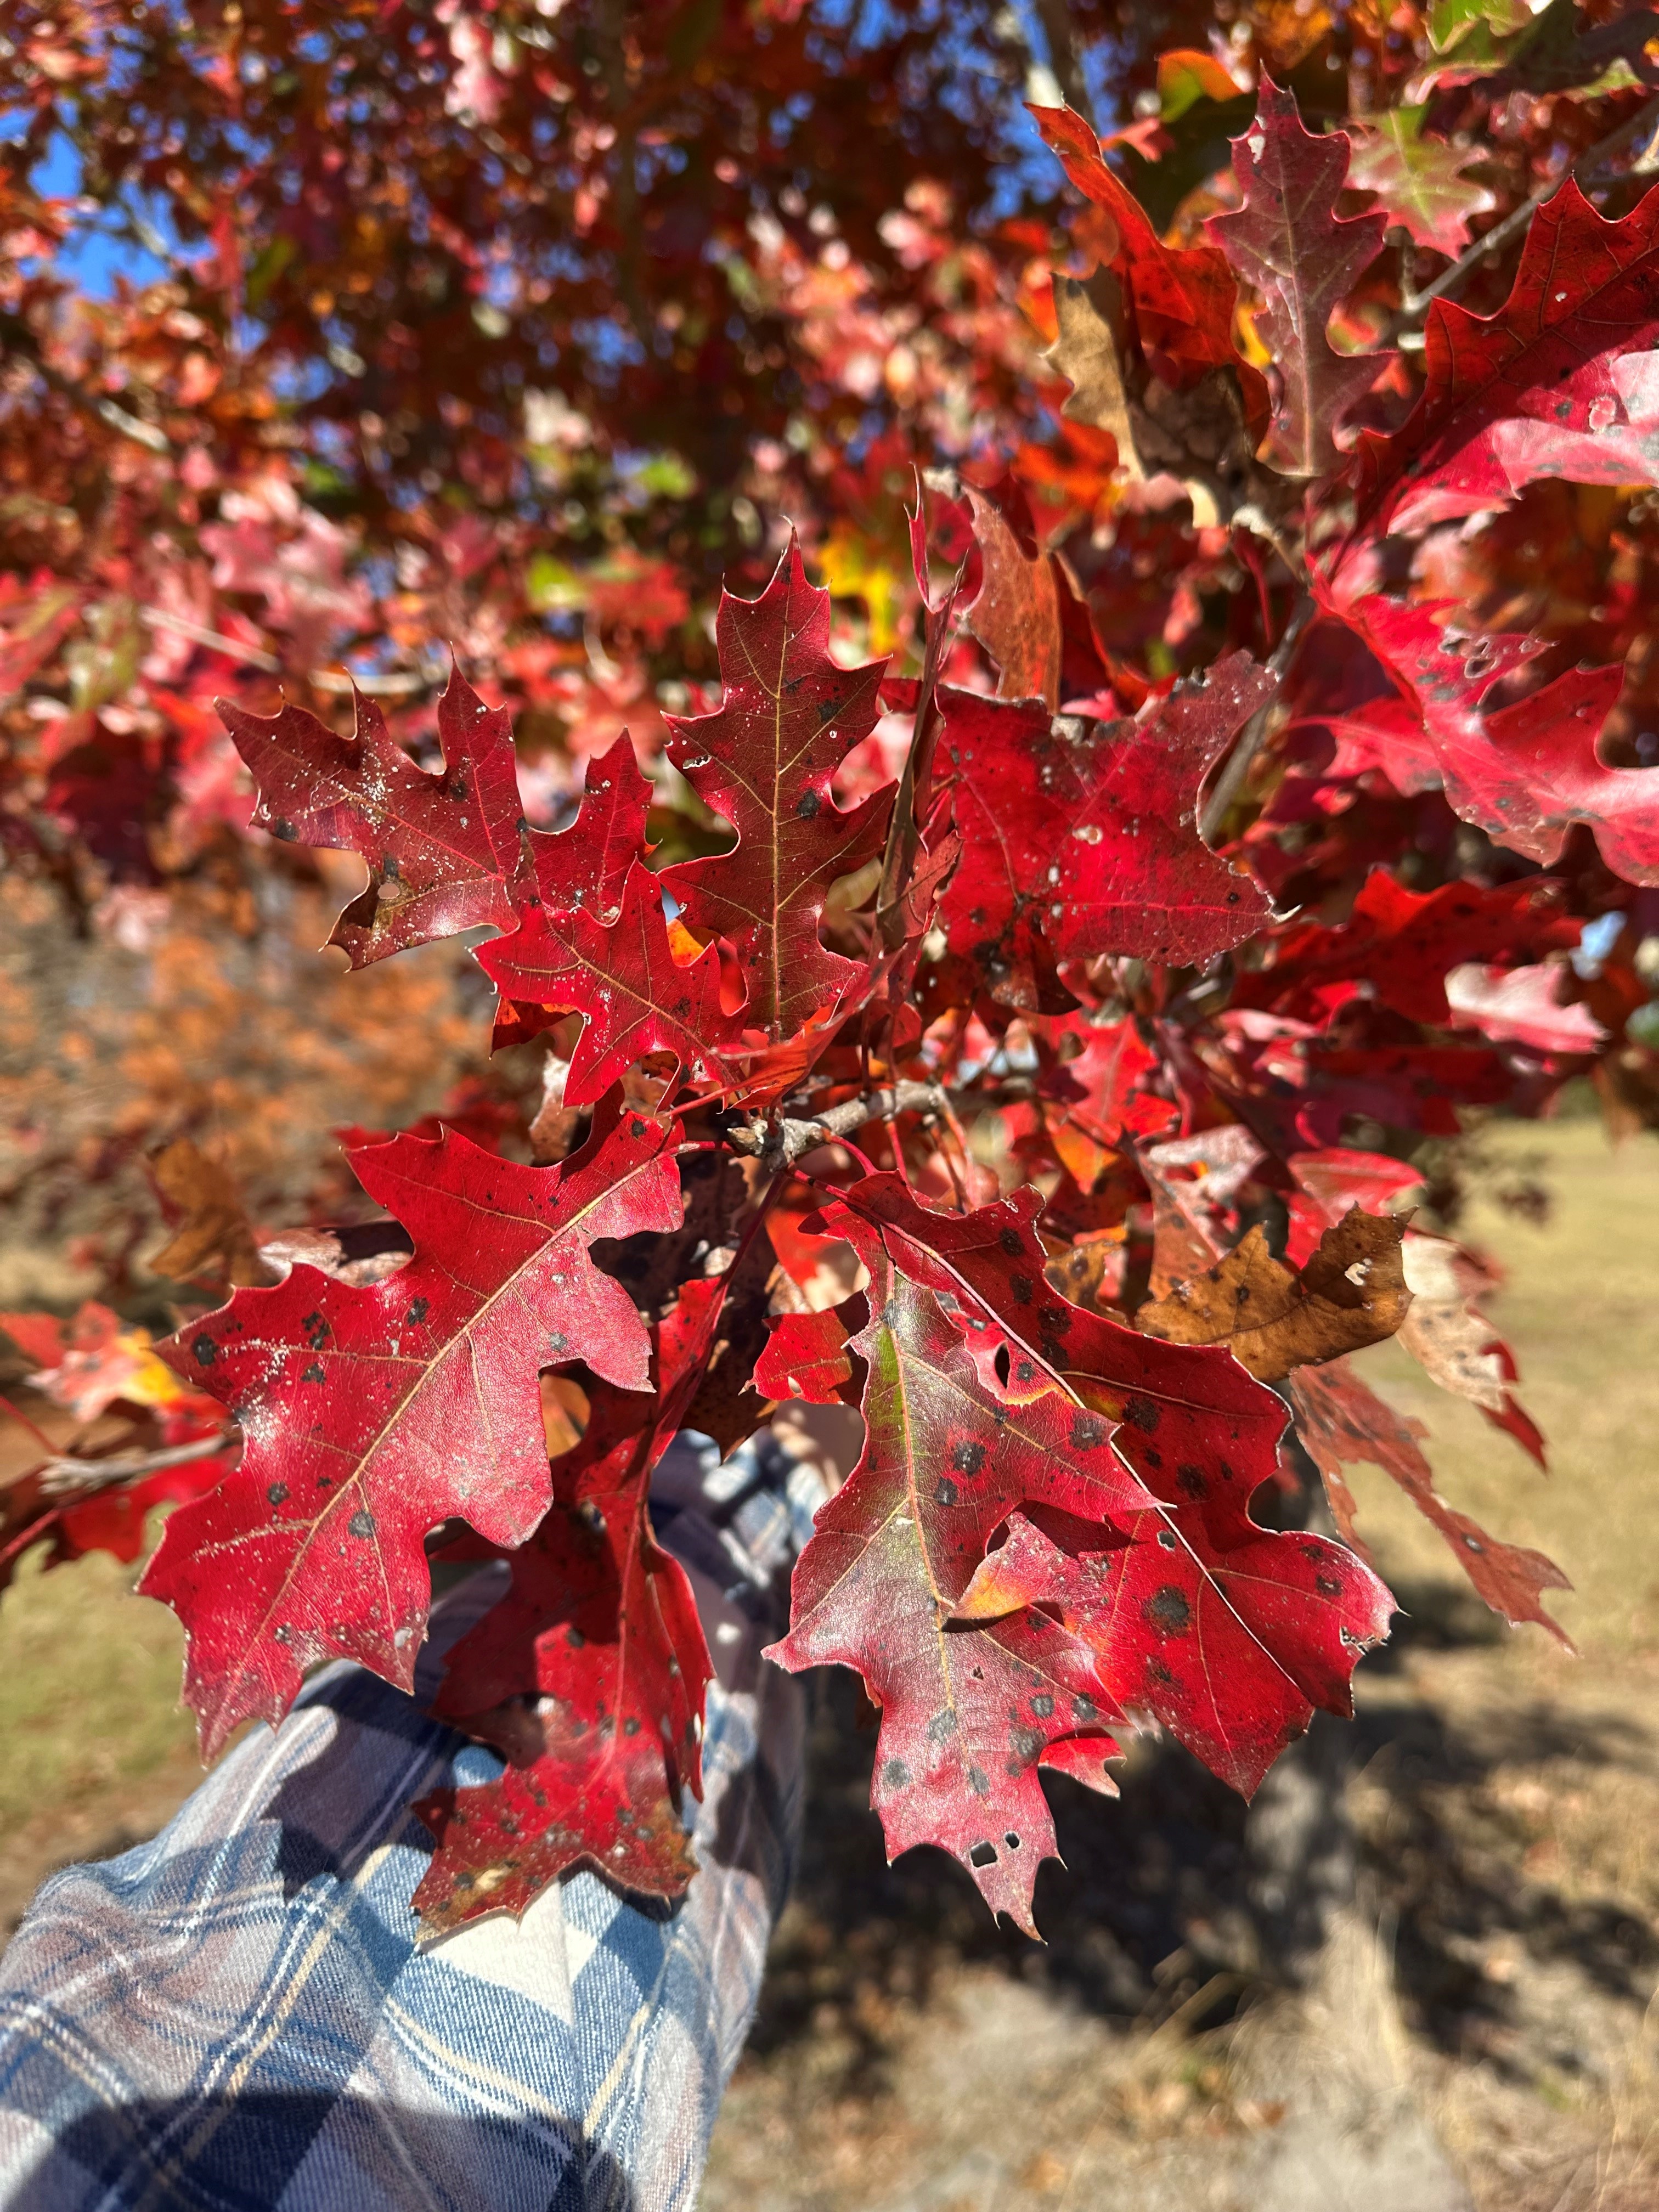
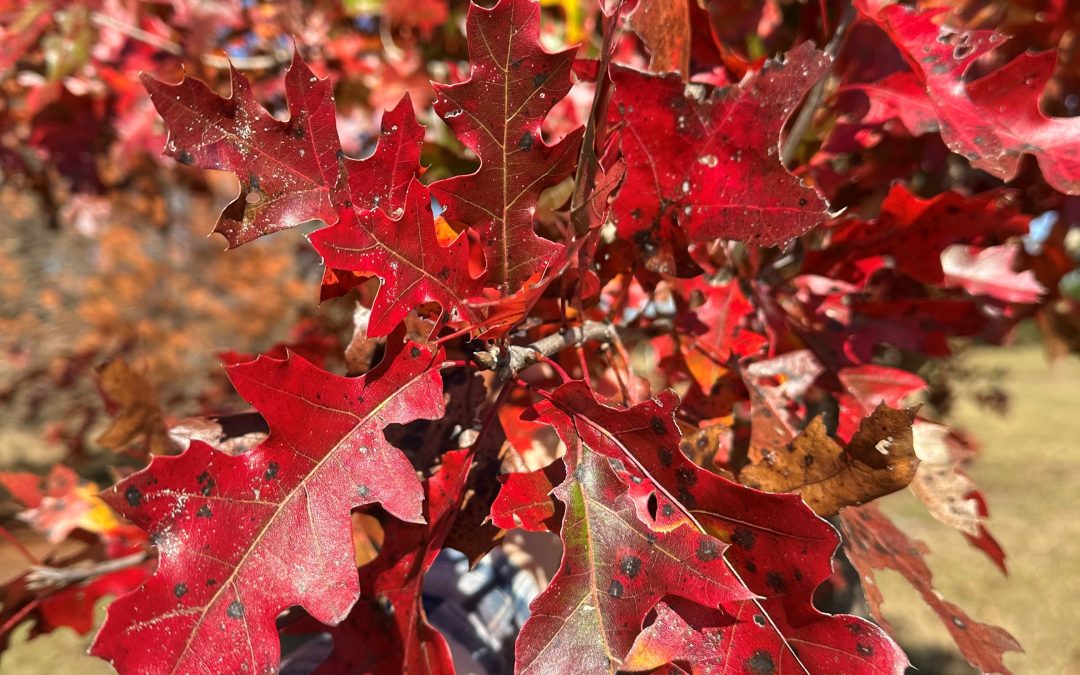
The Panhandle isn’t known for its fall foliage. The best we can normally hope for are splashes of pale yellow amidst a sea of green pine needles, drab brown leaves killed by the first frost, and invasive Chinese Tallow trees taunting us with vibrant colors we know we shouldn’t have. However, in 2024, you’d be forgiven if you forgot you were in Florida and had instead been transported to a more northern clime where leaves everywhere turned brilliant shades of yellow, orange, purple, and red. I’ve heard comments from many folks, and I agree, that this is the best fall color we’ve seen here in a long time – maybe ever. So, why were the leaves so pretty this year? Let’s dive in.
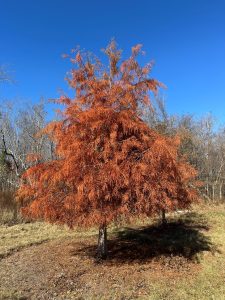
Bald Cypress displaying brilliant burnt orange foliage. Photo courtesy of Daniel Leonard.
What causes leaves to change colors in the fall?
First, what makes leaves of deciduous trees/shrubs (plants that shed their leaves in the winter) change color in the first place? The primary driver of leaf color change is daylength. During the summer, leaves appear green due to the presence of chlorophyll, which reflects green light, absorbs red and blue light, and is responsible for photosynthesis. When days shorten in the fall, plants sense that winter is coming and produce hormones that signal leaves to shut down chlorophyll production. They then initiate construction of a “wall” of cells that seals leaves off from the rest of the plant. When this happens, existing chlorophyll is “used up”, sugars build up in the now sealed off leaves, and other compounds that give leaves color, anthocyanins and carotenoids, take center stage. These compounds allow leaves to exhibit the familiar autumnal hues of yellow, red, orange, purple, and brown. However, plants go through this physiological process of shutting down growth and shedding leaves every year and excellent fall color, like what we experienced this year, doesn’t always result. There has to be more to the fall 2024 story.
Why were leaves so pretty this year?

Shumard Oak exhibiting outstanding red fall foliage. Photo courtesy of Daniel Leonard.
A second factor is required for a great fall foliage show – weather. According to the U.S. Forest Service, ideal temperature and moisture conditions must be met for leaf color to be its most intense. Ideal autumn conditions include warm (but not hot) sunny days with cool (but not freezing) nights and adequate (but not excessive) moisture. Too hot and plants become stressed, lessening fall color potential. Too cold, and frost can kill foliage – turning it immediately brown and preventing color development. Too rainy or windy, and leaves can be blown off prematurely. 2024 brought neither extremely hot, extremely cold, or extremely wet conditions, and we were blessed to experience a Goldilocks fall color season.
Did Some Trees Have Better Color than Others?
While pretty much all deciduous trees exhibited their peak color potential this year, there were definitely standouts! Fortunately, many of the prettiest trees this fall also make outstanding landscape trees. Be on the lookout for the following trees in nurseries this winter and consider adding a few to your yard to take advantage of the next Goldilocks fall color year:
- Red Maple (Acer rubrum) – brilliant red fall leaves.
- Florida Maple (Acer floridanum) – yellow/orange.
- Deciduous Oaks (Quercus spp) – generally red to purple. Some species like Sawtooth Oak ( acutissima) are yellow.
- Green Ash (Fraxinus pennsylvanica) – yellow.
- Swamp Tupelo (Nyssa sylvatica) – crimson to purple.
- Sweetgum (Liquidambar styraciflua) – highly variable but generally reds, oranges, and purples.
- Bald Cypress (Taxodium distichum) – burnt orange.
For more information about fall color, which trees and shrubs produce great fall color and perform well in landscapes, or any other horticultural topic, contact your local UF/IFAS County Extension office. Happy Gardening!
by Sheila Dunning | Oct 4, 2024
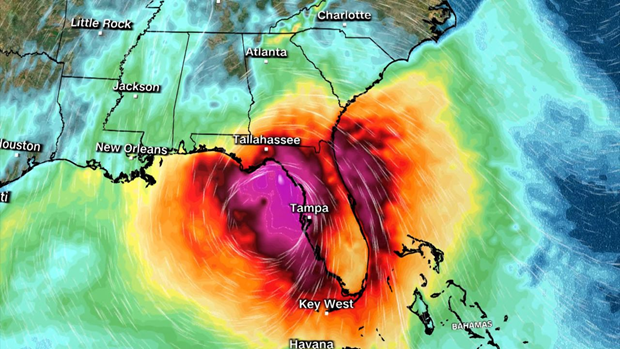
Coastal wetlands are some of the most ecologically productive environments on Earth. They support diverse plant and animal species, provide essential ecosystem services such as stormwater filtration, and act as buffers against storms. As Helene showed the Big Bend area, storm surge is devastating to these delicate ecosystems.
Hurricane Track on Wednesday evening.
As the force of rushing water erodes soil, uproots vegetation, and reshapes the landscape, critical habitats for wildlife, in and out of the water, is lost, sometimes, forever. Saltwater is forced into the freshwater wetlands. Many plants and aquatic animal species are not adapted to high salinity, and will die off. The ecosystem’s species composition can completely change in just a few short hours.
Prolonged storm surge can overwhelm even the very salt tolerant species. While wetlands are naturally adept at absorbing excess water, the salinity concentration change can lead to complete changes in soil chemistry, sediment build-up, and water oxygen levels. The biodiversity of plant and animal species will change in favor of marine species, versus freshwater species.
Coastal communities impacted by a hurricane change the view of the landscape for months, or even, years. Construction can replace many of the structures lost. Rebuilding wetlands can take hundreds of years. In the meantime, these developments remain even more vulnerable to the effects of the next storm. Apalachicola and Cedar Key are examples of the impacts of storm surge on coastal wetlands. Helene will do even more damage.
Many of the coastal cities in the Big Bend have been implementing mitigation strategies to reduce the damage. Extension agents throughout the area have utilized integrated approaches that combine natural and engineered solutions. Green Stormwater Infrastructure techniques and Living Shorelines are just two approaches being taken.
So, as we all wish them a speedy recovery, take some time to educate yourself on what could be done in all of our Panhandle coastal communities to protect our fragile wetland ecosystems. For more information go to:
https://ffl.ifas.ufl.edu/media/fflifasufledu/docs/gsi-documents/GSI-Maintenance-Manual.pdf
https://blogs.ifas.ufl.edu/news/2023/11/29/cedar-key-living-shorelines/

by Rick O'Connor | Jul 19, 2024
In this series we have found that in the 1970s and 1980s climate scientists developed models that could predict the effects of a warming planet on society.
We saw that society, at that time, had little faith in the accuracy of those model predictions.
We also saw that natural occurring events, like tropical storms and the eruption of Mt. Pinatubo, gave climate scientists an opportunity to test their models – and their models past with flying colors.
We have seen the development of international councils and panels to address climate change, enhance the models, and provide advice on how to turn the potential negative effects of a warming planet around.
We have also seen that many of the predictions from those early models are occurring, some have occurred faster than the models indicated they would.
So…
Is there anything we can do about it?
The answer is pretty simple really. Just like those trying to lose weight – you need to either reduce the calories you take in and/or burn those calories off. With climate you need to reduce the amount of carbon you put into the atmosphere and/or remove the excess carbon.
In 2006 NASA climate scientists stated that we had about a decade to make some serious policy changes to avoid irreversible climate change that could cause economic and ecological havoc. They mentioned we needed to cut CO2 emissions between 50-85% by 2050. Their suggestions could be found on both sides of the solution model.
| Reducing Greenhouse Emissions |
Removing Greenhouse Gases |
| Cut fossil fuel use (especially coal) |
Add technologies to both smokestacks and combustible engines to remove CO2 in their emissions |
| Shift from coal to natural gas |
Sequester CO2 by planting trees |
| Improve energy efficiency |
Sequester CO2 underground |
| Use more renewable energy and make these technologies available in developing countries |
Use better land management practices in agricultural |
| Reduce deforestation |
Sequester CO2 in the deep ocean |
| Use more sustainable agriculture and forestry methods |
|
Other methods that could help reduce CO2 emission…
- Increase the fuel efficiency of our cars. One target had vehicles getting 60 mpg by 2057.
- Reduce the distance we drive each year. One target had no more than 5000 miles/year.
- Cut electricity use in homes and offices by 25%.
- Increase solar power use.
- Increase wind power use.
- Increase the use of biofuels.
- Stop deforestation.
- Better methods in agriculture.
- Install scrubbers in fossil fuel burning engines to clean emissions.
So… How are we doing with these?
Cars are more fuel efficient than they were decades ago. Many have turned to electric cars, or hybrids.
It seems that we are driving MORE miles each year – not less. Our society is designed around the need for an automobile – we cannot function without one. And our city planning seems to have us living farther and farther from our work. When I was younger there was much talk about mass transit to reduce traffic and emissions. In large cities where this was already ongoing it continues. But in the other parts of the county this has not really caught on. We are still driving too much.
There are methods of making homes more efficient. My wife and I adopted some of these as we rebuilt our house after a fire. Compared to neighbors and friends, our power bills are much lower. Many of these methods and technologies are being used in new home developments and are encouraging.
Solar farms are increasing – even along I-10 in the Florida panhandle. There is some concern that these solar farms are replacing food farms, but there is an attempt to do this. Out west we see the same.
The same can be said for wind farms – at least out west.
According to the U.S. Energy Information Administration, biofuel production has increased each year since 1980.
Deforestation has not slowed. As a matter of fact, many developments in the Florida panhandle begin by removing ALL trees. In some cases, they replace lost trees with saplings in the new neighborhoods. But a major source of carbon removal has been removed from the system. There is much more that needs to be done with this issue.
Speaking for the farmers in the Florida panhandle – yes… many have turned to better land management practices to protect their land and reduce, or sequester, carbon.
“Scrubber” in internal combustion engines is required by law in the U.S.
Despite some of these positive changes, carbon in our atmosphere continues to increase – not decrease. Part of this is because this is a global issue and that all of human society must work together to reduce greenhouse emissions. Some countries are doing better than others. There are international summits every few years to discuss what the world should do to tur the tide on climate. But all countries need to attend, particularly those producing the largest amount of greenhouse gases.
Here at home, there is resistance to reducing the use of fossil fuels, so many programs have not moved as far forward as they need to move. It is also important to understand that even with the behavior changes we seek, it will take time to undo the damage already done. We will not see improvement right away. Enacting new programs and technologies now could take over 100 years to see the impacts. It is important to understand that the longer we put changes off, the longer it will be before we see any positive benefits from those actions.
There is the concern that the political and public will is still not there to make these changes happen. But they will need to if we are to see things begin to improve.
Until then – you can do your part. Use fossil fuels as little and efficient has you can. Plant trees to help remove carbon dioxide and shade your house so you need less air conditioning. There are many other things you can do to help turn the tide on climate. Check with your local extension office for more ideas.
by Rick O'Connor | Jul 13, 2024
As I mentioned in Part 1, I taught environmental science in the 1990s and the first decade of the 21st century. Reviewing the textbook used for that course I provide information below that was taught at the time. The purpose of this series on Another Look at Climate Change is to see whether the predictions made at that time are occurring now. Part 3 – What Are Some Possible Effects…\
One question expressed in the 1990s, as it is today, is why we should be concerned about a few degrees change in temperature. Many at the time, and today, did not see the change of a few degrees any different than the change that occurred between the months of May and July. What’s the big deal? The response is that scientists were not looking at temperature changes over a short period of time, but over longer periods – and how rapidly they were changing. In the ancient past, the warming of the planet was over thousands to hundreds of thousands of years. It was now occurring over decades.
The greenhouse effect.
Image: NOAA
Climate models at the time were providing information on where food could be grown, how much could be grown, where droughts and flooding were going to increase, and where wildlife and people might have to live. And, due to the rapid change in temperatures, that we were going to have to deal with it during the next century.
In 2003 a U.S. National Academy of Sciences report provided a “worst-case scenario” of climate and ecological changes that may occur. It mentioned that we might reach an irreversible tipping-point and afterwards would not be able to reverse the effects for thousands of years. It described ecosystems collapsing, low-lying cities would flood, vast wildfires in the forests, grasslands drying out from prolonged droughts. As mountain glaciers melt, rivers that bring needed drinking water to many would dry up. There would be pre-mature extinction of up to half of the planet’s species, prolonged heat waves, increased flooding, more destructive storms, and the spread of tropical diseases beyond their current range.
NOTE: Many of these predictions continue to be discussed today – some are occurring.
The following lists were some of the predictions provided at the time. Do you see any that have occurred?
Effects if CO2 levels reach 450 ppm – NOTE: It was stated at that time that this was unavoidable.
- Forest fires will worsen.
- Prolonged droughts will intensify.
- Deserts will spread.
- Major heat waves become more common.
- Conflicts over water supplies increase.
- Modest increases in crop production in temperate regions.
- Crop yields fall by 5-10% in tropical Africa.
- Coral reefs affected by bleaching.
- Many glaciers melt faster and threaten water supplies for millions of people.
- Sea levels rise enough to flood lo-lying coastal areas – such as Bangladesh.
- More people exposed to malaria.
- High risk of extinction for Arctic species – such as the polar bear.
CURRENT UPDATES ON THESE PREDICTIONS…
- In 2024 the Western Fire Chiefs Association reported that though the number of annual wildfires has decreased since the 1990s, the area of land destroyed by wildfires has increased. In the 1990s there was an annual average of 3.3 million acres burned by over 78,000 wildfires in the U.S. Since 2000 a little over 70,000 wildfires have burned over 7 million acres a year. This is due to great fuel load due to drier/drought conditions largely caused by climate change.
- In 2023 two NASA scientists confirmed that droughts are becoming more frequent.
- In 2018 a study reported by the National Science Foundation confirmed that the Sahara Desert has expanded 10% since 1920.
- The U.S. EPA reported in 2023 that heat waves in major cities have increased from 2 a year in the 1960s to 6 a year during the 2010s and 2020s.
- The University of Southern California reported that conflicts between states over water supply from the Colorado River are occurring. Others indicate that, though nonviolent at this point, conflicts across the planet over water have begun.
- Climate change may negatively affect production of corn and wheat by 2030.
- Wheat grows well between 15° – 20°C. However, in sub-Sahara Africa temperatures already exceed this. It is believed that by 2030 wheat production will decrease by 10-20% from 1998-2002 yields.
- NOAA reported in 2024 that the world is currently going through a fourth coral bleaching event. Heat stressed bleaching has been a problem in both the northern and southern hemisphere.
- Recent evidence suggests that ancient glaciers are melting more than a quarter of a mile a day, which is faster than the models predicted.
- The annual frequency of high tide flooding in the U.S. has more than doubled since 2000 – and is predicted to triple by 2050.
- Although the risk of getting malaria in the U.S. is low, cases are increasing. Particularly in Florida and Texas.
- I could not find any reports of Arctic species that have gone extinct, but there are numerous reports of species endangered of it. One report stated that at the current rate of warming, polar bears could be extinct by the end of the century.
OTHER NOTES:
According to a 2005 study, between 1979 and 2002 the area of the earth’s land experiencing severe drought increased from 15% to 30%. The 2007 IPCC report predicted this increase would continue.
The 2021 IPCC report stated the same, the frequency increase will continue.
This “browning” of the earth will enhance other ecological problems such as reduced soil moisture that will impact plant growth rates, impacting their ability to remove CO2, enhancing warming, and causing some bodies of water to dry up and rivers enable to reach the sea.
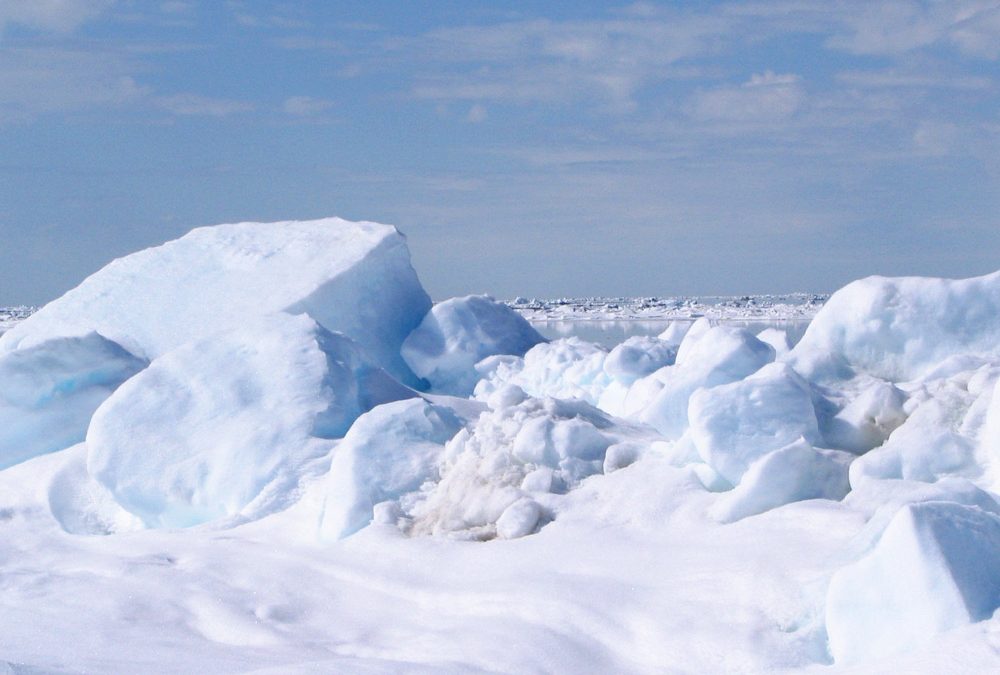
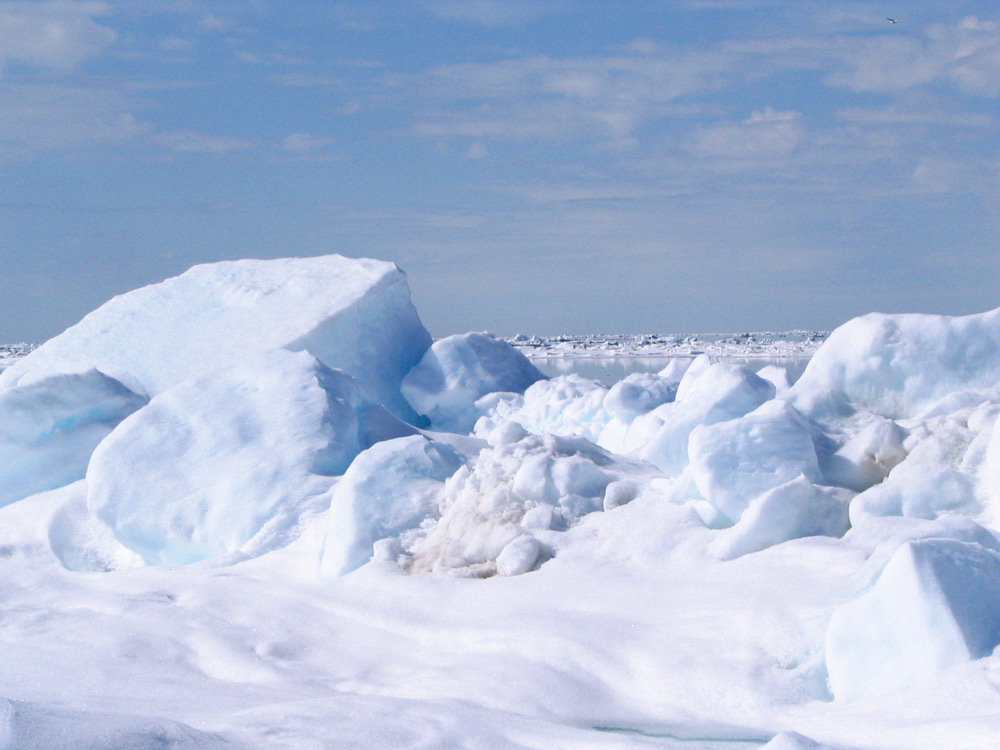
The light color of snow and ice in the polar regions reflects solar radiation helping to cool the planet. The melting of this snow and ice – which is predicted / and is happening – will increase the absorption of solar radiation increasing warming. A 2006 NOAA report predicted arctic summers with no floating ice by 2040. Other studies suggest this will happen as early as 2013.
According to the 2007 IPPC report the average sea level is very likely (90-99% certainty) to rise 0.6-1.9 feet during this century. In 2022, global average sea level set a record high – 4 inches above the 1993 level… and the 2021 IPPC report stated that we have passed the tipping for sea level rise – it will rise no matter what we do. We are at a point that coastal communities need to begin planning for this. Predictions from that time on the affects of sea level rise include:
- Degradation or destruction of at least one third of the world’s coastal estuaries, wetlands, and coral reefs.
- Disruption of many of the world’s coastal fisheries.
- Flooding of low-lying barrier islands and erosion of gently sloping coastlines.
- Flooding of agricultural lowlands and deltas where rice is grown.
- Contamination of coastal freshwater aquifers with salt water – salt intrusion.
- Submergence of low-lying islands in the Pacific, Caribbean, and Indian Oceans.
- Flooding of coastal cities.
It is known that the amount of methane (a major contributor to greenhouse gases) locked in the permafrost is 50-60 times great than the amount released by burning fossil fuels. According to a 2004 study, 10-20% of the Arctic’s permafrost may thaw this century – enhancing warming. A 2024 report stated that 7% of the current permafrost has melted.
Ocean currents move CO2, warm and cold water across the planet regulating the climate. There was concern at the time that the melting of the poles (particularly Greenland) could introduce enough freshwater to alter these currents and impact the climates of northern Europe and northeastern North America. At the time, scientists did not see this as a threat in the near future.
The increase in extreme weather…
Heat waves, droughts, desertification, flash floods from prolonged rain could all happen…
At the time there was disagreement as to whether warming would increase the frequency and intensity of tropical storms and hurricanes. A 2008 study found that since 1950 for every 1°F increase in ocean temperature in the Atlantic, the number of hurricanes and tropical storms would increase by one third. It also showed that the number of hurricanes with wind speeds of 110 mph or greater increased by 45%. NASA stated since 1980 hurricane activity in the North Atlantic has increased but thus far much of this has been from natural climate variation. However, they did point out one study that showed evidence that the rapid intensification of these storms cannot be explained by natural climate variations and could be connected to climate change.
As the planet warmed it was predicted that ecosystems would shift and change. Some tropical species would disperse further north – tropicalization. We have witnessed the expansion of mangroves into the northern Gulf of Mexico. According to the 2007 IPCC report, about 30% of the land-based plants and animals could disappear. A 2019 United Nations article stated that the Intergovernmental Science-Policy Platform on Biodiversity and Ecosystem Services reported that the rate of extinction has accelerated. Warming was also predicted to disrupt biological clocks of migratory species and the Florida Museum of Natural History has already reported this is happening with migrating songbirds. Warming was also predicted to increase the populations of some species of insects and fungi that damage trees.
There were also predictions to the health of humans…
One will be the increased deaths due to heat waves. Others would be increased disease from insects and allergy issues from increased pollen. A 2024 U.S. Environmental Protection Agency report showed that human deaths related to heat waves has increased since 1979.
This snapshot gives us an idea of how well the computer models predicted the impacts of climate change and whether we should pay closer attention to what the current models are saying for the future. The 2021 IPPC report indicated that we have passed the tipping point for sea level rise and are approaching the tipping point for other possible impacts.
There has been talk about climate for a long time. Though many things are beginning to happen there is more our world can do to help reduce the risk of these possible impacts. In Part 4 of this series, we will look at what was suggested a decade ago and how we are doing with those.
References
Miller, G.T., Spoolman, S.E. 2011. Living in the Environment; Concepts, Connections, and Solutions. 16th Edition. Brooks and Cole. Belmont CA. 674 pp.
Are Wildfires Increasing or Decreasing in the U.S.? The Western Fire Chiefs Association. 2024. https://wfca.com/wildfire-articles/are-wildfires-increasing-or-decreasing-in-the-us/#:~:text=The%20amount%20of%20land%20burned,due%20to%20approximately%2078%2C600%20fires.
Cawdrey, K. 2023. Warming Makes Droughts, Extreme Wet Events More Frequent, Intense. NASA Explore. https://www.nasa.gov/centers-and-facilities/goddard/warming-makes-droughts-extreme-wet-events-more-frequent-intense/.
New Study Finds World’s Largest Desert, the Sahara, Has Grown By 10% Since 1920. National Science Foundation News. https://www.nsf.gov/news/news_summ.jsp?cntn_id=244804.
Climate Change Indicators: Heat Waves. 2023. U.S. Environmental Protection Agency. https://www.epa.gov/climate-indicators/climate-change-indicators-heat-waves#:~:text=Heat%20waves%20are%20occurring%20more%20often%20than,the%202010s%20and%202020s%20(see%20Figure%201).
The Water Wars of the Future are Here Today. The University of Southern California Today. https://today.usc.edu/the-water-wars-of-the-future-are-here-today/.
Gray, E. 2021. Global Climate Change Impact on Crops Expected Within 10 Years, NASA Study Finds. NASA Global Climate Change News. https://climate.nasa.gov/news/3124/global-climate-change-impact-on-crops-expected-within-10-years-nasa-study-finds/.
Munang, R., Andrews, J. 2014. Despite Climate Change, Africa can Feed Africa. Africa Renewal. https://www.un.org/africarenewal/magazine/special-edition-agriculture-2014/despite-climate-change-africa-can-feed-africa.
NOAA Confirms Fourth Coral Bleaching Event. 2024. NOAA News and Features. https://www.noaa.gov/news-release/noaa-confirms-4th-global-coral-bleaching-event.
Harvey, C. 2023. Glaciers May Melt Even Faster Than Expected, Study Finds. Scientific American Newsletter. https://www.noaa.gov/news-release/noaa-confirms-4th-global-coral-bleaching-event.
Rising Seas, Flooding Coasts. 2023. Climate Central. https://www.climatecentral.org/climate-matters/rising-seas-flooding-coasts-2023.
Malaria in the U.S. – Is Climate Change Affecting Disease Spread? 2023. Gavi. The Vaccine Alliance. https://www.gavi.org/vaccineswork/malaria-us-climate-change-affecting-disease-spread#:~:text=A%20warmer%20world%20means%20mosquitoes,as%20dengue%20fever%20and%20malaria..
Climate Change 2021: A Summary for All. 2022. Intergovernmental Panel on Climate Change (IPCC). https://www.ipcc.ch/report/ar6/wg1/downloads/outreach/IPCC_AR6_WGI_SummaryForAll.pdf.
A Force of Nature: Hurricanes in a Changing Climate. 2022. NASA Explore. https://science.nasa.gov/earth/climate-change/a-force-of-nature-hurricanes-in-a-changing-climate/.
Van Hoose, N. 2017. Migratory Songbirds Bumped Off Schedule as Climate Change Shifts Spring. Florida Museum of Natural History Research News. https://science.nasa.gov/earth/climate-change/a-force-of-nature-hurricanes-in-a-changing-climate/.
U.S. Environmental Protection Agency. 2024. Climate Change Indicators: Heat-Related Deaths. https://www.epa.gov/climate-indicators/climate-change-indicators-heat-related-deaths.
by Rick O'Connor | Jun 28, 2024
As I mentioned in Part 1, I taught Environmental Science in the 1990s and the first decade of the 21st century. The information provided below was taught at that time. The purpose of this series on Another Look at Climate Change is to see if the predictions made at that time are occurring.
Over the 4.5 billion years of our planet’s existence the climate has been altered by volcanic eruptions, changes in solar input, continental drift, and impacts by large meteors. Over the past 900,000 years our atmosphere has experienced periods of cooling and warming known as glacial and interglacial periods. We have been fortunate to be in an interglacial period over the last 10,000 years that has allowed humans to exist and grow. For the past 1000 years temperatures have remained relatively stable but in the last 100 years there has been a noticeable increase. This began when humans began to clear the forests and burn fossil fuels.
Our planet has gone through extreme climate change in the past.
Photo: NOAA.
Evidence of these temperature changes has come from analysis of radioisotopes, fossils, plankton, ocean sediments, and tiny bubbles in ice cores. Additional evidence has come from pollen found at the bottom of lakes, tree rings, bat dung in caves, and temperature records collected since 1861.
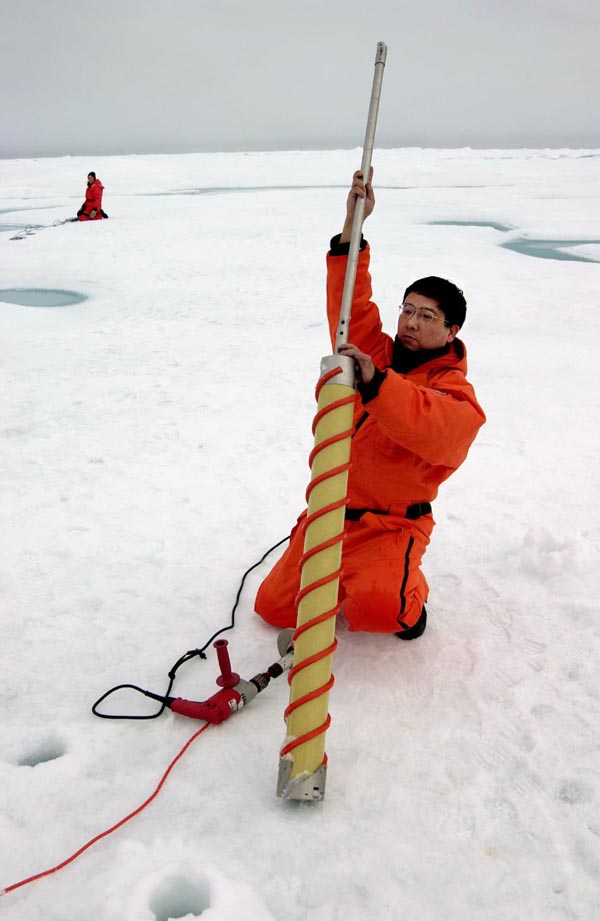
An ice core is being removed by a NOAA scientist.
Photo: NOAA
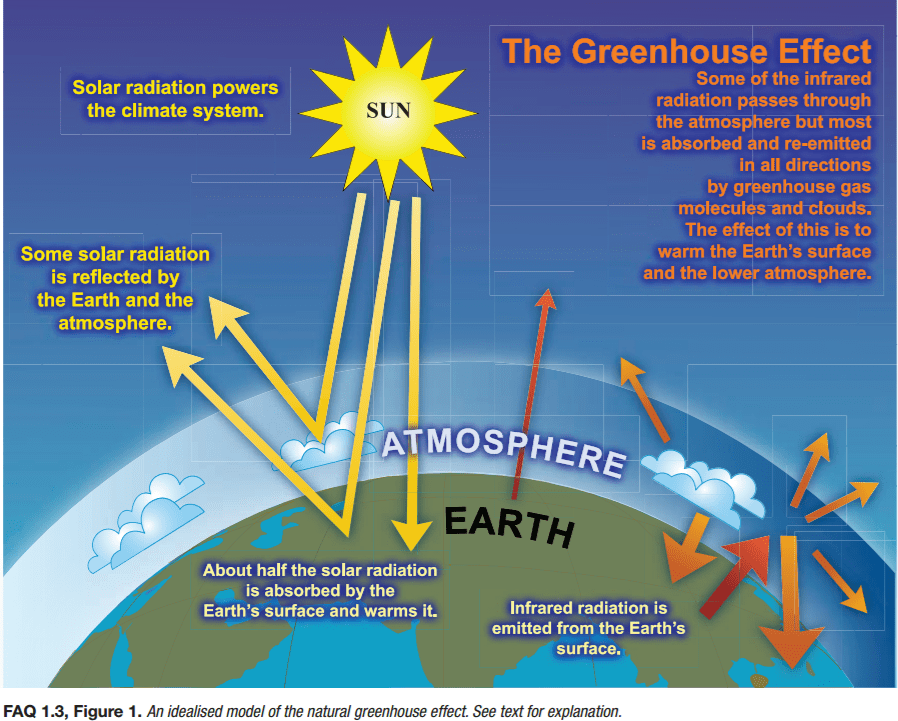
Interestingly we need the greenhouse effect to maintain the temperatures within a range for us to survive. The Swedish scientist Svante Arrhenius first explained this greenhouse effect in 1896. Solar radiation penetrates our atmosphere and warms the surface of the earth. Hot air generated from this surface heating rises but is trapped by a layer gas that includes carbon dioxide, methane, and water vapor. These gases act as a greenhouse allowing light through but trapping the rising heated air. Hence, they are known as greenhouse gases. Without this natural greenhouse layer, the planet would be too cold for us to live here.
The greenhouse effect.
Image: NOAA
The industrial revolution began about 300 years ago. The burning of fossil fuels, and loss of photosynthetic trees due to deforestation, resulted in significant increases in these greenhouse gases. According to a 2007 study, if CO2 emissions continue to increase at a rate of 3.3% each year, we will reach CO2 concentrations near 560 parts per million by 2050 and could reach levels near 1,390 ppm by 2100. At the time this was stated, 2011, scientific studies and models suggested we should prevent CO2 from exceeding 450 ppm. Going beyond this we might exceed a tipping point that could trigger climate change impacts for centuries. NOTE: NOAA published in 2023 that the atmospheric CO2 concentration was 419 ppm.
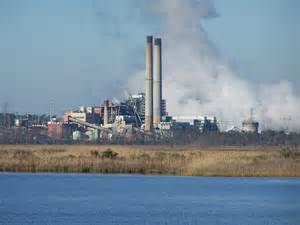
Power plant on one of the panhandle estuaries.
Photo: Flickr
In 1988 the United Nations and the World Meteorological Organization established the Intergovernmental Panel on Climate Change (IPPC) to review past climate changes and predict future ones. This network included over 2500 climate experts from 130 countries. In their 2007 report they stated…
- It is very likely (90-99% probability) that the lower atmosphere is warming.
- Human activities are responsible for this.
Evidence used for these statements include:
- Between 1906-2005 the mean global surface temperature had risen 1.3°F. Most of the increase had taken place SINCE 1980.
- Annual greenhouse gases emissions from human activity have risen 70% between 1970 and 2005. Average CO2 emissions were higher than they have been in 650,000 years.
- Since 1960 Arctic temperatures have risen twice as fast as the rest of the planet.
- In some parts of the world glaciers and sea ice were melting, rainfall patterns were changing, and prolonged droughts were on the rise.
- During the 20th century sea levels rose between 4-8 inches.
Data in 2011 showed that the melting of ice in the Arctic had increased since the 2007 IPPC report. One scientist, Allan Robock, stated that the ice was melting at a faster rate than their computer models said it would.
What is the scientific consensus about future temperature change?
- It is very likely (90-99% probability) that human activities are the cause of the recent increase. Particularly the burning of fossil fuels.
- It is very likely (90-99% probability) the earth’s mean surface temperature will increase 3.6-8.1°F between 2005 and 2100. NOTE: Since 2005 the rate of warming has doubled. In one year (2023) the mean temperature of the planet increased 1.44°F – the largest annual increase in 144 years. This was partially due to being an El Nino year.
In 2011 there was the question as to whether the oceans could help absorb CO2 from the atmosphere. At that time the ocean was absorbing between 25-30% of the CO2 emitted by humans. However, the solubility of CO2 in the oceans decreases with increasing water temperatures. As the oceans warm some of the dissolved CO2 would be re-released into the atmosphere and could amplify global warming and climate change. At that time, the oceans had warmed between 0.6-1.2°F during the 20th century. According to a 2007 study the oceans were absorbing less CO2 than they had in the past. NOTE: A 2017 study indicated that mean sea surface temperatures of the oceans have increased 0.22°F since 2000. This is twice as fast as the early models predicted.
The consensus is that the warming predicted by the computer models used at the time is occurring and – in some cases – faster than they thought.
In Part 3 we will look at what they thought some of the possible effects of this warming trend could be and whether any of those predictions have actually happened.
References
Miller, G.T., Spoolman, S.E. 2011. Living in the Environment; Concepts, Connections, and Solutions. 16th Edition. Brooks and Cole. Belmont CA. 674 pp.
Lindsey R. 2024. Climate Change: Atmospheric Carbon Dioxide. NOAA Climate. https://www.climate.gov/news-features/understanding-climate/climate-change-atmospheric-carbon-dioxide.
by Rick O'Connor | Jun 21, 2024
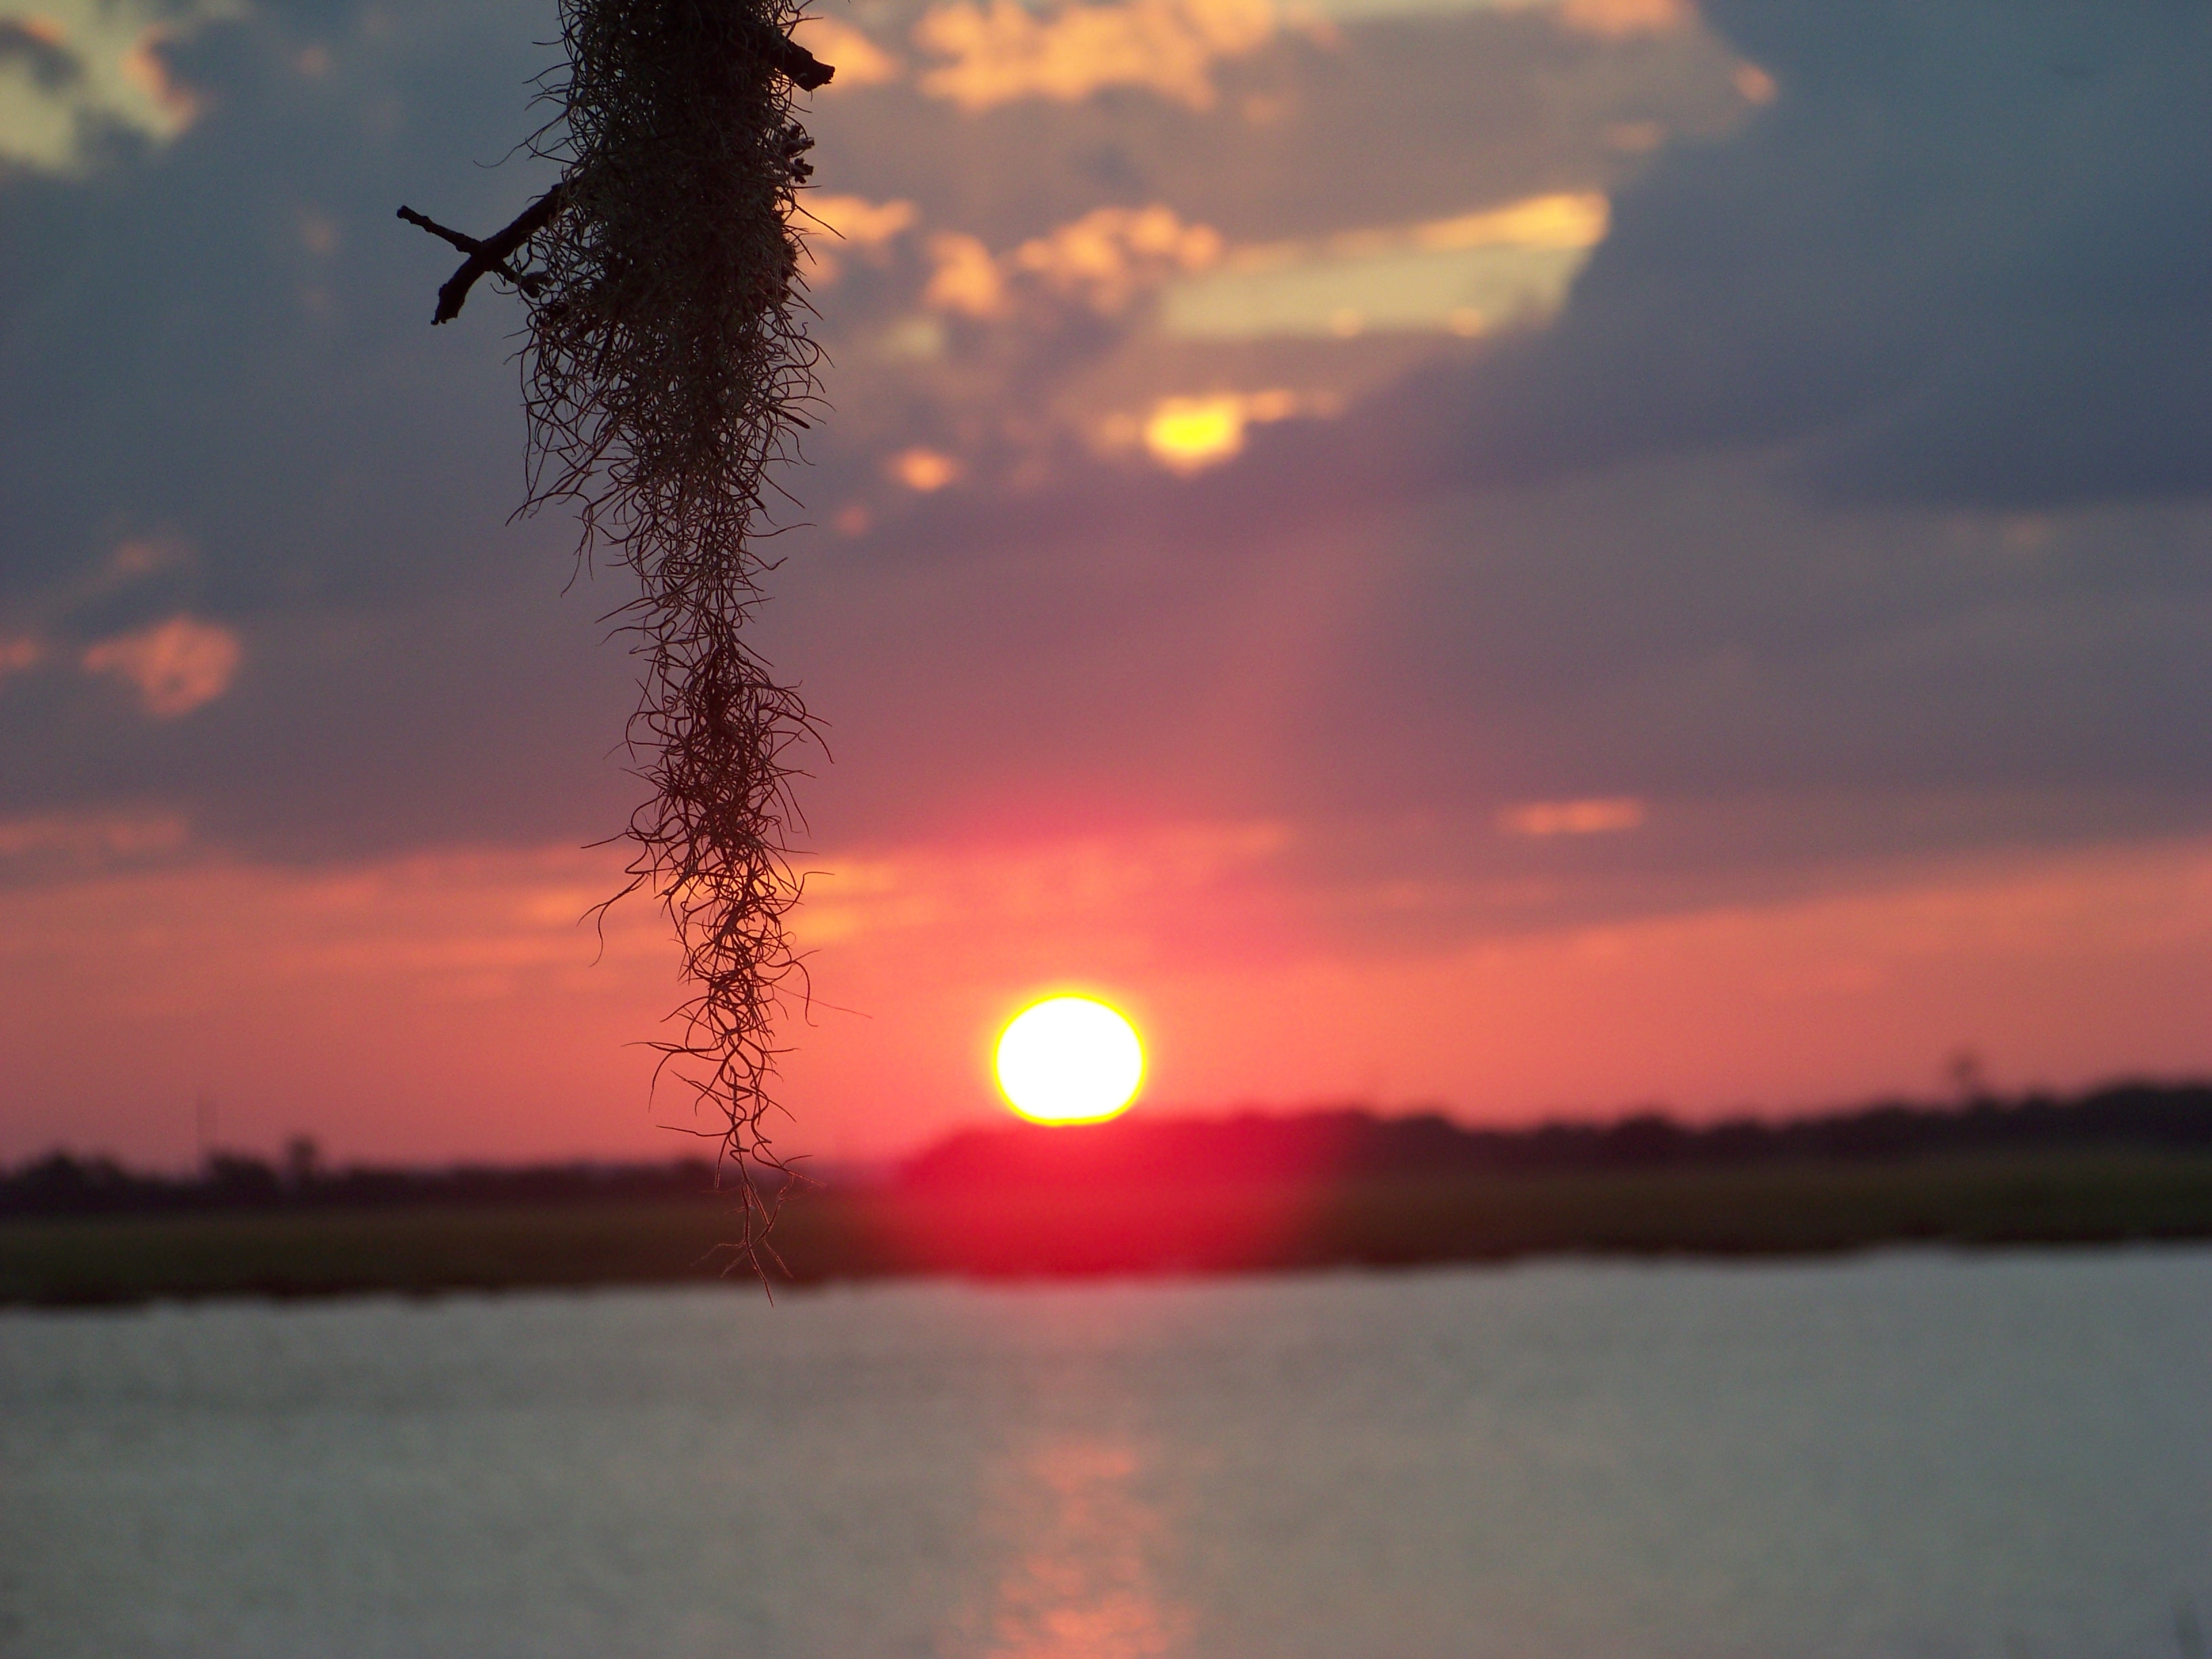
Many from the “baby boomer” generation, which includes me, can probably tell you weather patterns have changed since we were kids. Growing up in Pensacola I remember the pattern of a typical summer day. It would be sunny in the morning, when most of us would get out and do our daily activities, whatever those might have been. The land breezes would shift to sea breeze around noon and by mid afternoon there would be a thunderstorm. These storms generally passed quickly and were followed by a sunny, but cooler afternoon with wonderful sunsets. Most summer days were like this. During winter we generally had frost on the ground – at least three days a week. Again, those who grew up with this I am sure have noticed – it has changed.
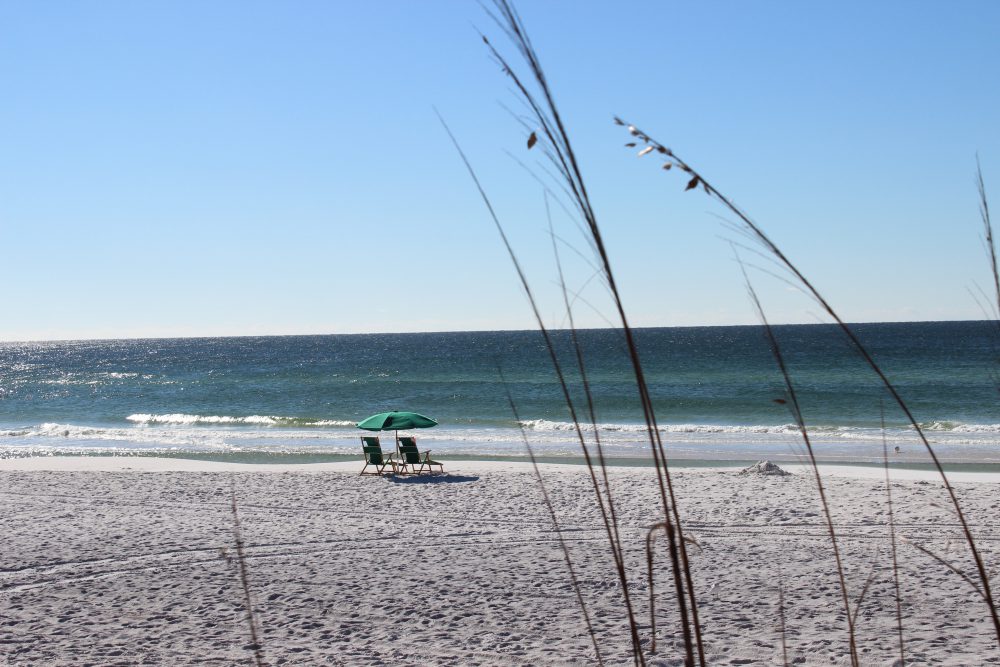
In the past people would enjoy the beach in the mornings before the daily afternoon thunderstorm.
Photo: Rick O’Connor
Our summer days now seem to be periods of several long hot days with little or no rain at all. When rain does come it seems to be intense, it could last all day and may occur for several days in a row. We will go through periods of intense rain followed by days of all most drought conditions. The days seem to be hotter. If you watch the news, we are continually breaking temperature records. The same could be said about rainy days, there have been several “100-year flood” events in the past decade. Hurricanes were once things we dealt with once in a decade, we now seem to be in the “cone of uncertainty” of some storm each season.
In addition to the changes with weather have come changes with coastal plants and animals. Mangroves, snook, and bone fish – all once thought of as “south Florida species” are now appearing along the Florida panhandle. Manatee encounters are increasing and the threat of invasive species – which once was not an issue due to our colder winters – is something we now must look at. It is changing. As we observe these changes, I often get the question – “is this due to climate change?”

Black mangroves growing near St. George Island in Franklin County.
Photo: Joshua Hodson.
In the 1990s I taught environmental science at Pensacola State College and AP Environmental Science at Washington High School. Climate change was a topic we covered and discussed the latest science behind the topic. I still have the textbook I taught from and thought it might be interesting to look back at what was being said at the time and whether the predictions given were actually happening. The chapter on climate change began with a case study. It provided the following:
In June of 1991 the active volcano Mount Pinatubo in the Philippines erupted. The eruption released ash and compounds 22 miles up into the atmosphere. Hot gases and ash rolled down the mountain side killing hundreds of people and filling valleys with toxic materials. It destroyed communities and caused hundreds of millions of dollars’ worth of damage. Despite the horrific impact it also provided scientists with an opportunity.
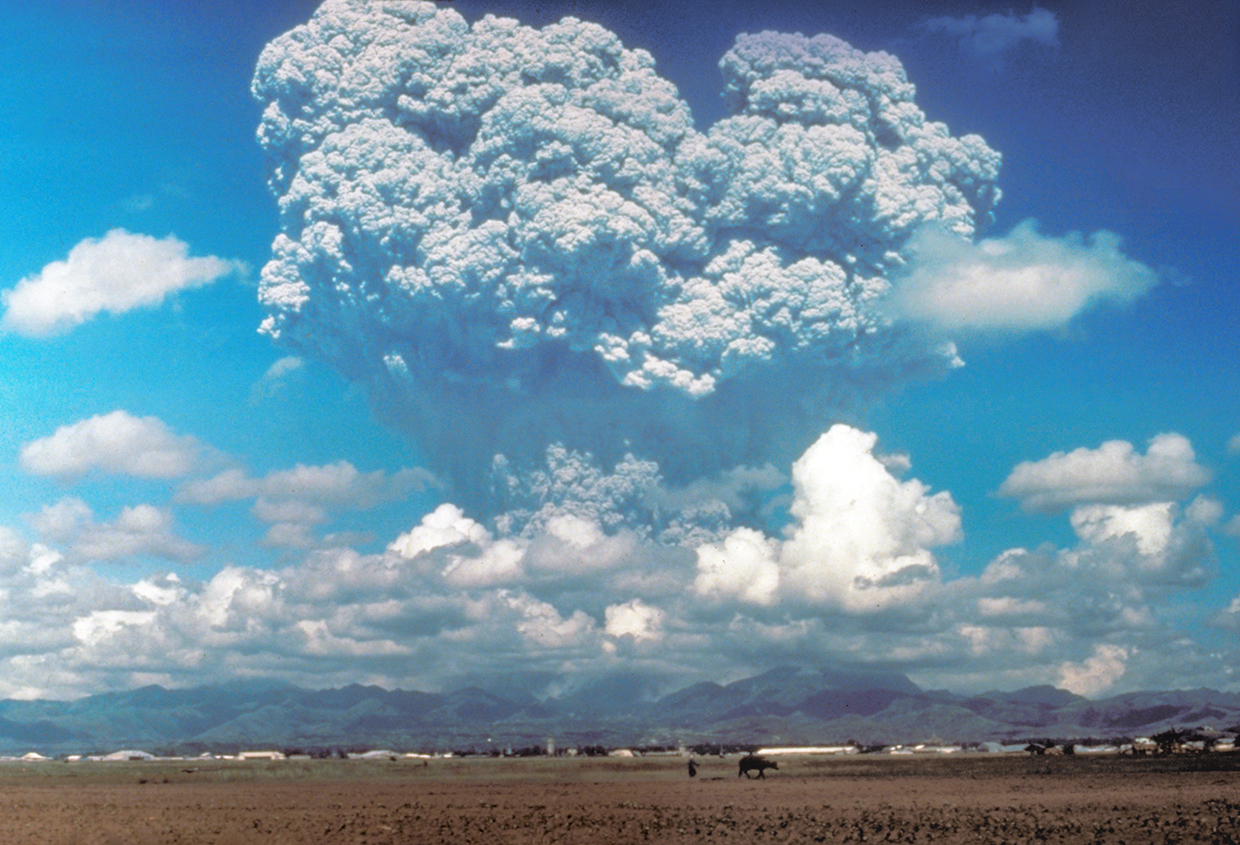
The eruption of Mt. Pinatubo.
Photo: NOAA
Climate scientists had been monitoring global warming for a couple of decades at that point and had developed computer models that could predict both the change of climate in the future (if such warming trends continued) and what impacts these changes may have. But unlike the computer models used to predict the course and landfalls of hurricanes, they had no way of testing them. But with the eruption of Mt. Pinatubo, the opportunity was there.
Based on such models, James Hansen, a NASA scientist at the time, predicted the volcanic eruption would first cool the planet 1°F over a 19-month period and then begin to warm. He predicted that by 1995 temperatures would return to normal. His predictions proved correct. The model had passed the test. This case helped convince most scientists and policy makers that climate model projections should be taken seriously.
Hansen’s model, and 18 other climate models, indicated that global temperatures were likely to rise several degrees during the century – mostly due to human actions – and affect global and regional climates and economies.
Over the next few weeks, we will post a series of articles looking at what was discussed decades ago and see whether the weather patterns we are experiencing match the predictions we discussed in class at that time. We will take another look at climate change.
Part 2 – How Might the Earth’s Temperature and Climate Change in the Future?