by Rick O'Connor | Sep 23, 2021
In Part 3 we are going to look at the most recent Assessment Report No.6 (AR6) published by the Intergovernmental Panel on Climate Change. This document is 3,946 pages – so, we will focus only on the executive summary for policy makers. This summary circles on the key points of the report. It was published August 7, 2021.
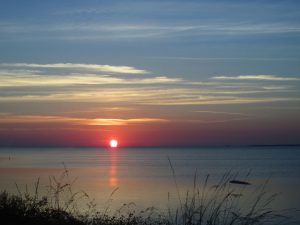
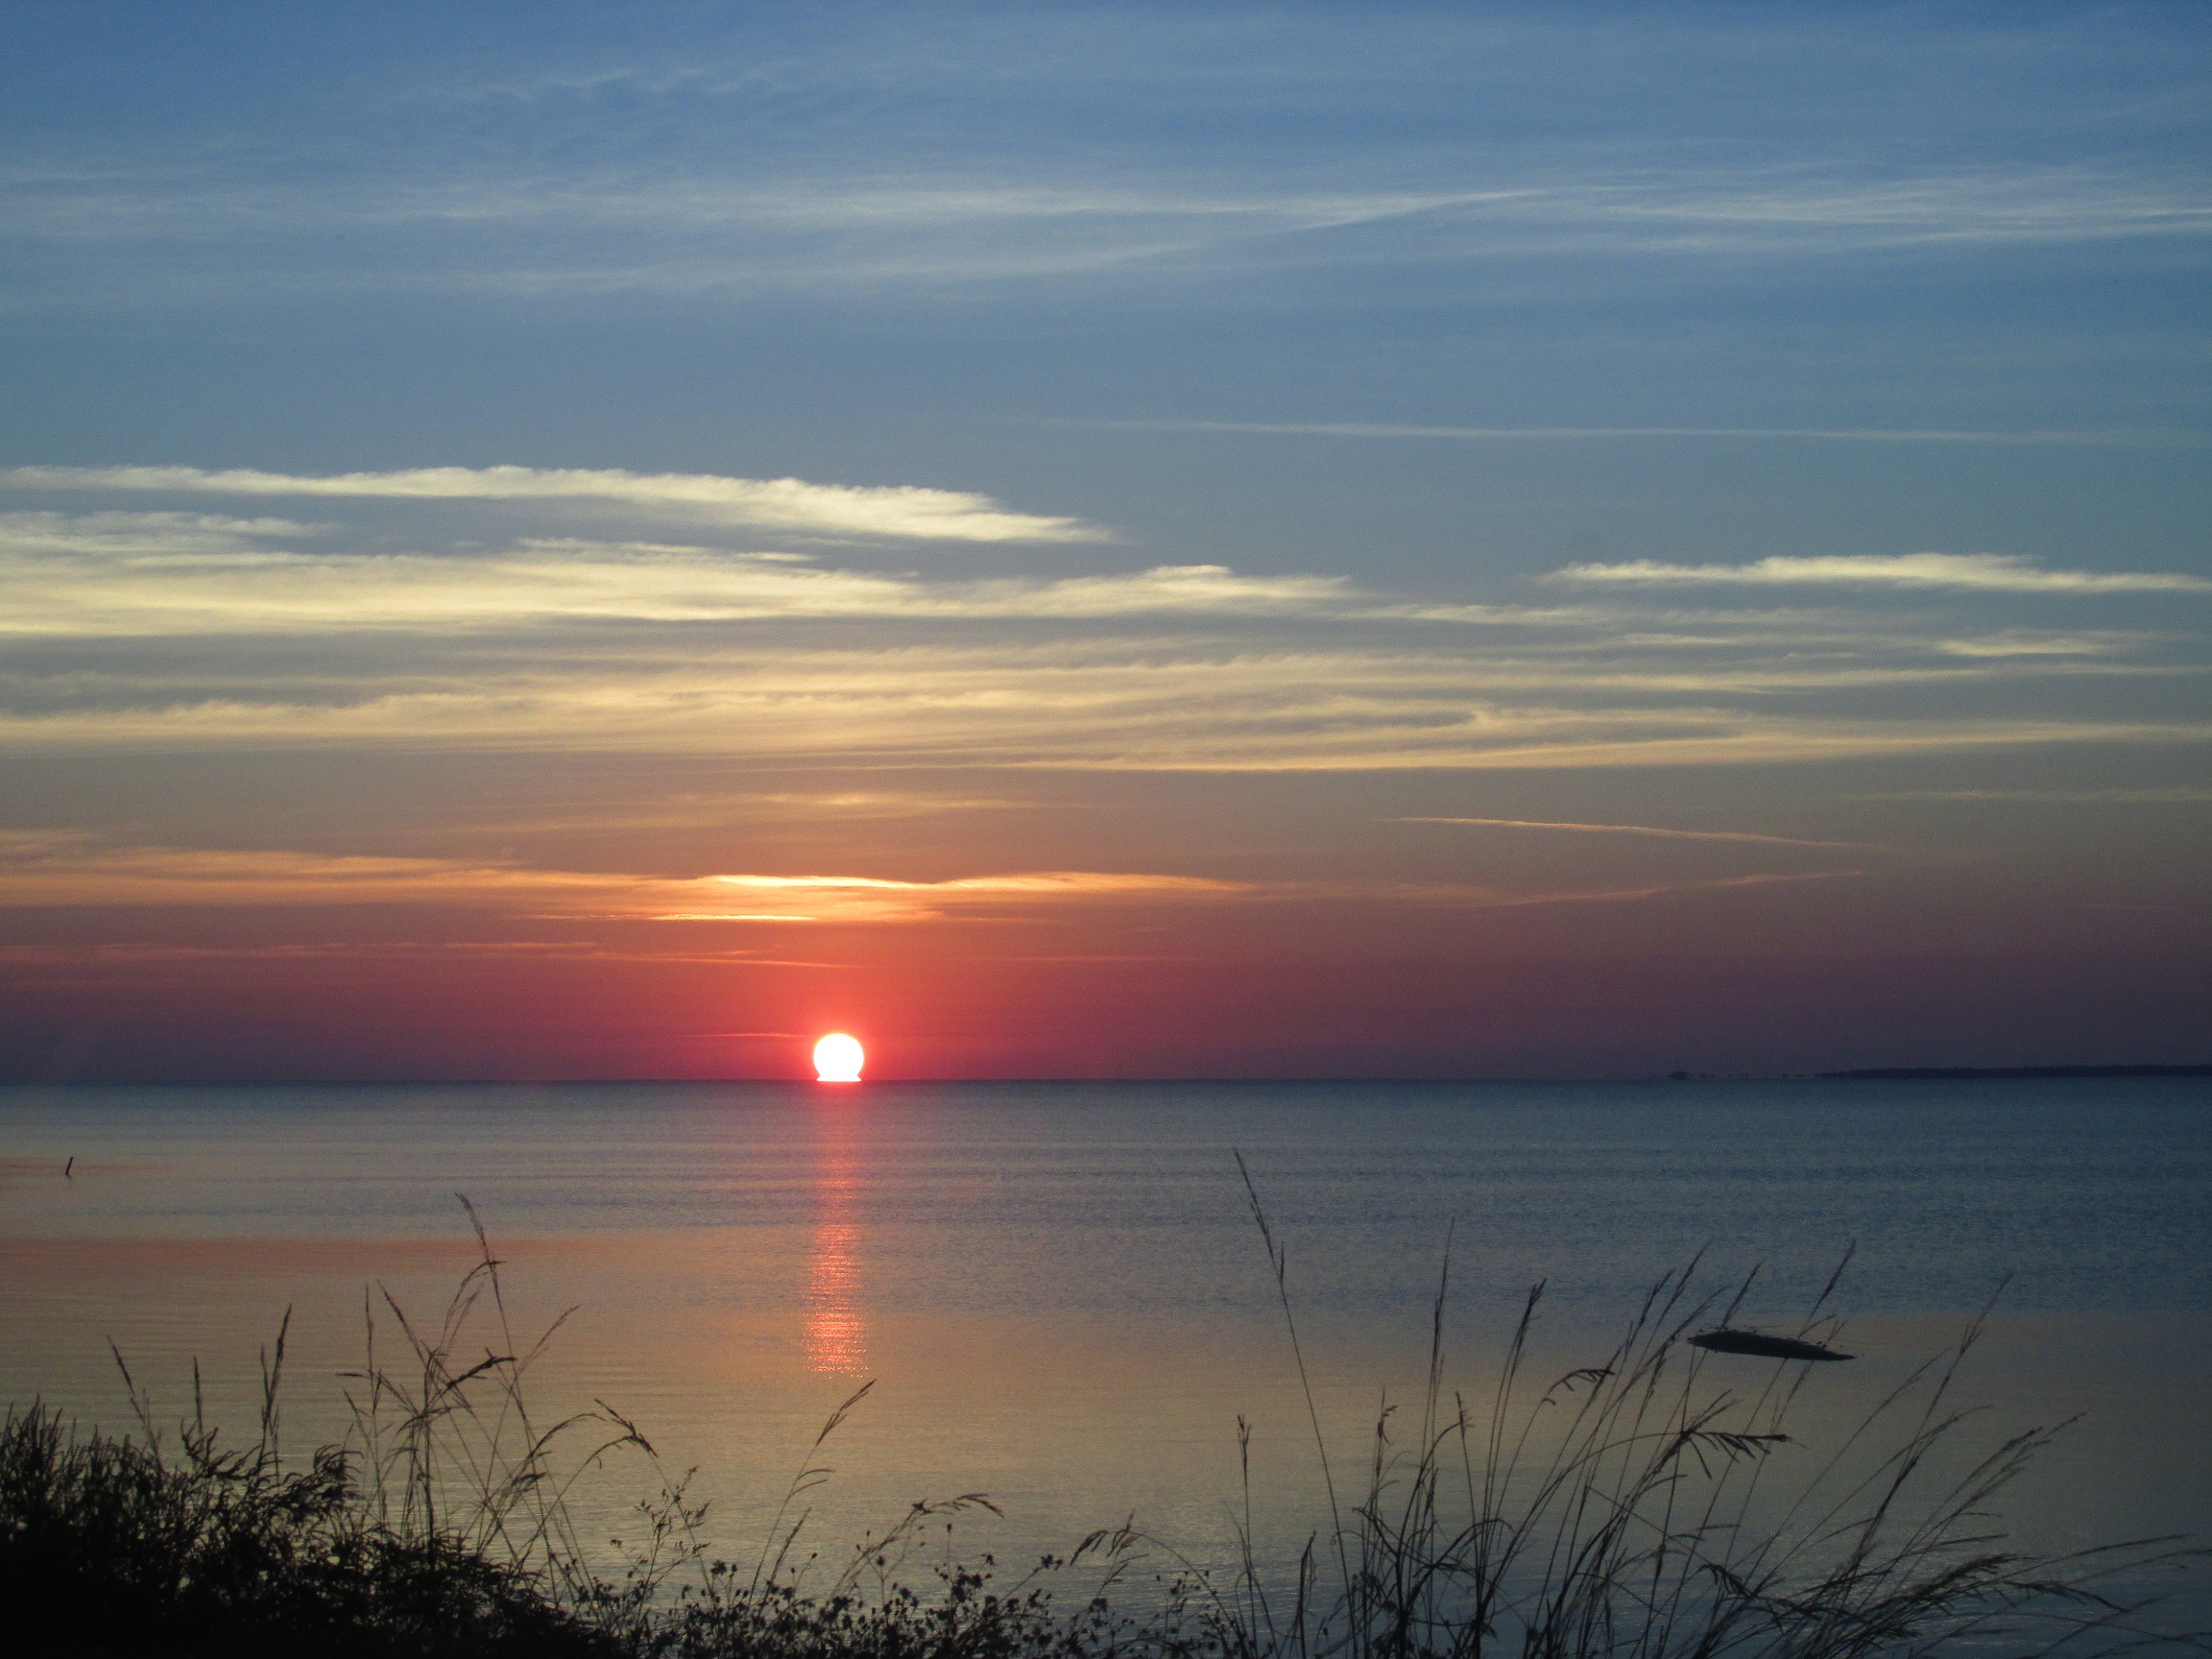
Sunrise over Apalachicola Bay in Northwest Florida
The Intergovernmental Panel on Climate Change
Who is the IPCC?
It is a panel developed by the United Nations to address the topic of global climate change. It was created in 1988 by the World Meteorological Organization and the United Nations Environmental Programme. It currently has 195 members and contributions from thousands of scientists. The panel scientists volunteer their time to review all of the scientific papers that are used in the assessment reports. The panel meets one or more times a year1.
IPCC Assessment Report Six (AR6) – August 7, 2021
All of the assessment reports are based on scientific information and presented as statements of fact, or statements at a level of confidence using an IPCC calibrated language (such as likely, medium confidence, high confidence, etc.). The summary for policy makers is divided into four sections. We will summarize each one.
- Current State of the Climate
- Possible Climate Futures
- Climate Information for Risk Assessment and Regional Adaptation
- Limiting Future Climate Change
- Current State of the Climate
A.1) It is unequivocal that human influence has warmed the atmosphere, ocean, and land. Widespread and rapid changes in the atmosphere, ocean, cryosphere, and biosphere have occurred.
The definition of unequivocal is “leaving no doubt, unquestionable, clear”. Using that term here indicates the panel is convinced that the current warming of our planet is caused by human activity. Thus, there is something we can do to turn it around.
Other statements in this section include:
- Each of the last four decades has been successively warmer than any decade preceded it since 1850.
- Globally averaged precipitation over land has likely increased since 1950, with a faster rate of increase since the 1980s.
This term likely is one of the terms used by their calibrated language model. Suggesting the confidence level is not as high – but likely.
- It is likely that human influence contributed to the pattern of observed precipitation change since the mid-20th century, and extremely likely that human influence contributed to the pattern of observed changes in near-surface ocean salinity.
- Mid-latitude storm tracks have likely shifted poleward in both hemispheres since the 1980s.
- Human influence is very likely the main driver of the global retreat of glaciers since the 1990s and the decrease in the Arctic Sea ice area between 1979-1988 and 2010-2019 is about 40% in September and 10% in March.
- It is virtually certain that the global upper ocean (0-2400 feet) has warmed since the 1970s and extremely likely that human influence is the main driver.
- Global mean sea level increased by 0.7 feet between 1901 and 2018.
- Changes in land ecosystems since 1970 are consistent with global warming. Climate zones have shifted poleward in both hemispheres and growing seasons have, on average, lengthened by up to two days per decade since the 1950s. This is stated with high confidence.
A.2) The scale of recent changes across the climate system as a whole and the present state of many aspects of the climate system are unprecedented over many centuries to many thousand years.
- In 2019, atmospheric CO2 concentrations were higher than at any time in at least 2 million years (high confidence), and concentrations of CH4 (methane) and N2O (nitrous oxide) were higher than at any time in at least 800,000 years (very high confidence).
- Global surface temperature has increased faster since 1970 than in any other 50-year period over at least the last 2000 years (high confidence).
- In 2011-2020, annual average Arctic Sea ice area reached its lowest level since at least 1850 (high confidence).
- Global mean sea level has risen faster since 1900 than over any preceding century in at least the last 3000 years (high confidence).
A.3) Human-Induced climate change is already affecting many weather and climate extremes in every region across the globe. Evidence in observed changes in extremes such as heatwaves, heavy precipitation, droughts, tropical cyclone, and (in particular) their attribution to human influence, has strengthen since AR5.
- It is virtually certain that hot extremes have become more frequent and more intense across most land regions since the 1950s, while cold extremes have become less frequent and less severe, and that human-induced climate change is the main driver (high confidence).
- The frequency and intensity of heavy precipitation events have increased since the 1950s over most land area for which observational data are sufficient for trend analysis (high confidence), and human-induced climate change is the main driver (likely).
- It is likely that the global proportion of major (Category 3-5) tropical cyclone occurrence has increased over the last four decades, and the latitude where the cyclones reach their peak intensity has shifted northward. These changes cannot be explained by internal variability alone (medium confidence). There is low confidence in long-term (multi-decade to centennial) trends in the frequency of all-category tropical cyclones. Event attribution studies and physical understanding indicate that human-induced climate change increases heavy precipitation associated with tropical cyclones (high confidence), but data limitations inhibit clear detection of past trends on the global scale.
- Human influence has likely increased the chance of compound extreme events since the 1950s.
- Possible Climate Futures
B1. Global surface temperature will continue to increase until at least the mid-century under all emissions scenarios considered. Global warming of 1.5°C and 2°C will be exceeded during the 21st century unless deep reduction in CO2 and other greenhouse gas emissions occur in the coming decades.
- Compared to 1850-1900, global surface temperature averaged over 2081-2100 is very likely to be higher than 1.0°C to 1.8°C under the VERY LOW greenhouse gas emissions scenario. 1°C – 3.5°C in the INTERMEDIATE scenario. And 3.3°C to 5.7°C under the VERY HIGH scenario.
- Global surface temperature in any single year can vary above or below the long-term human-induced trend, due to substantial natural variability.
B2. Many changes in the climate system become larger in direct relation to increasing global warming. They include increases in the frequency and intensity of hot extremes, marine heatwaves, heavy precipitation, agricultural and ecological droughts in some regions, and proportion of intense tropical cyclones, as well as reductions in Arctic Sea ice, snow cover, and permafrost.
- It is virtually certain that the land surface will continue to warm more than the ocean surface. It is virtually certain that the Arctic will continue to warm more than the global surface temperature.
- With every additional increment of global warming, changes in extremes continue to become larger.
- Some mid-latitude and semi-arid regions, and the South American Monsoon region, are projected to see the highest increase in the temperature of the hottest days, about 1.5 to 2 times the global rate of warming (high confidence).
- It is very likely that heavy precipitation events will intensify and become more frequent in most regions with additional global warming.
- Additional warming is projected to further amplify permafrost thawing, and loss of seasonal snow cover, of land ice, and of Arctic Sea ice (high confidence).
B3. Continued global warming is projected to further intensify the global water cycle, including its variability, global monsoon precipitation and severity of wet and dry events.
- There is strengthened evidence since AR5 that the global water cycle will continue to intensify as global temperatures rise (high confidence), with precipitation and surface water flows projected to become more variable over most land regions within seasons (high confidence) and from year to year (medium confidence).
- A warmer climate will intensify very wet and very dry weather and climate events and seasons, with implications for flooding and droughts (high confidence), but the location and frequency will depend on projected changes in regional and atmospheric circulation, including monsoons and mid-latitude storm tracks.
B4. Under scenarios with increasing CO2 emissions, the ocean and land carbon sinks are projected to be less effective at slowing the accumulation of CO2 in the atmosphere.
- Based on model projections, under the intermediate scenario that stabilizes atmospheric CO2 concentrations this century, the rates of CO2 taken up by the land and oceans are projected to decrease in the second half of the 21st century (high confidence).
B5. Many changes due to past and future greenhouse gas emissions are irreversible for centuries to millennia, especially changes in the ocean, ice sheets, and global sea level.
- Past greenhouse gas emissions since 1750 have committed the global ocean to future warming (high confidence).
- Mountain and polar glaciers are committed to continue melting for decades or centuries (very high confidence).
- It is virtually certain that global mean sea level will continue to rise over the 21st
- In the longer term, sea level is committed to rise for centuries to millennia due to deep ocean warming and ice sheet melt and will remain elevated for thousands of years (high confidence).
- Climate Information for Risk Assessment and Regional Adaptation
C1. Natural drivers and internal variability will modulate human-induced changes, especially at regional scales and in the near term, with little effect on centennial global warming. The modulations are important to consider in planning for the full range of possible changes.
What this is basically stating is that the predictions made with the computer models, can be altered by natural drivers (such as nearby ocean currents, forested land, or even urban-induced weather) as well as internal variability (such as the humidity at time of cyclone formation, wind conditions during a heavy rainfall, etc.). These are regional impacts and are not accounted for in the models.
C2. With further global warming, every region is projected to increasingly experience concurrent and multiple changes in climate impact-drivers. Changes in several climatic impact-drivers would be more widespread to 2°C compared to 1.5°C global warming and even more widespread and/or pronounced for higher warming levels.
Basically… as the model predictions occur, their impacts on the climate can change enough that the data inputted into the model could be warmer than anticipated and thus, increase the outcome predicted.
- It is very likely to virtually certain that regional mean relative sea level rise will continue throughout the 21st century, except in a few regions with substantial geologic land uplift rates.
- Cities intensify human-induced warming locally, and further urbanization together with more
frequent hot extremes will increase the severity of heatwaves (very high confidence).
- Many regions are projected to experience an increase in the probability of compound events with higher global warming (high confidence).
C3. Low-likelihood outcomes, such as ice sheet collapse, abrupt ocean circulations changes, some compound extreme events and warming substantially larger than the assessed very likely ranges of future warming cannot be ruled out and are part of risk assessment.
Unpredictable and rare natural events not related to human influence on climate may lead to low likelihood, high impact outcomes.
- Limiting Future Climate Change
D1. From a physical science perspective, limiting human-induced global warming to a specific level requires limiting CO2 emissions, reaching at least net zero CO2 emissions, along with strong reductions in other greenhouse gases. Strong, rapid and sustained reductions in CH4 (methane) emissions would also limit the warming effect resulting from the declining aerosol pollution and would improve air quality.
- Removing CO2 by humans leading to net negative emissions would reverse surface ocean acidification (high confidence).
- If global net negative CO2 emissions were to be achieved and be sustained, the global CO2-induced surface temperature increase would gradually reverse, but other climate change would continue in their current direction for decades to millennia (high confidence). For instance, it would take several centuries to millennia for global mean sea level to reverse course even under large net negative CO2 emissions (high confidence).
D2. Scenarios with very low or low greenhouse gas emissions lead within years to discernible effects on greenhouse gas and aerosol concentrations, and air quality, relative to high and very greenhouse gas emissions scenarios. Under these contrasting scenarios, discernible differences in trends of global surface temperature would begin to emerge from natural variability within around 20 years, and over longer time periods for many other climate impact-drivers (high confidence).
Basically… at high confidence – if we can reduce the amount of greenhouse gas emissions to match the low emission scenario used by the models, the climate outcomes would be reduced as well.
- Emissions reductions in 2020 associated with measures to reduce the spread of COVID-19 led to temporary but detectible effects on air pollution (high confidence), and an associated small, temporary increase in total radiative forcing, primarily due to reductions in cooling caused by aerosols arising from human activities (medium confidence).
- Scenarios with very low or low GHG emissions would have rapid and sustained effects to limit human-caused climate change, compared with scenarios with high or very high GHG emissions, but early responses of the climate system can be masked by natural variability.
SUMMARY OF THIS REPORT
- Based on the report – there is no doubt that human-induced greenhouse gases have warmed the planet.
- The climatic changes observed over the last century are unprecedented.
- Weather and climate extremes are occurring.
- No matter what we do, global surface temperatures will continue to increase until mid-century.
- If the annual increases in greenhouse gas emissions continues, their weather/climate impacts will increase as well.
- If emissions continue at their present rate, the carbon sinks (methods of removing carbon – both land and ocean) will become less effective.
- With high confidence – some impacts are irreversible – oceans will continue to warm, ice sheets and glaciers will continue to melt, and sea level will continue to rise for centuries and millennia.
- There are local and regional features (nearby ocean currents, forested – or deforested areas, nearby mountain ranges) that can alter the impacts of the computer models for better or worse, than the scenarios presented.
- Some regional climate impacts can affect the outcomes as such as multiple events can occur.
- By reducing greenhouse gases, we can alter some of the impacts predicted in these scenarios.
COMMENTS
Much of this sounds bad… and it is. As we mentioned in Part 1 “everyone is talking about the climate… but no one is doing anything about it” is not 100% true… many are doing something about it. But based on this AR6 report, not enough. The AR6 report also mentions that many of the climate/weather scenarios can be altered if we do begin to make some behavioral changes on the amount of greenhouse gasses we emit AND look into sources of carbon sequestering.
In Part 4 of this series, we will look closer at the impacts this is having on the Florida panhandle.

The Gulf of Mexico as seen from Pensacola Beach.
Photo: Molly O’Connor
References
1 The Intergovernmental Panel on Climate Change
https://www.ipcc.ch/
2 IPCC, 2021: Summary for Policymakers. In: Climate Change 2021: The Physical Science Basis.
Contribution of Working Group I to the Sixth Assessment Report of the Intergovernmental Panel on Climate Change [Masson-Delmotte, V., P. Zhai, A. Pirani, S. L. Connors, C. Péan, S. Berger, N. Caud, Y. Chen, L. Goldfarb, M. I. Gomis, M. Huang, K. Leitzell, E. Lonnoy, J.B.R. Matthews, T. K. Maycock, T. Waterfield, O. Yelekçi, R. Yu and B. Zhou (eds.)]. Cambridge University Press. In Press.
by Rick O'Connor | Sep 17, 2021
In Part 1 we looked at the history, and the science, behind the climate change issue. That post discussed everything said during the early periods up to about 2010. In this post, we will look at what has happened since 2010 and will look at how the early prediction models are working. We will begin with how CO2 levels have changed over the last decade.
CO2 concentrations since 2007
It was mentioned in Part 1 that at the beginning of the industrial revolution the CO2 concentration in the atmosphere was at 280 ppm and had reached 384 ppm by 2007. It was also mentioned that many considered the “tipping point” for CO2 concentration was at 450 ppm11. What has happened since 2007? NOAA reports that the CO2 levels have reached 409.8 ppm (±1.0 ppm) in 2019. This is the highest recorded CO2 value in the last 800,000 years4. This suggests that greenhouse admissions do continue to climb at a rate of about 2 ppm/year. At this rate, we will pass the potential “tipping point” of 450 ppm by 2050. For obvious reasons, this is concerning.
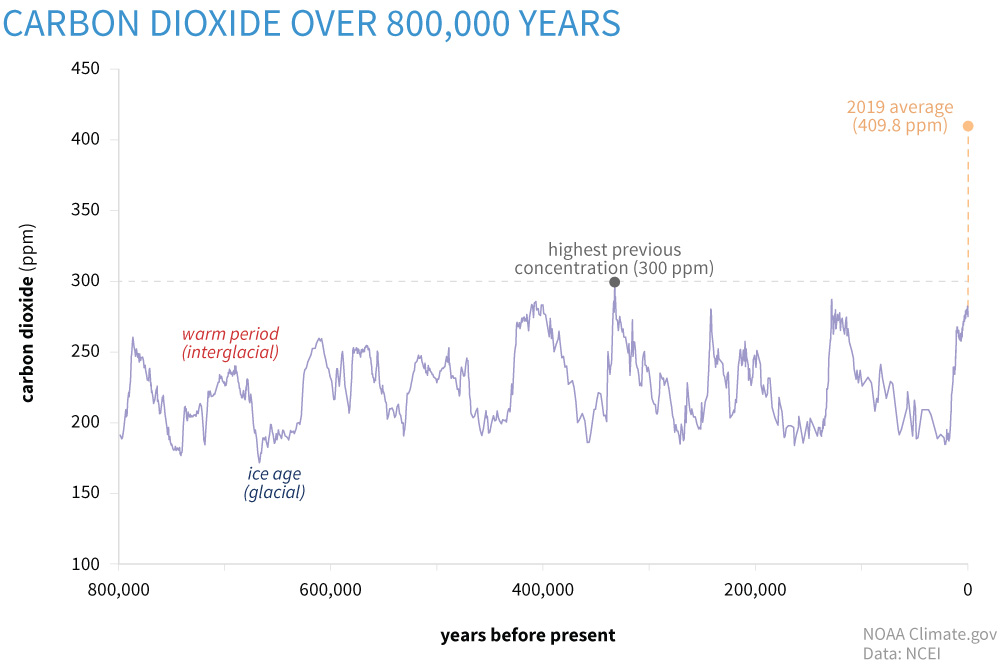
Changes in carbon dioxide levels up to 2019.
Image: NOAA
What about extreme weather conditions?
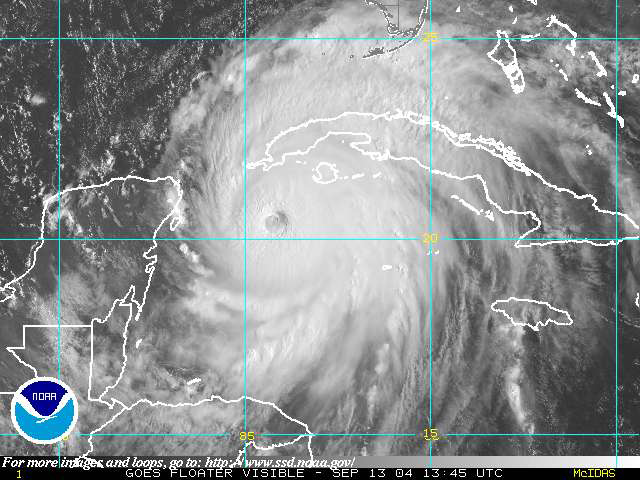
Everyone has noticed the extreme weather conditions posted on the evening news each day. Fires out west, droughts in the southwest, floods in the Mississippi Valley, hurricanes along the Gulf coast, and blizzards/floods/and even tornados in the northeast. There have been catastrophic floods in Europe, and extreme droughts in equatorial Africa. These things have always happened, but they now seem to be more frequent, and more concerning to residents in these areas where they continually occur. They certainly match the pattern predicted by the climate models of the early 1980s and it is hard to argue when in 2020 the named tropical storms went through the entire alphabet and into the Greek alphabet before the storm season was over. Are these becoming more common? Or do they appear to be more common?
A 2021 NOAA publication on sea level rise suggest it is likely that tropical storm frequencies will increase. They work from what is called the power dissipation index (PDI). This index measures storm activity, frequency, duration, and intensity. Correlating the annual index against the annual sea surface temperatures (SSTs) of the Atlantic suggest, at medium to high confidence, the intensity of future tropical storms will increase. But they point out the frequency of storms prior to 1965 was based on ship observations at sea. Numerous storms form over the Atlantic Ocean but only last for a few days and may not make landfall. They argue that some of these could have been missed using the ship observation methods of the early 20th century. One study made a correction for this in their calculations which suggested that the frequency of todays storms may not be that significantly different from those of the earlier 20th century and that the increase could be due to better monitoring today6,7. Either way, it has become custom along the northern Gulf of Mexico to prepare for hurricanes each season, and possibly more than one. As I am writing this, it is early September, and we are currently on storm “N” – Nicholas – the 14th named storm of the season. This is certainly something that warrants continued monitoring.
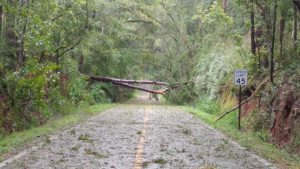
Hurricanes seem to becoming more frequent bringing more frequent damage.
Photo: Dr. Pete Vergot
Record temperatures
At one point during the summer of 2021 there were triple digit air temperatures all over the country. For Arizona, Texas, and Florida it is not unusual to see these high temperatures. But Oregon, North Dakota, and New England it was unusual. It seems we are breaking records on high temperatures each year, and sometimes multiple times a year for some locations. Does the science support what appears to be happening?
Yes…
The data shows the most intense period of warming has occurred in the last 40 years and the seven most recent years are the warmest on record. This publication from NASA also states that 2016 and 2020 tied for the highest record warm days since they began collecting this data, and not only are the records highs increasing – the low temperatures reported from around the country having been increasing since 1950. It is getting warmer3.
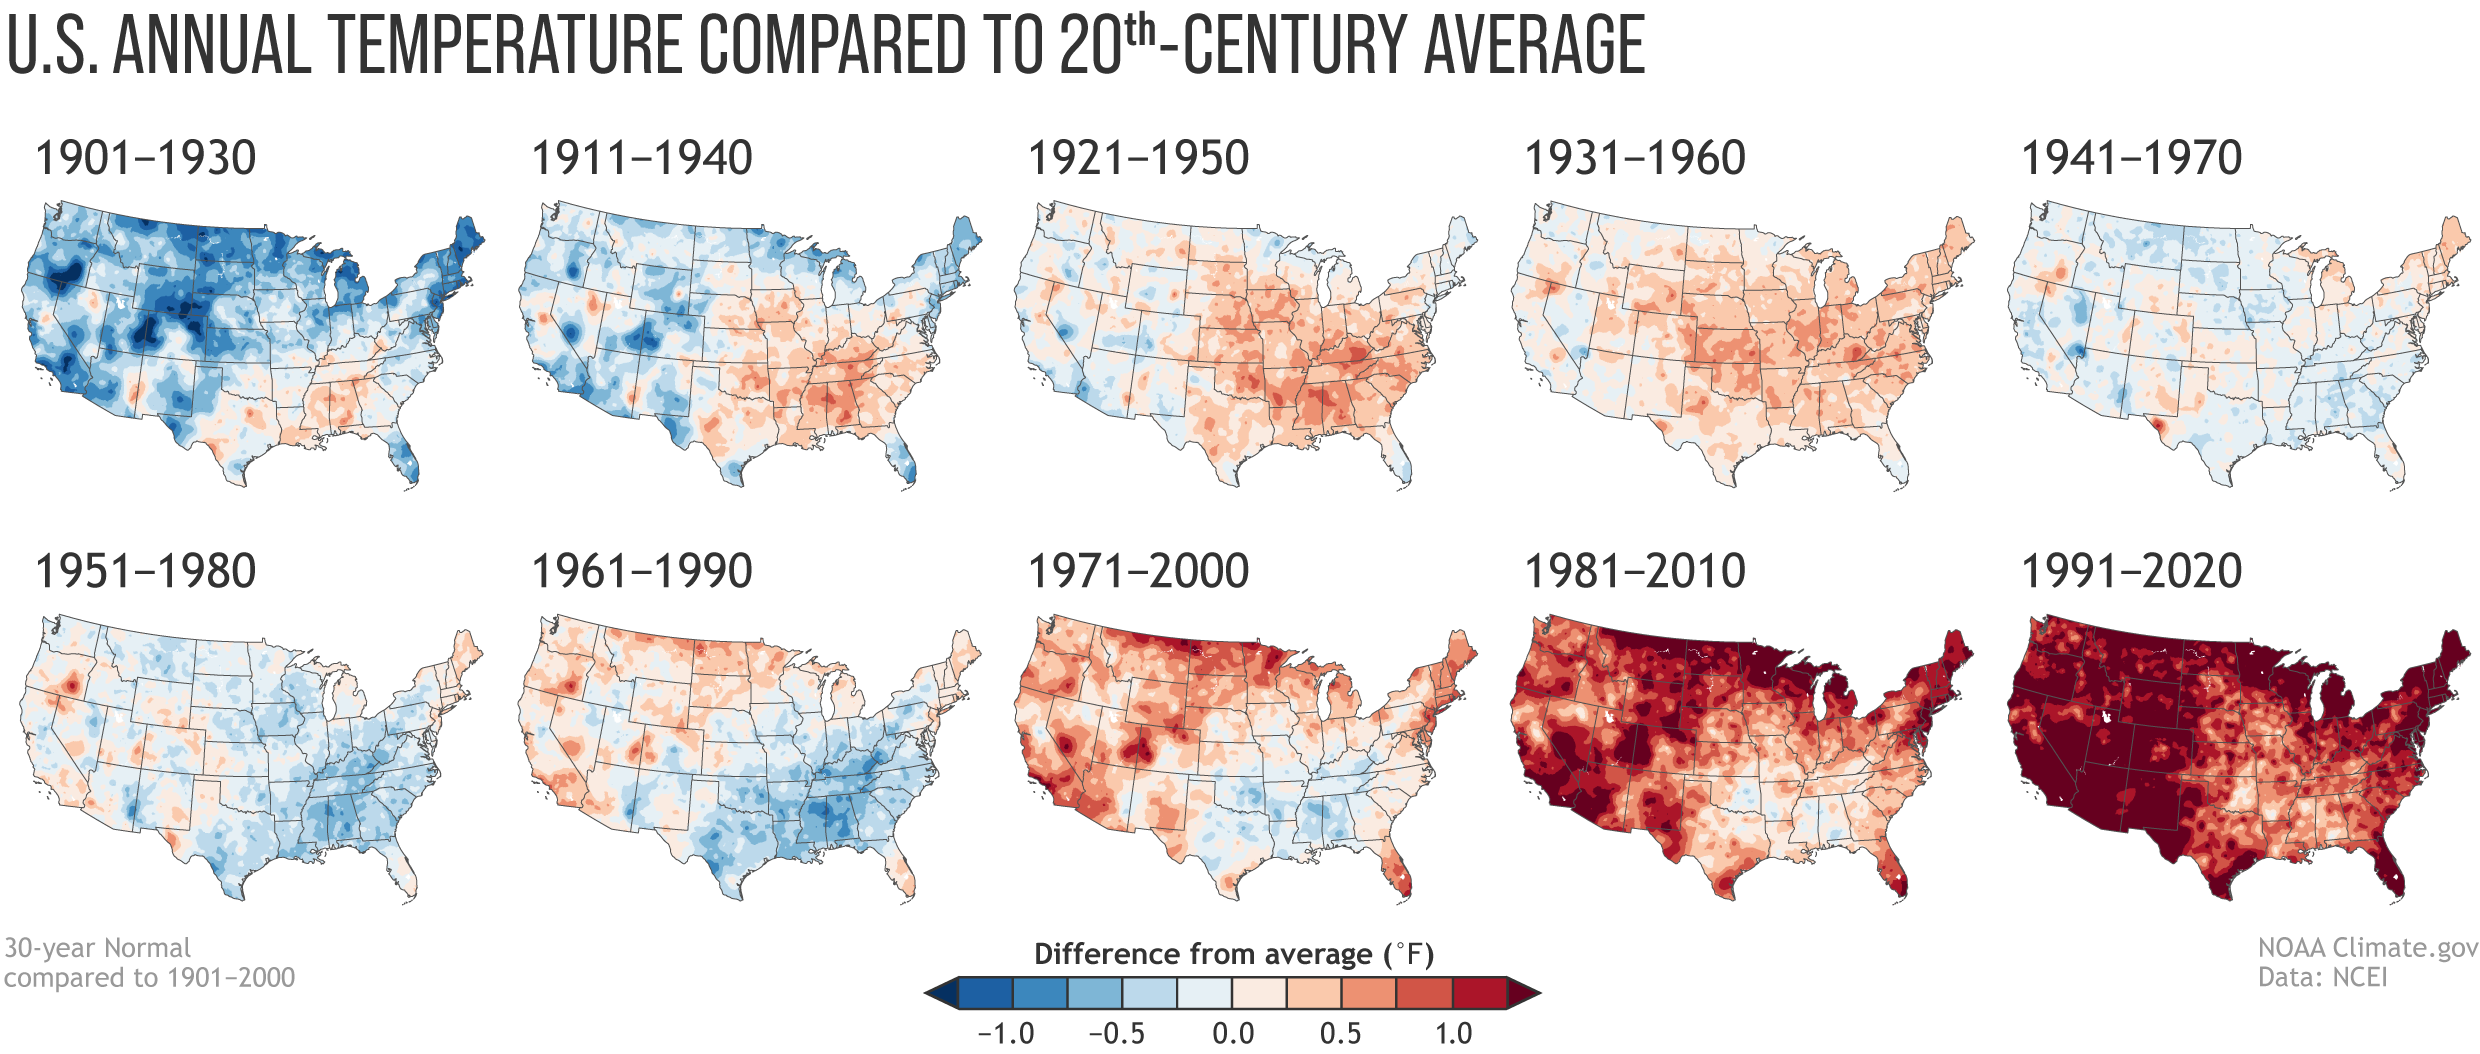
Image: NOAA
The models developed in the 1980s suggested the wet areas of the country will become wetter, and the dry areas will become drier… is this happening?
It appears so…
In the image below published by NOAA you see a series of national maps divided by 30-year periods. The colors indicate wet and dry periods as compared to 20th century averages for those areas. The reds and browns indicate below average rainfall, the greens and blue-greens above average rainfall. You can see at the beginning of the century most of the country was near the century mean. Over the first 50 years there was dry period, which included the famous “dust bowl”. The southwest United States experienced a very dry period in the middle of the century. Beginning in the 1970s it became wetter, with the midwest and northeast become very wet since that time, and the southwest is returning to the dry periods they saw earlier in the century.
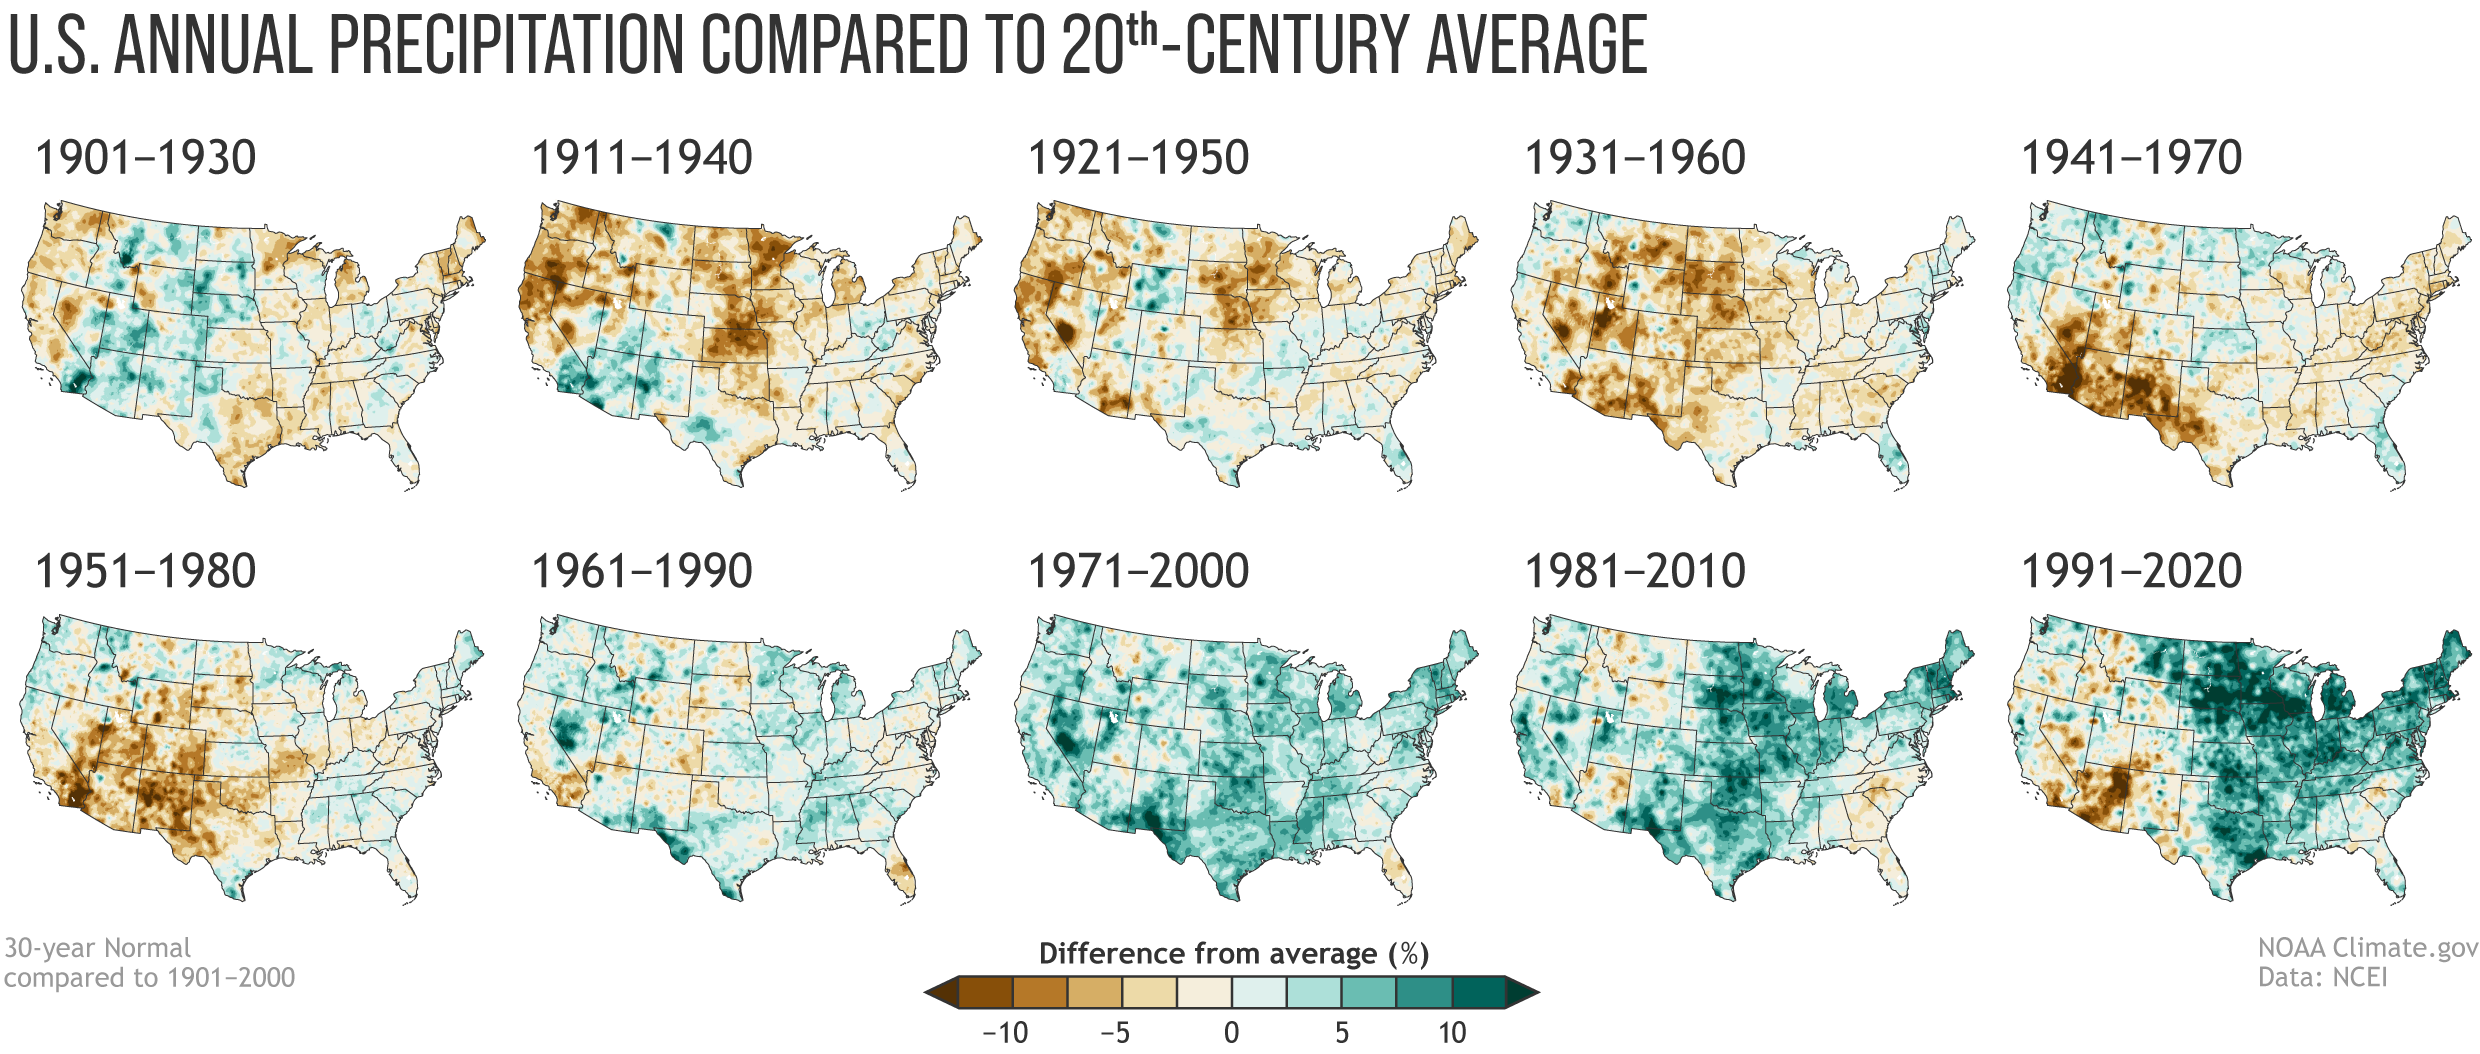
Image: NOAA
At least some of the wetness relative to the 20th century averages is linked to the warming of the atmosphere. Rising temperatures have enhanced evaporation since the 1970s and increased atmospheric moisture and humidity across the middle and eastern portion of the country8.
In a 2021 publication looking at changes in hurricanes and tropical storms, NOAA discusses what are termed “normals”. These are 30-year averages of key atmospheric and climate observations from weather stations across the country. They can be used by climatologists to assess how both the weather and climate compare to “normal” over time.
Tropicalization
This is an interesting phenomena that is occurring, and one we are watching along the northern Gulf of Mexico. The idea is basically tropical climate of the lower latitudes is moving northward across the northern hemisphere, and southward in the southern. It suggests that a warming plant is making temperate areas of the earth more tropical.
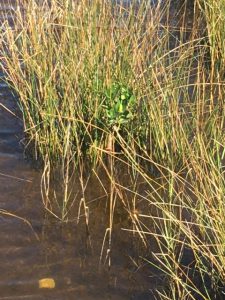
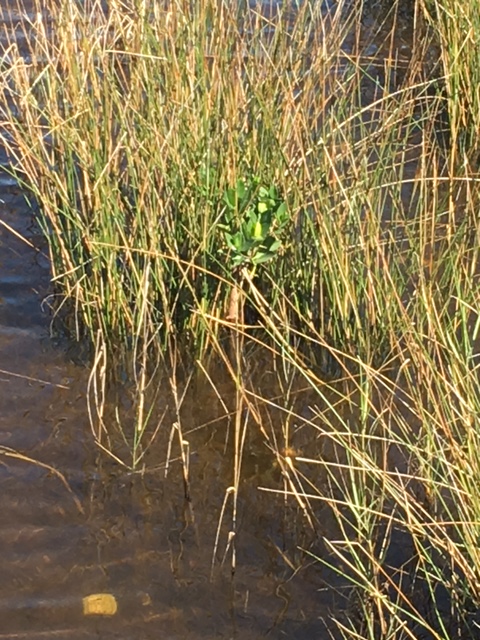
A young red mangrove growing near Pensacola FL.
Photo: Carrie Stevenson
Locally in the Pensacola area, there have been reports of mangroves growing in some estuaries. Mangroves are coastal salt tolerant trees that do not do well in colder temperatures. Historically, these plants dominated the estuarine coastlines of south Florida and Keys reaching as far north as Tampa Bay area along the Gulf coast, and Indian River area on the east. Over the last few decades there has been a migration of mangroves northward. They are now established in Cedar Key on the Gulf coast and reaching the Jacksonville area along the Atlantic. But even more interesting are the reports of small groups, or individuals of mangroves even further north into Georgia, and along the northern Gulf coast including Pensacola. Working with the Pensacola-Perdido Estuary Program, Sea Grant from Mississippi-Alabama and Florida, and NOAAs National Estuarine Research Reserves along the northern Gulf, we have been conducting annual surveys for these trees since 2019. Individual plants have been reported from the barrier islands of Mississippi, coastal inlets in Pensacola and Panama City, and numerous plants in the St. Joe Bay area. Black mangroves (Avicennia germinans) are more tolerant of cold than the other species of mangroves, and they have been found across the northern Gulf. What is interesting is that the red mangrove (Rhizophora mangle) has also been found. During the mangrove surveys we have conducted here in Pensacola Bay, the nine records we have were all red mangroves. These have not become established here, as a matter of fact all nine plants died during a hard freeze in 2018, but the fact that all reached a height of about 20 inches suggested that winter seasons are warm enough, for long enough, to allow them to grow for a period of time. One red mangrove growing within Big Sabine survived for almost 10 years, reaching a height of about a meter and developing prop roots, before the hard freeze of 2018 killed it. In addition to this survey project, others have reported the expansion of these plants into the northern Gulf2, 9.

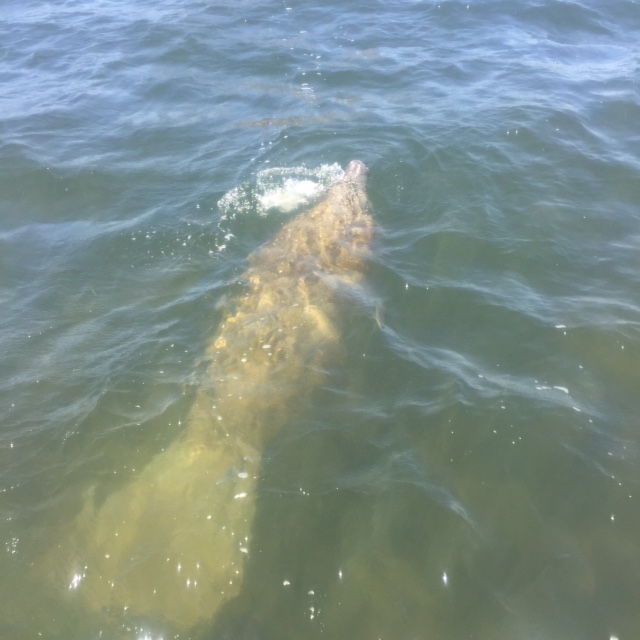
Manatee swimming in Big Lagoon near Pensacola.
Photo: Marsha Stanton
But mangroves are only one tropical species suggesting a climate shift. Manatees are animals that have historically migrated into the northern Gulf region over the years. Having lived in Pensacola all of my life, it was not unusual to hear about 1-2 sightings each year. Most were in the summer months but some were during the winter. They were often seen near the jetties at Ft. Pickens, near Palafox Pier downtown, and in Bayou Texar. However, in recent years the number of sightings seemed to be increasing. Some of citizen science volunteers were reporting them in Big Lagoon, and many times multiple individuals at one time, one report had nine individuals at the end of a private dock – which was unusual. In 2019 Sea Grant, working with Dauphin Island Sea Lab, decided to begin a tracking/reporting project to determine how frequent these encounters were. Dauphin Island Sea Lab had been conducting a “manatee watch” for almost 10 years at that time due to an increase in encounters in the Mobile Bay area. In 2019 we logged 66 records in the Pensacola Bay area. Based on time of day and location, we could determine that at least five of these were the same individuals reported by different people. Records came from the shoreline of the Gulf of Mexico, Santa Rosa Sound, Big Lagoon, NAS Pensacola, Tarkiln Bayou, Bayou Chico, Bayou Texar, and even up in Blackwater Bay near Bagdad. There were numerous manatees exploring all over the bay. This was different. The Manatee Watch program continues with a new reporting location on the Pensacola-Perdido Bay Estuary Program’s website – www.panhandlemanatee.org – and we continue to track this.

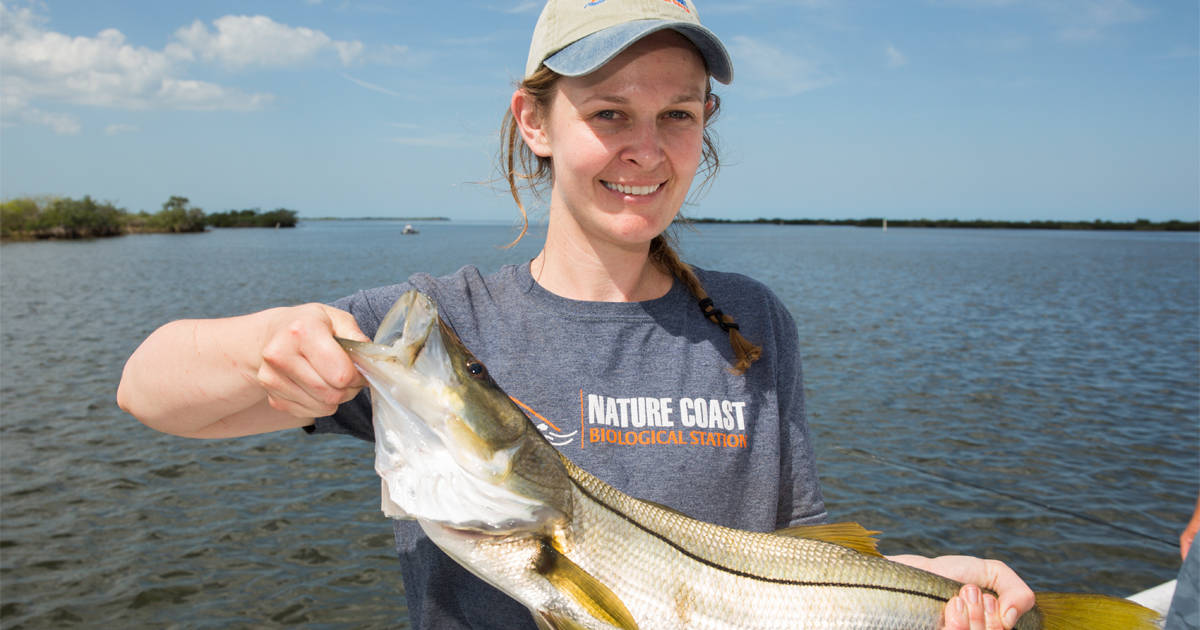
This snook was captured near Cedar Key. These tropical fish are becoming more common in the northern Gulf of Mexico.
Photo: UF IFAS
Now there are reports of snook (Centropomus undecimalis) and tarpon (Megalops atlanticus) roaming the northern Gulf. These are popular game fish found in south Florida associated with mangrove swamps and are a big draw for tourism in that part of the state. There have been reports of tarpon in the Pensacola Bay area for a number of years, but they seem to pass through seasonally and anglers reported that they would not strike any type of bait (live, dead, or artificial) thrown at them. However, in recent years there have been reports of anglers catching them.
Snook are more tropical and reports of them dispersing north are more recent. They are now reported in the Cedar Key area and enough to consider including them as a charter fishing target. Other reports from the Apalachicola area and even in Pensacola – Mobile Bay areas, suggest they are visiting us – albeit in small numbers.
But researchers have been following the “tropicalization” trend not only in the Gulf of Mexico but across the planet. Much of this is due to a reduction of the number of below freezing days during the winter period. One study showed that San Francisco CA has seen a reduction of sub-freezing days. Prior to 1980 most winters had sub-freezing days. In 1949 they had a total of 17 days below freezing. However, between 1981-2020 there were only 14 days below freezing, they have only had one since 1999, and have not had any since 20089. This same report looked at Tucson AZ, New Orleans LA, and Tampa FL. Tucson has experienced a slow warming over the century. New Orleans had relatively few sub-freezing days between 1940-1950, with an increase in freezing days between 1960-1980, and over the past 30 years a reduction in those freezing days. Between 1961-1990 there were 480 days below freezing. Since 1991 there have only been 165 days below freezing. The data from Tampa FL mimics what occurred in New Orleans9.
Along with the northern expansion of tropical species there has been a shift in the traditional “planting zones” used by agriculture and horticulturists. These are zones developed to let people know which plants will do best in your climate, and when to plant them. All of these zones are shifting north8.
And then there are coral reefs…
Long associated with the tropics, many species are now being found in the northern Gulf of Mexico and one scientific team predicts that as reefs continue to struggle with increasing water temperatures and ocean acidification, they will expand northward into the Big Bend region of Florida1.
Invasive Species
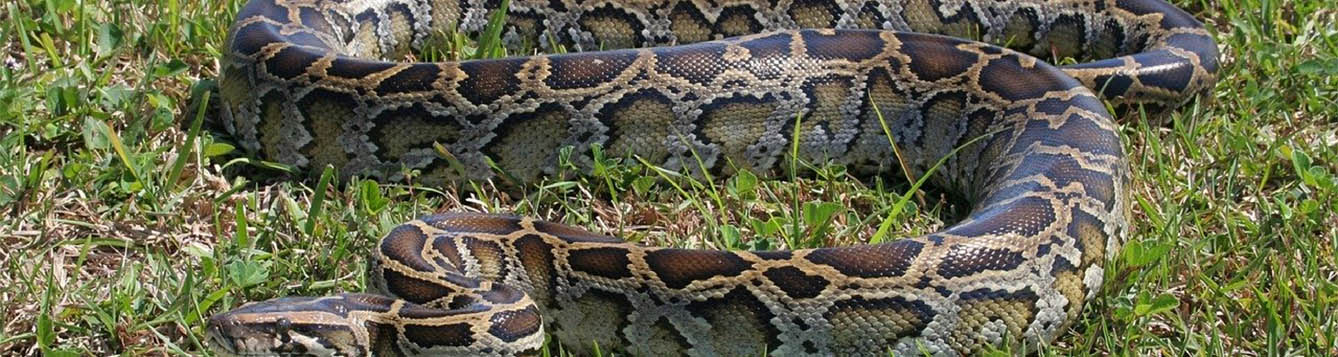
Everyone has heard of invasive species and are aware of the potential problems they can cause. With all of the media about Burmese Pythons, Brazilian Pepper, and Green Iguanas, it seems south Florida is under constant attack by these creatures. It’s understandable that Miami would be ground zero for such invasions. With the heavy international traffic and warm tropical climate creatures that are either intentionally, or accidentally, brought there and escape do well.

The Burmese python.
Photo: University of Florida
But most are not fond of the colder winters found in the northern Gulf of Mexico. Temperatures reaching, and sometimes exceeding, the freezing point are not unheard of. This has actually helped impede the dispersal of these tropical invasive species into the Florida panhandle.
That could be changing.
With over all milder winters we are seeing not only the tropicalization of the northern Gulf by native flora and fauna, but by non-native as well. Brazilian Pepper (Schinus terebinthifolius) has been reported on St. George Island near Apalachicola. The national database EDDMapS12 reports 18 records of the Cuban Treefrog (Osteopilus septentrionalis) in the Florida panhandle and there is reason to believe one population near Panama City may be breeding. There are 10 records of the Argentine Black and White Tegu (Salvator meriana) in the Florida panhandle and another 11 further north in the state of Georgia12.
A recent study looking at the cold tolerance of the Burmese Python (Python molurus) may be greater than we thought, that specific cold tolerant genes are becoming more common in the population, and the winters are getting milder9. All of this spells problems as these once south Florida issues begin to disperse northward.
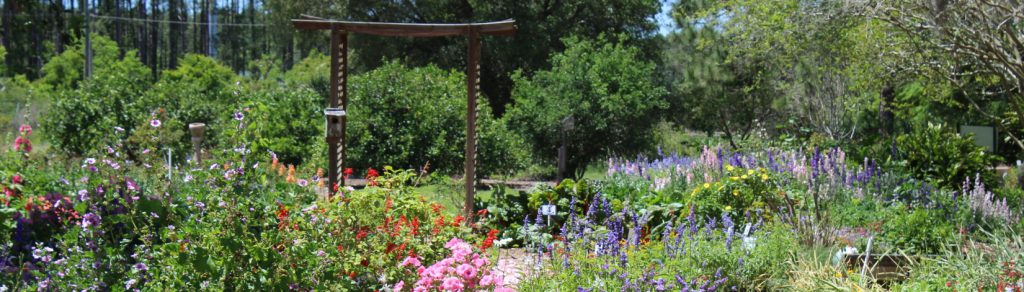
The types of plants and planting zones are moving northward.
Photo: UF IFAS
Growth Zones
Also, along the lines of tropicalization, is the northward movement of growth zones. These zones are commonly used by horticulturalists when recommending plants for certain geographic areas. For example, much of our area of the northern Gulf is in zone 8. Zone 9 (warmer climate) can be found in other portions of the northern Gulf and in peninsula Florida. There is evidence to suggest that these growth zones are migrating northward with latitude and altitude with the changing climate8. This will be important for those in the nursery and gardening industry as they select species for markets in different parts of the country. These changes will also impact what time of year people choose to plant.
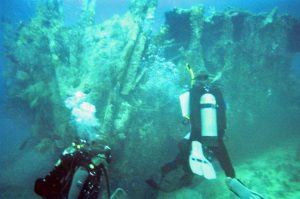
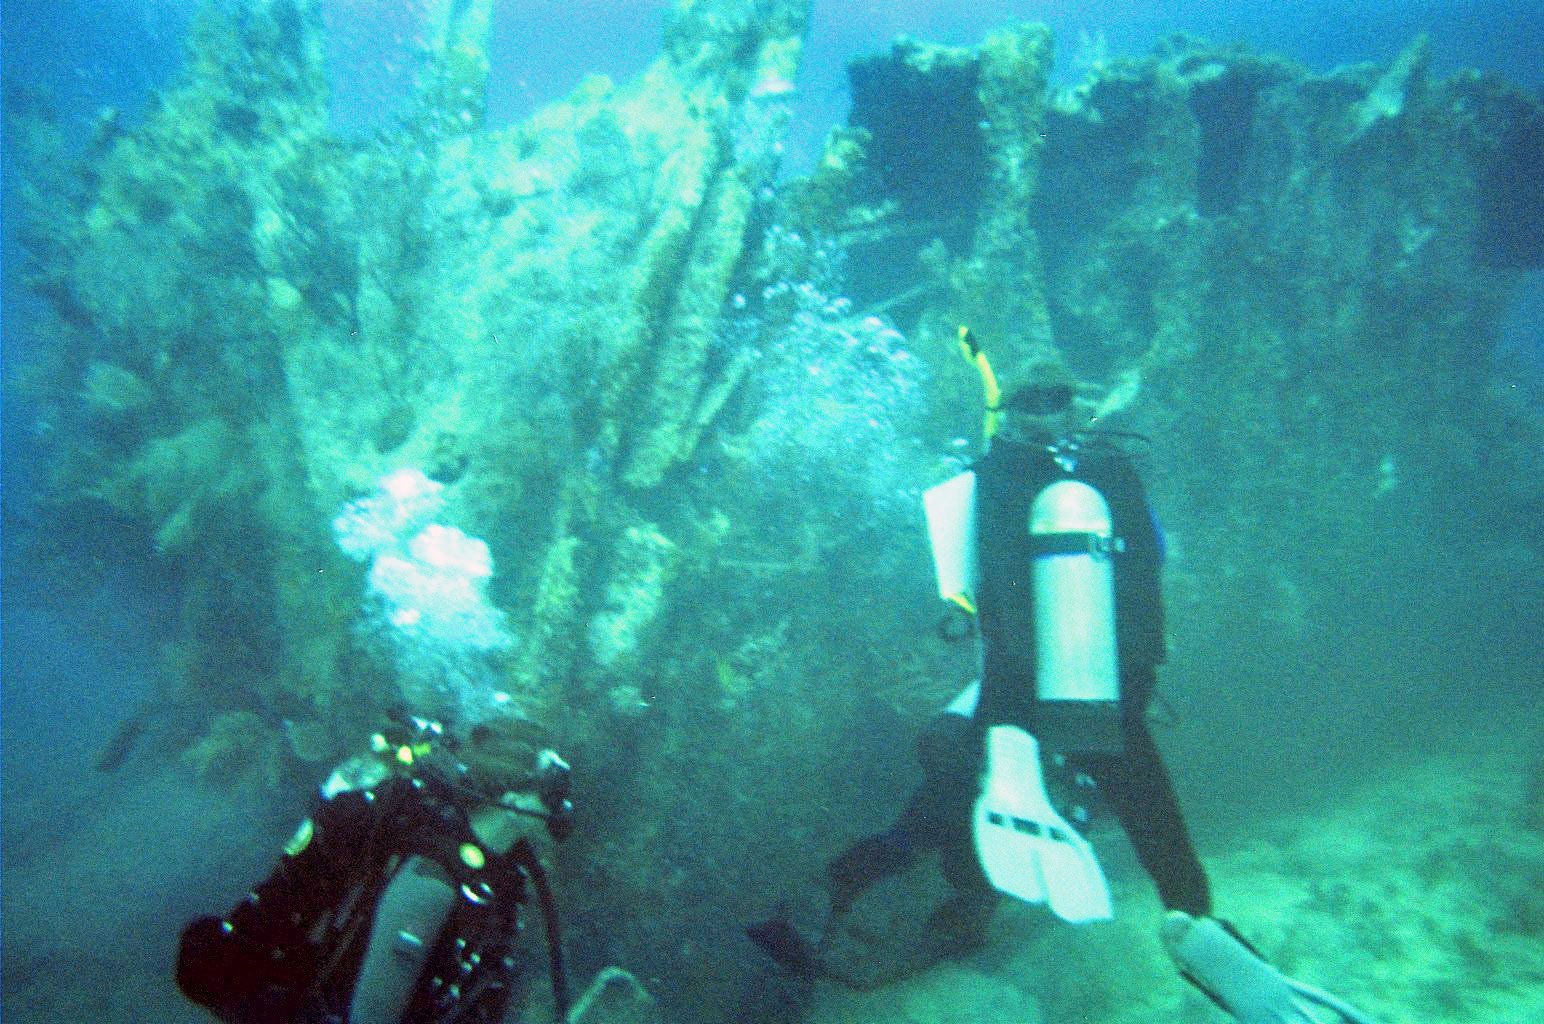
Coral reefs are struggling along the Florida Reef Track.
Photo: Indiana University
Corals, the Oceans, and Acidification – how have the oceans held up over the last decade?
For corals and ocean acidification, the answer is not so good.
NOAA reports that the oceans have absorbed enough CO2 to lower the pH by 0.1 – a 30% increase in acidity4. Mollusk shells, coral skeletons, etc. are made of calcium carbonate (CaCO3) which dissolves in acid. Obviously having a shell made of limestone (CaCO3) is not a good idea in an ocean that is becoming more acidic. The coral reef track has been dealing with life threatening diseases for many decades now. The increase ocean temperatures stress them, and the symbiotic microscopic plants known as zooxanthalle they rely on. This increase stress has made it easier for pathogens to attack them. There is currently a serious stony coral tissue disease spreading through the Florida reef tract that is also life threatening. The last decade has not been good for corals.
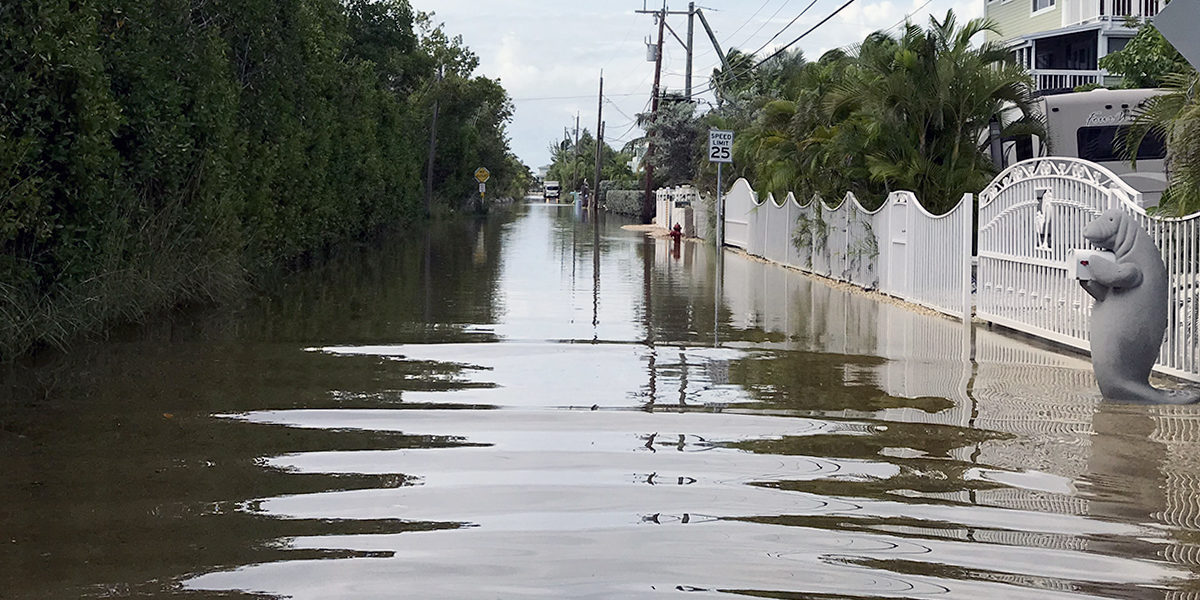
Sea Level Rise
Miami’s famous king tides…
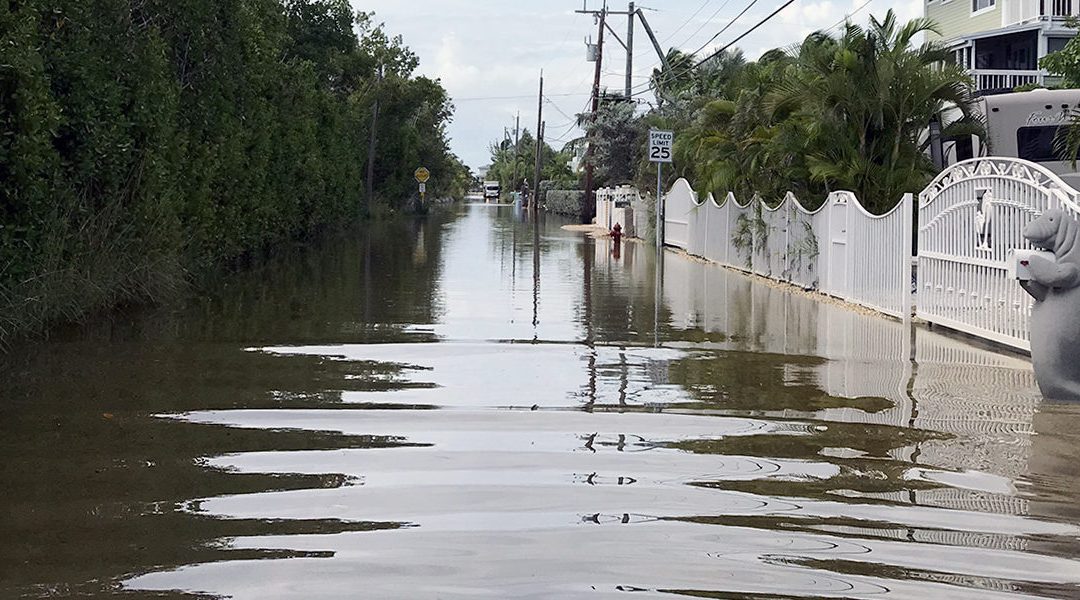
Sea level is rising everywhere but some locations seem to be having larger issues than others. One such location is Miami FL. High tide occurs there twice a day. Twice each month, when the moon-earth-sun are all aligned during the full and new moons, the tides are larger than normal – spring tides. During certain times of the year these tides are stronger still – king tides. King tides are now covering portions of A1A in downtown Miami. These are not storm events causing flooding, they are natural high tides, just reaching higher levels because sea level is higher.
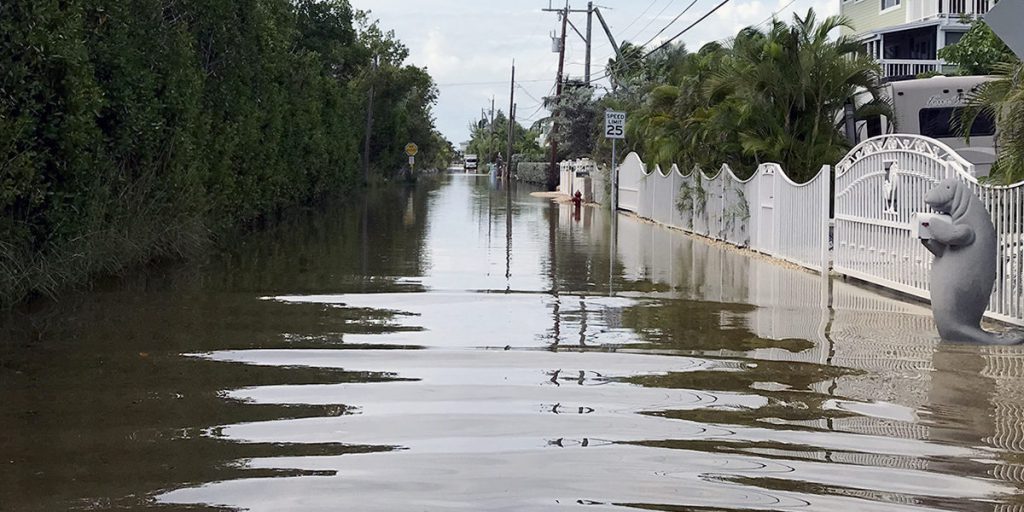
Flooding like you see along this street in Key Largo is becoming more frequent.
Photo: Florida Sea Grant
NASA reports that sea levels have risen eight inches over the past century and that the rate of that increase has doubled3. NOAA reports similar numbers and connects this rise to melting glaciers and expanding ocean volume due to warming. NOAA also connects the melting glaciers and expanding oceans to human activities since 19715, 7. In addition to Miami FL, there have been stories on impacts to London and Venice. Many coastal areas are beginning to see increased flooding due to both rising seas, sinking land, and increased rain events.
Data provided over the last decade do not suggest that the impacts of a changing climate have varied much from what the earlier climate models suggested. Some changes have occurred by impacts have not been noticed yet. More manatees and snook in the northern Gulf, growing/planting seasons shifting, mangroves moving north. Others have been impactful. Movement of invasive species, increased flooding, and the continued decline of our coral reefs. And we circle back to the original comment… “everyone is talking about the climate – but is anyone doing anything about it?”
In Part 3 we will review the recent report from the International Panel on Climate Change (IPCC) – Assessment Report #6 (AP6). What are the climate scientists saying about the current state of things and what are the models suggesting for the next decade.
References
1 Furman, B.T., B.J. Peterson, K.L. Heck Jr. 2020. Will the Florida Big Bend Area Become the Next Gulf of Mexico Reef Tract? Opinion Article. Frontiers in Marine Science. https://doi.org/10.3389/fmars.2020.00334.
2 Macy, A., S. Sharma, E. L. Sparks, J. Goff, K.L. Heck, M.W. Johnson, P. Harper, J. Cebrian. 2019. Tropicalization of the barrier islands of the northern Gulf of Mexico: A Comparison of herbivory and decomposition rates between smooth cordgrass (Spartina alternifloria) and black mangrove (Avicennia germinans). PLOS One. 14(1): e0210144. https://journals.plos.org/plosone/article?id=10.1371/journal.pone.0210144.
3 NASA. 2021. Global Climate Change: Vital Signs of the Planet. https://climate.nasa.gov/vital-signs/carbon-dioxide/.
4 NOAA. 2021. Climate.gov. Science and Information for a Climate Smart Nation. Climate Change and the 1991-2020 U.S. Climate Normals. https://www.climate.gov/news-features/understanding-climate/climate-change-and-1991-2020-us-climate-normals.
5 NOAA. 2021. Climate.gov. Science and Information for a Climate-Smart Nation. Carbon Emissions. https://www.climate.gov/news-features/understanding-climate/climate-change-atmospheric-carbon-dioxide.
6 NOAA. 2021. Climate.gov. Science and Information for a Climate Smart Nation. Sea Level Rise. https://www.climate.gov/news-features/understanding-climate/climate-change-global-sea-level.
7 NOAA. 2021. Geophysical Fluid Dynamics Laboratory. Global Warming and Hurricanes. https://www.gfdl.noaa.gov/global-warming-and-hurricanes/
8 NOAA. 2021. Geophysical Fluid Dynamics Laboratory. Historic Changes in Atlantic Hurricanes and Tropical Storms. https://www.gfdl.noaa.gov/historical-atlantic-hurricane-and-tropical-storm-records/
9 Osland, M.J., P.W. Stevens, M.M. Lamont, R.C. Brusca, K.M. Hart, J.H. Waddle, C.A. Langtimm, C.M. Williams, B.D. Keim, A.J. Terando, E. A. Reyier, K.E. Marshall, M.E. Loik, R.E. Boucek, A.B. Lewis, J.A. Seminoff. 2021. Tropicalization of Temperate Ecosystems in North America: The Northward Range Expansion of Tropical Organisms in Response to Warming Winter Temperatures. Global Change Biology. Wiley. DOI: 10.1111/gcb.1556.
10 Verges, A., C. Doropoulos, H.A. Malcom, M. Skye, M. Garcia-Piza. 2016. Long-Term Empirical Evidence of Ocean Warming Leading to Tropicalization of Fish Communities, Increased Herbivory, and Loss of Kelp. Proceedings of the National Academy of Sciences of the United States of Amercia. 113 (48) 13791-13796. https://doi.org/10.1073/pnas.1610725113.
11 Miller, G.T., S.E. Spoolman. 2011. Living in the Environment: Concepts, Connections, and Solutions. Brooks and Cole Publishing, Belmont CA. pp. 659.
12 Early Detection Distribution Mapping System (EDDMapS). 2021. https://www.eddmaps.org/.
by Rick O'Connor | Aug 30, 2021
Mark Twain once said – “Everyone talks about the weather, but no one does anything about it”. I guess you could say the same for climate.
The topic has been around for a while. As an undergrad science major in the late 1970s, we discussed what was then called “global warming”. It was explained to us that there were gases in our atmosphere that can cause what was called “the greenhouse effect”. Like the windows of a greenhouse, these gases allowed solar radiation to pass through to the surface of the planet but would not allow heated air to leave. Within the greenhouse it would get warmer.
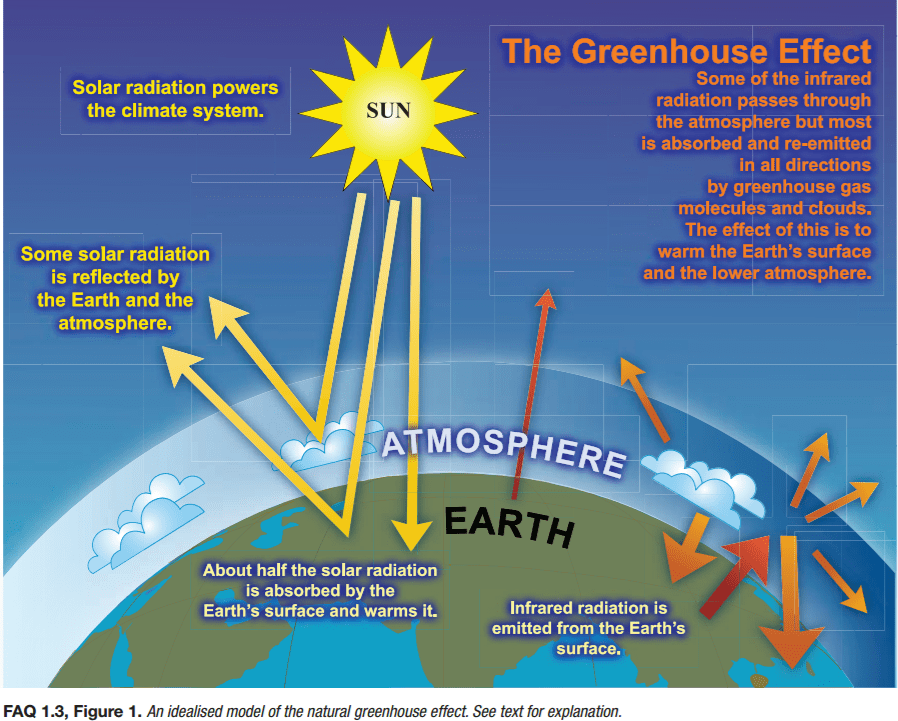
The greenhouse effect.
Image: NOAA
It was also explained to us that this was a natural part of the planet’s cycle. That without the “greenhouse effect” life on our planet could not exist. But it was also explained that the cycle worked like the thermostat in your home. Conditions on the planet increased the amount of greenhouse gas, which would in turn, increase the temperature of the planet. These warming conditions would enhance specific forms of life and their populations increased as well, land and sea. But like a thermostat at home, when the temperature reaches a certain point, the HAVC system shuts off and a cooling period happens within the house. The same happens on earth. Trees, and other forms of life, would increase in number during the warming periods but consume CO2 for photosynthesis and reduce the greenhouse effect leading to a cooling period. Other methods of greenhouse gas sequestration would occur as well. We know that the cooling periods could be quite significant – leading to ice ages. The species that sequestered the greenhouse gases would decline with the cooling periods allowing for an increase in those gases, and the cycle would begin again. And so it goes.
But was there any scientific evidence that such cycles actually exist?
Yes…
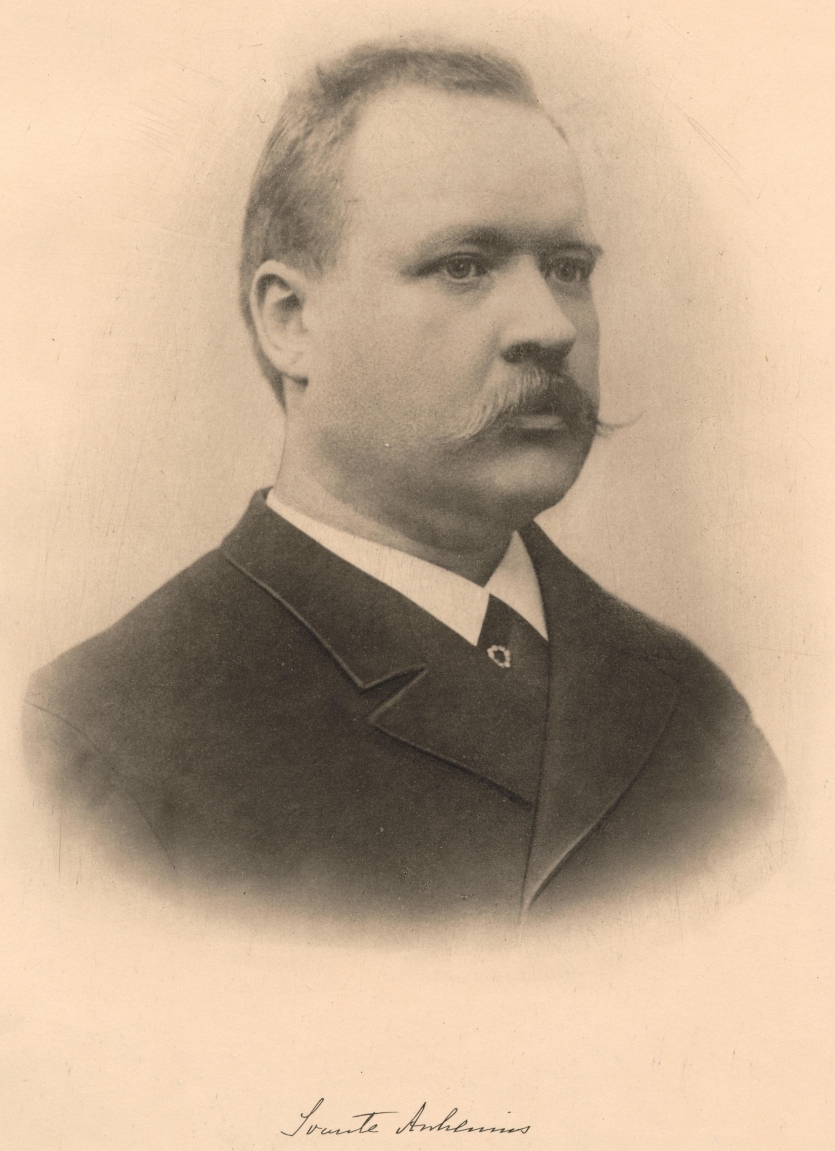
It is simple to construct an experiment within a closed system in a lab where you increase selected greenhouse gases to determine whether they actually increase temperatures within the systems. This has been numerous times by numerous scientific teams and the answer is yes… this happens. Science has been following this since 18961.
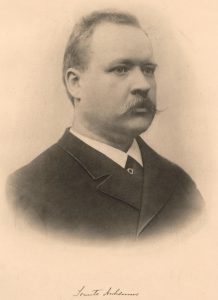
Svante Arrhenius, the Swedish chemist who first proposed how the greenhouse effect works in 1896.
Image: Science History Institute.
But is there evidence this occurs in the natural world, where there are more complex factors involved?
Yes…
Probably one of the more notable ones were gases trapped in ice cores removed from Arctic and Antarctic ice. Geology has understood for decades that material on our planet, rock and ice, are laid down over time. You can travel anywhere out west and see these layers of different rock layered over time. The idea is that the older material is laid down first and the newer material is near the top. But we also have evidence that the world is not a stagnant place. The earth’s surface shifts and changes constantly under the stresses of plate tectonics (another topic for another day). This shifting can cause older material on the bottom to shift in an upward position, placing it at – or above – newer material. So, geologists understand that it is not as simple as “older is on bottom” and great scrutiny and study must go into “reading” the rock layers. But reading those rock layers correctly can tell you a lot about how the earth has changed over time.

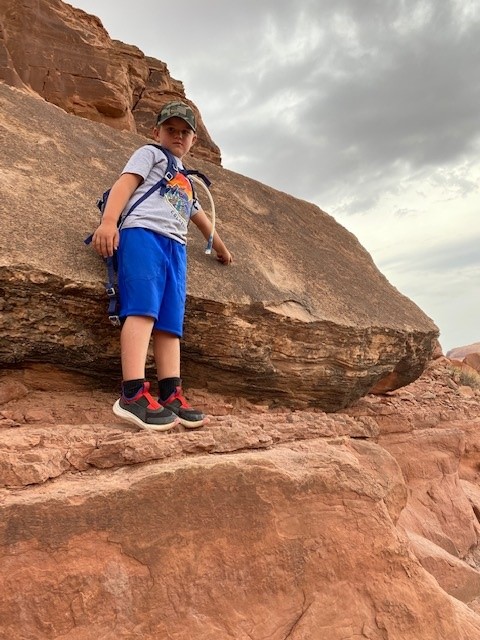
You can see the different layers of rocks as they have laid out over the history of the earth.
Photo: Rick O’Connor
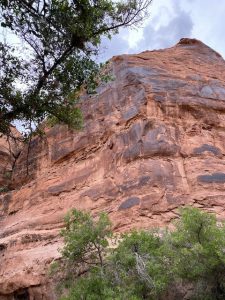
Notice the different layers within the rock face in Utah.
Photo: Rick O’Connor

This slab of rock shows the impression of a dinosaur foot. Notice how the slab has slid down the rock face into its current position.
Photo: Rick O’Connor
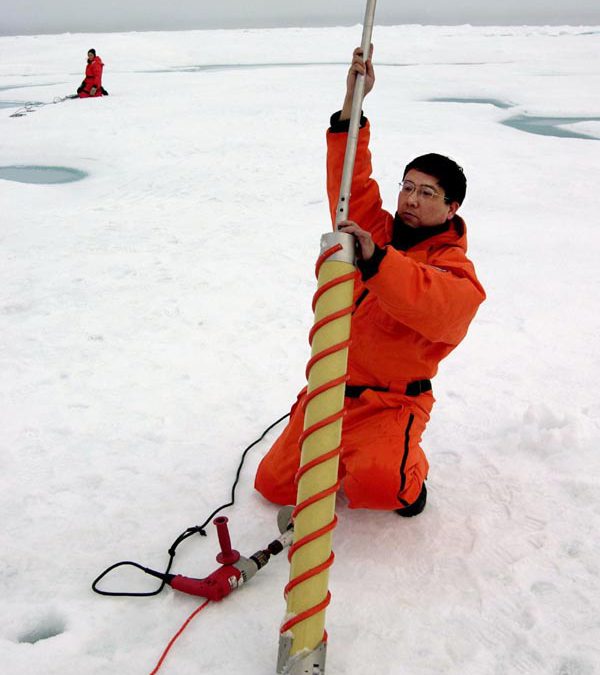
We know that when ice forms gas bubbles are trapped inside. You can take any ice cube today and see this. Using the same concept as “rock reading”, you can read layers of ice that are cored from the great ice sheets at the poles. Analyzing these gases, you can get an idea of the concentration of the greenhouse gases present at the time the ice formed. You can compare this to the fossilized plants and animals (even fossilized pollen) of those same periods and put together a map of the concentration of greenhouse gases, what the expected temperatures would have been based on those concentrations and compare this to the plants and animals that existed during that same time (were they warm or cold seasoned creatures). With this you could develop a map of the changing climate over time.
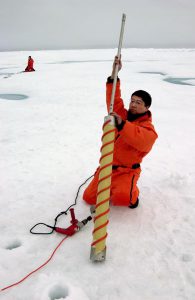
An ice core is being removed by a NOAA scientist.
Photo: NOAA
There is data going back over the last 900,000 years and yes… there are cool and warm periods found. One graph published by Miller and Spoolman (2011)1 shows average surface temperatures ranging from 9°C to 16°C (48°F to 61°F) over the last 900,000 years. The graph shows a basic “sine wave” of steady cooling and warming – a steady pattern – a cycle. Miller and Spoolman referred to these cycles as glacial and interglacial periods (freezing and thawing).
So, the lab and field evidence suggest we do live on a planet with ever changing climate. We are currently in a “thawing” period, and all is right with the world. But the data shows something else. Something that has climate scientists a bit concerned. Over the last 1000 years there has been a steady increase in surface temperatures, which was expected, but over the last 100 years there has been an unusual spike in increasing temperatures, something that have not seen in all of the data studied before. A rapid increase in surface temperature. What could be causing this unusual steep increase, and can the natural sequestering processes mitigate this rapid change?
This graph shows the changes in mean CO2 levels over the last 800,000 years. Notice the sharp increase in recent years.
Image: NOAA
If you examine a graph of temperature change over the last 1000 years you will notice the unusual spike beginning about the year 1900, 120 years ago. What could have happened to generate this spike?
Did the concentrations of greenhouse gases increase at the same rate during this time period?
Yes… they did.
What could have happened to cause this unusual increase in greenhouse gases and surface temperatures? And why has the natural sequestering process to cool the planets “thermostat” not kept up?
Back to the lab and to the field.
One event stands out… the industrialization of the planet. The industrial revolution began almost 300 years ago. We moved from burning wood as a source of energy to coal, and eventually oil. The burning of these fossil fuels significantly increases the same types of gases as the planet’s greenhouse gases (carbon dioxide CO2, methane CH4 and others). By the turn of the century (1900) the fossil fuel boom was in full swing. Industry and transportation were burning more and more of these fuels emitting more and more of the greenhouse gases that we know warm the planet up.

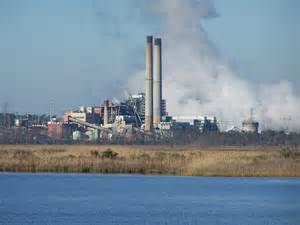
Power plant on one of the panhandle estuaries.
Photo: Flickr
But what about the sequestering processes of the forest and the oceans?
We began removing the forest. As the human population grows there is a need for more land for agriculture and homes/cities to live in. All across the planet deforestation was also in full swing, and agriculture/cities used fossil fuels as well. The change was on. Science has been able to determine that the carbon dioxide concentration has risen from 280 ppm at the beginning of the industrial revolution to 384 ppm in 20071. A study conducted by Field and Marland (2007) suggested that if the rate of CO2 increase at that time (3.3% annually) continued, it would reach 560 ppm by 2050 and 1390 ppm by 2100. This would have a significant impact on the climate which would in turn have a significant impact on the ecology and economics of our planet.
There was deep concern over this in the scientific community. They began developing computer models that could predict the changes in temperature with increased rates of greenhouse gases and how those could impact glacial melt, sea level rise, and atmospheric conditions that stimulate our weather. It is understood that models are only as good as the data you provide. We have learned this with hurricane models. There are numerous computer models that predict the landfall of hurricanes. The climatologist inputs what data they can get, and the model predicts where the storm will probably go – and at what intensity it will probably hit land with. These are the classic “spaghetti” models we are all familiar with on the evening weather. With hurricanes it is pretty easy to test your model. You input the data – predict landfall and intensity – and see what happens. You will get results very soon. You will notice on the evening weather that not all models make landfall at the same location. Some models are better than others. For those that were wrong, you go back and determine what information was not inputted, or inputted incorrectly, and “fix the model”. Because of this we feel very good about our hurricane models.

Hurricane forecasting has improved tremendously over the last decades.
Image: NOAA
But with climate, the results of the “landfall” will not happen in hours or days – it will be years or decades. So, as the models were developed in the early 1980s, no one knew for certain whether they were accurate or not.
But that did not stop climate scientists from developing them. There was much concern in what they thought might happen. Some studies suggested that the “tipping point” (the point of no return) for CO2 admissions was 450 ppm1. Their concern was CO2 at, or above, this value could have consequences that could be irreversible for long periods of time – for some, they may never recover. This means even if we brought CO2 emissions down to almost zero, we would still feel the effects for years – a lag effect, and some impacts may not be corrected. And CO2 is only one of the greenhouse gases – there were several others that needed to be watched and analyzed as well. This concerned many scientists as well. Was anyone paying attention?
Enter the IPCC…
In 1988 the United Nations and the World Meteorological Organization established the International Panel on Climate Change (IPCC). This panel consists of over 2500 climatologists from over 130 countries. Their 2007 report was based on more than 29,000 sets of data collected over that last decade. It was stated in this report that there was high probability (90-99%) that the lower atmosphere of the planet is warming and that human activities were responsible for most of this. They cited multiple layers of evidence to support this statement.
This report stated that a rise of 2°C (3.6°F) over 2005 temperatures is unavoidable, and an increase of 3°C (5.4°F) is likely during the next century. Their models suggested the possible outcomes of such climate change.
At a 2°C increase1
- Forest fires worsen
- Prolonged droughts become more intense
- Major heat waves become more common
- Conflicts over water supplies will increase
- Modest crop production increases in temperate regions
- Crop yields fall in tropical Africa
- Coral reefs will be impacted by bleaching
- Glaciers melt faster and impact water supplies for some
- Sea levels will rise and initiate coastal flooding issues
- Malaria will increase
- Arctic species will experience an increase in extinction
At a 3°C increase1
- Forest fires get worse
- Prolonged droughts get worse
- Deserts spread more
- Major heat waves will increase, and associated deaths with them
- Irrigation and hydroelectric power declines
- Water shortages for billions of people
- Water wars and terrorism increase
- Malaria and tropical disease will spread
- Crop pests will multiple
- Coral reefs severely threatened
- Arctic tundra will melt
- 20-30% of the species will face extinction
We discussed how many climate models need time to be tested. It was 30 years between the time I first heard about “global warming” and the publication of the 2007 IPPC report, and another 10 years since that report came out. Do any of the predictions in the list above look familiar? Could these models be on the right course, as we learned with hurricane models – could these be correct?
If so, “no one is doing anything about the weather” – but are we doing anything about the climate?
In the next edition – The Changing Climate: Part 2 – we will look what has happened since 2007. How have things changed in the last decade? Are things getting better?
Reference
1 Miller, G.T., S.E. Spoolman. 2011. Living in the Environment: Concepts, Connections, and Solutions. Brooks and Cole Publishing, Belmont CA. pp. 659.
by Carrie Stevenson | May 7, 2021

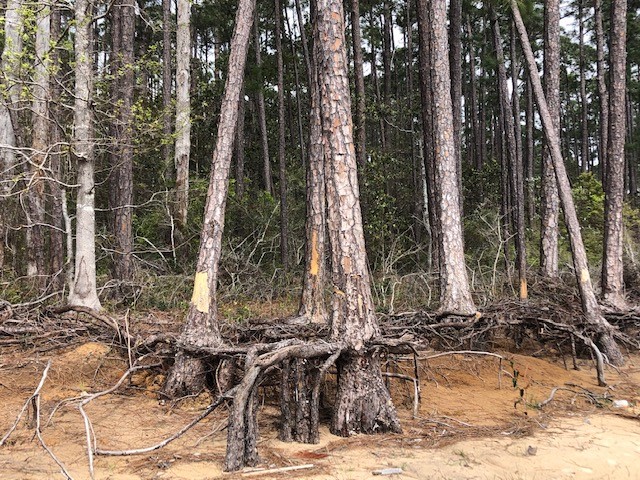
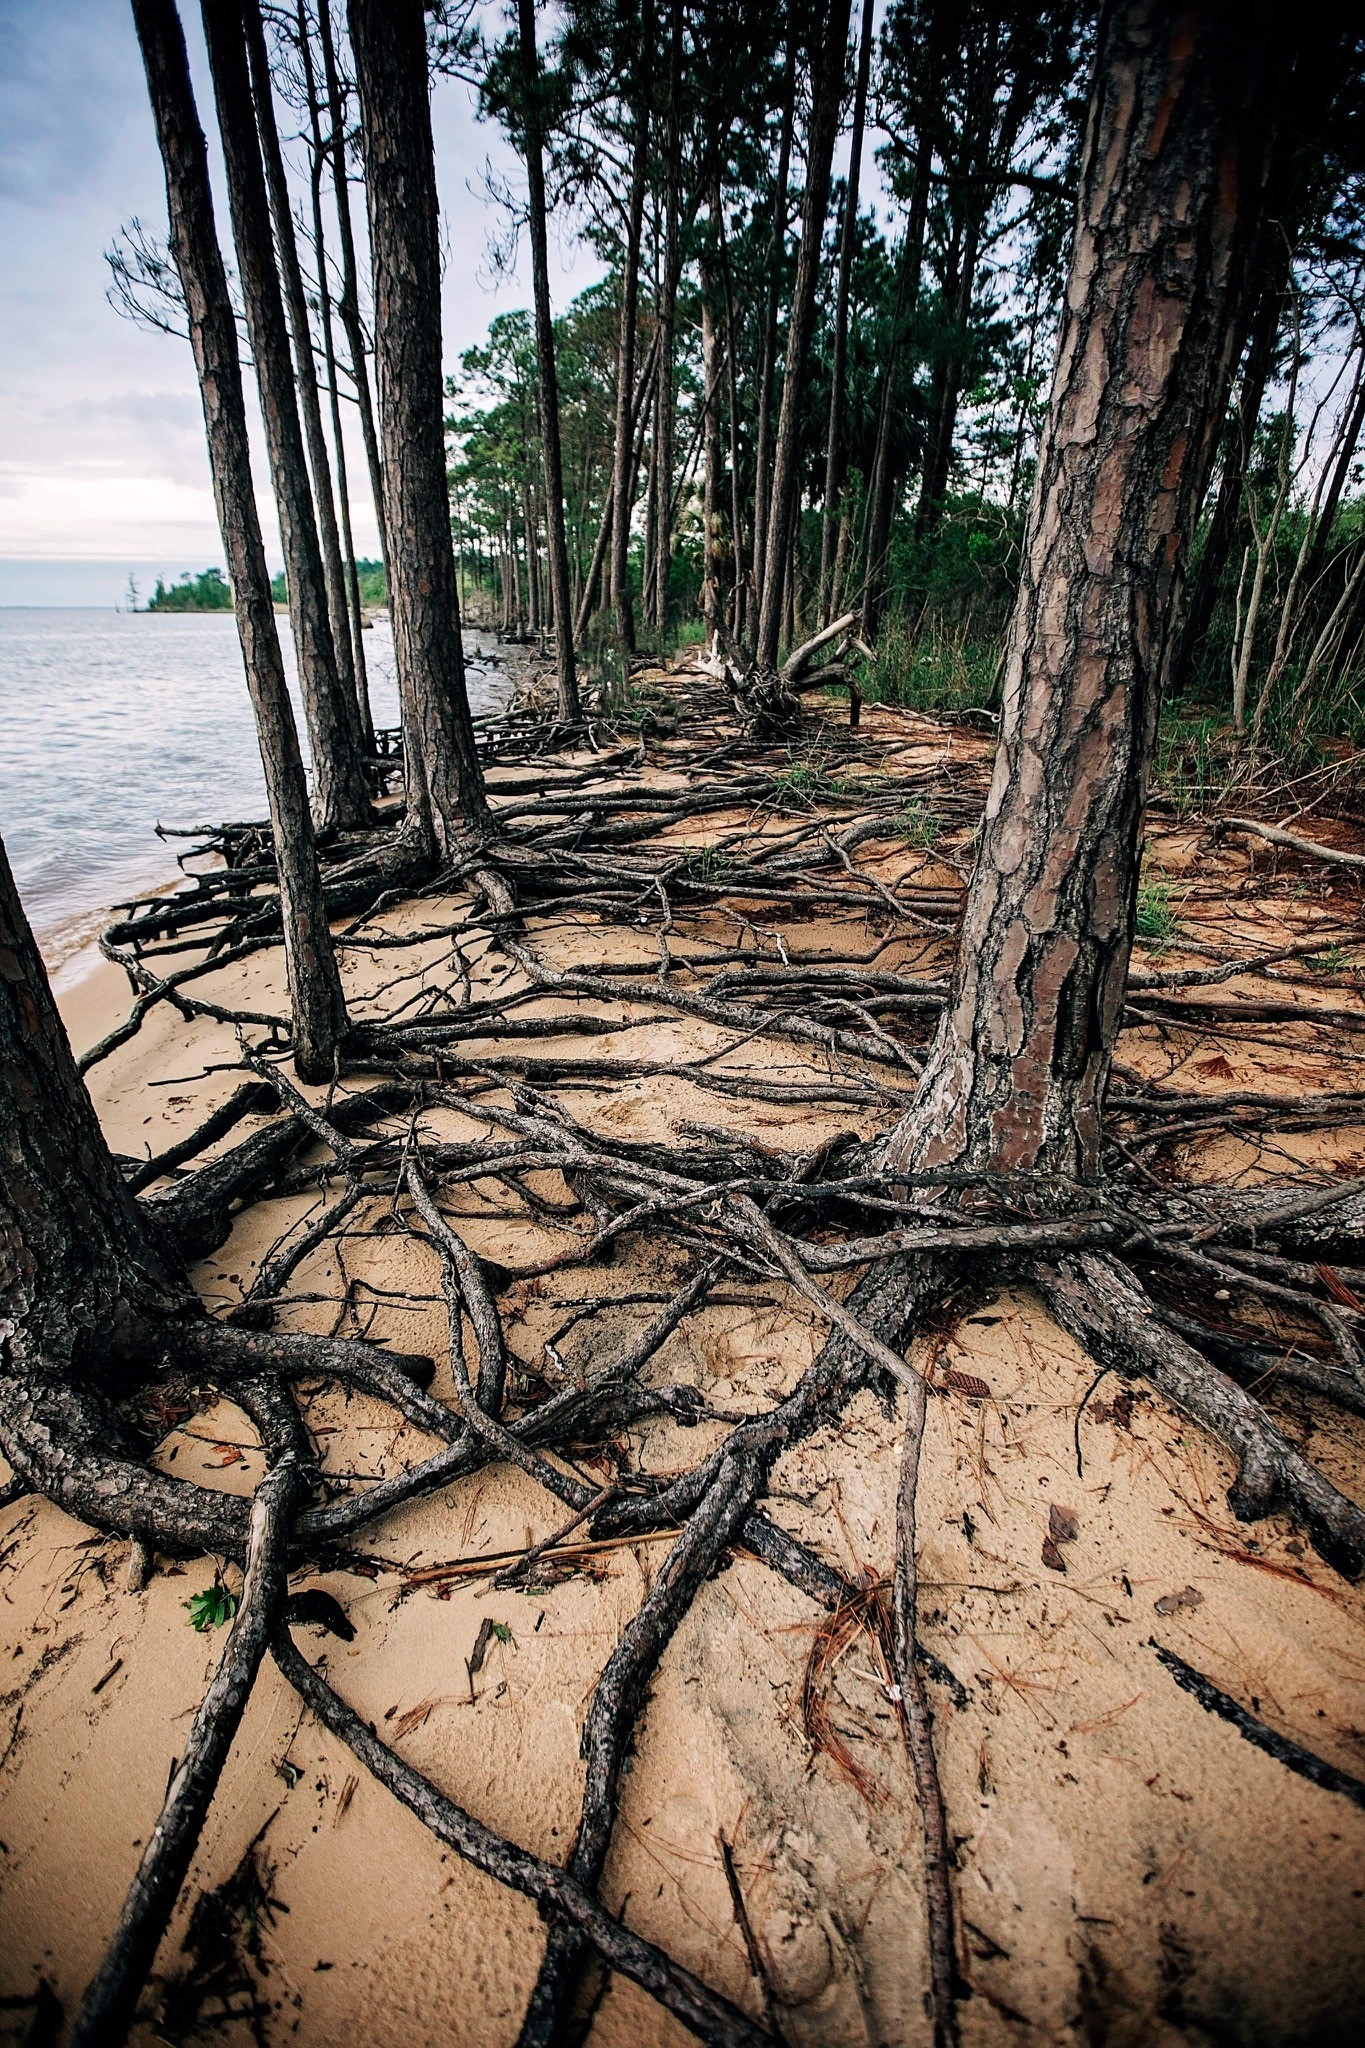
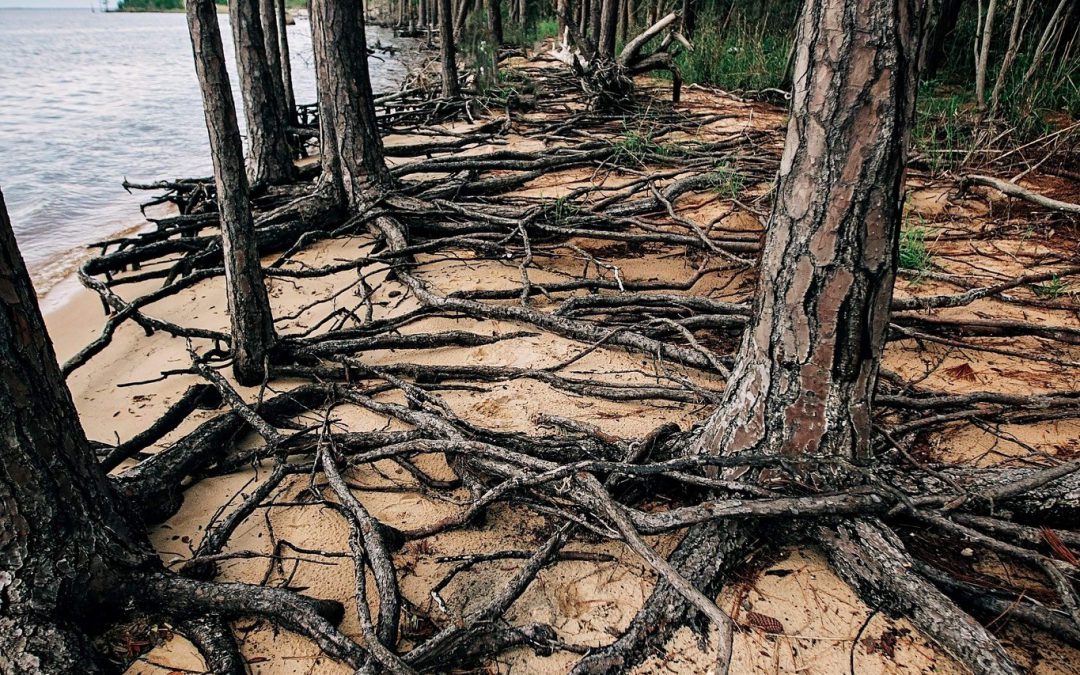
A ghost forest forming along the shoreline of Blackwater Bay in Santa Rosa County. Photo credit: Carrie Stevenson, UF IFAS Extension
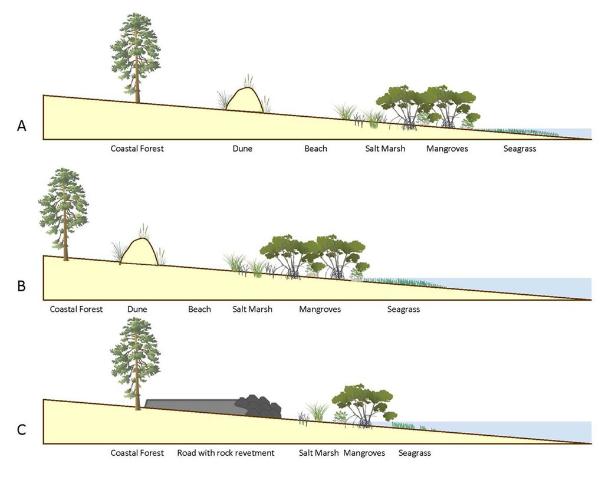
As the name implies, they are haunting—wide stretches of standing, dead trees with exposed roots. These “ghost forests” are an unsettling scene in unsettling times for the environment. While coastal erosion is a fact of life—incoming waves, hurricanes, longshore drift of beach sand—the rate of its occurrence is startling lately.
Global rises in sea level due to increased atmospheric carbon levels mean more saltwater is moving into flat, coastal habitats that once served as a buffer from the open water. Salt is an exceedingly difficult compound for plants to handle, and only a few species have evolved mechanisms for tolerating it. Low-growing salt marshes and thick mangrove stands have always served as “first line of defense” buffers to take in wave action and absorb saltwater. If shorelines have too much wave action for marshes to form, wide stretches of sandy beach and dunes serve the same function, protecting the inland species of shrubs and trees. Many coastal areas are flat and stay at or just above sea level for thousands of yards, or even miles. This means that even a small increase in sea level can send saltwater deep into previously freshwater systems, drowning the marsh and flooding stands of oak and pine. The salt and sulfate in seawater will kill a tree quickly, although it may remain standing, dead, for months or years. Hurricanes and tropical storms exacerbate that damage, scouring out chunks of shoreline and knocking down already-unstable trees.

This diagram outlines the changes in coastal vegetation and shorelines as sea level rises. With “ghost forests,” the sea level moves into that coastal forest section. Figure credit: W. Gray, IAN Image Library
A slow increase in sea level could be tolerated and adapted to as salt marshes move inland and replace non-salt tolerant species. But this process of ecological succession can be interrupted if erosion and increased water levels occur too quickly. And if there is hard infrastructure inland of the marshes (like roads or buildings), the system experiences “coastal squeeze,” winnowing the marsh to a thin, eventually nonexistent ribbon, with no natural protection for that expensive infrastructure.
Ghost forests are popping up everywhere. Earlier this month, Popular Mechanics magazine reported on a recently published study that used satellite imagery to document how 11% of a previously healthy forest was converted to standing dead trees along the coast of North Carolina. The trees died within a span of just 35 years (1984-2019). During that time frame, this stretch of coastline also experienced an extended drought and Category 3 Hurricane Irene. These impacts sped up the habitat loss, with over 19,000 hectares converted from forest to marsh and 1100 hectares of marsh vegetation gone, becoming open water.

Exposed roots of a ghost forest forming along the Escambia Bay. Photo credit: Deanie Sexton
Due to increased coastal flooding and saltwater standing in forested areas, U.S. Fish and Wildlife Service employees are concerned that the historic Harriett Tubman Byway in Maryland—part of the famed underground railroad of the Civil War era—will soon be gone. Over 5,000 acres of tidal marsh have converted to open water in the area and large stands of trees have died. Even locally, trees along Escambia and Blackwater Bay are dying due to salt damage and heavy erosion. Hurricane Sally delivered a knockout punch to many remaining trees along the scenic bluffs of the bay.
Sea level has risen over 10” in the past 100 years in the Pensacola Bay area, and even mid-range Army Corps of Engineers estimates expect 0.6 to 1.4 feet of rise in the area by 2045. There are some actions we can take to mitigate future damage. Building a “living shoreline” of vegetation along a piece of waterfront property instead of using a seawall can help, especially if the vegetation growth outpaces sea level rise. You can also visit the City of Pensacola’s Climate Task Force report to learn more about climate action recommended (and being taken) locally, such as increasing the use of renewable energy and dedicating staff to sustainability measures.
by Rick O'Connor | Nov 19, 2020
I think we can all agree it has been one crazy hurricane season. We have gone through the entire alphabet, and much of the Greek alphabet, naming storms – a record 30. Here in Pensacola we had Sally, but we had to prepare for many others that were wobbling around out there. It seemed this year the computer models were struggling predicting landfall locations. The “spaghetti” paths of the recent Eta were all over the Gulf. So, what is going on? It probably has to do with a warmer Gulf but there has to be more to it than that. Some have mentioned that it has been a La Nina year, and that the Gulf is more active during such years. Fair enough… what is the La Nina?
It is the opposite of the El Nino – a term more people have heard of. Okay… what is the El Nino?
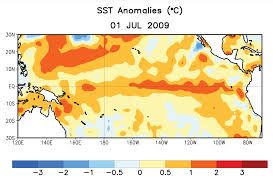
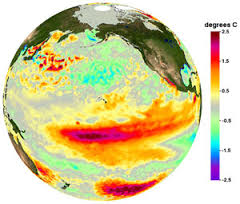
The red indicates warm water temperatures. Notice the warm temps in the eastern Pacific – not normal.
Graphic: NOAA
The El Nino is a warming trend observed in the eastern Pacific Ocean every 2-7 years around Christmas time. El Nino… “the child”. There are records of this event going back over a century. It was first noticed by Peruvian fishermen, who fish some of the most productive waters on the planet. These productive waters are fueled by the cold Humboldt Current and an upwelling bringing nutrient rich cold waters from the seafloor. When the El Nino occurs the Humboldt Current warms and “caps” the upwelling from reaching the surface where the food chain can benefit. The fish move away, and the fishermen notice it. When people began to colonize southern California, and began fishing for tuna and sardines, they noticed the same thing. The El Nino moved north of the equator just as it moves south of it.
To better understand this, we will need to know a little about the ocean currents.
The world rotates on its axis every 24 hours – there, we are off to a good start.
The sun’s rays hit the earth more directly in the equatorial part of the planet, making it warmer there.
The cold polar water is more dense and sinks. The warmer equatorial waters move across the surface of the ocean to fill the void left by the sinking polar water. But it does not move in a straight line to that point. The world is turning remember, and this cause the moving water to bend in a curved pattern. The equatorial water moves west by northwest, warming more as it moves. This is the equatorial current. When it reaches Indonesia it is a balmy 80F+ (or so). This is the land of palm trees and coral reefs – “Bali-Hai”.
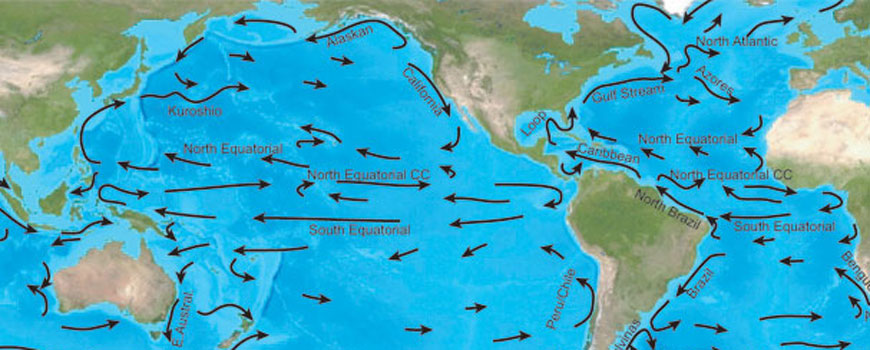
The equatorial currents of the Pacific.
Image: NOAA
The water now moves north towards Japan and Korea before heading towards Alaska. Here it is called the Kuroshio Current and here it slowly begins to lose its warmth. As it slides beneath Alaska heading for Canada it is called the North Pacific Current, and then becomes the California Current as it passes the western United States heading back towards the equator. Here the water is much cooler (60-70F). There are no coral reefs, but you do find palm trees in southern California. This coast is also bathed with an upwelling and supports a rich fishery.
The southern Pacific is the same – but the current names are different. The equatorial current heads west reaching Indonesia and heads south to Australia where they call it the East Australian Current (the EAC of Finding Nemo fame). This is the home of the Great Barrier Reef. The currents circle near Antarctica, become colder, and head north along South America as the Humboldt Current (also known as the Peru Current).
Now imagine this…
Imagine the warm equatorial water near Indonesia begins to slide back towards California and Central America. Imagine this warm water layer then heads north and south to the coasts of California and Peru. This warm water caps the upwelling and the fish leave – near Christmas time – the El Nino. Bad times for the fishing fleet.
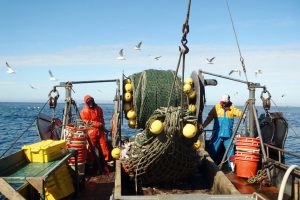
Commercial fishing in the California Current.
Photo: NOAA
The atmosphere responds to these ocean temperature shifts. Normally, the cooler waters reaching the equator from California and Peru move westward forming the equatorial current. This cool water helps form east winds that move across westward as well. Known as the Trade Winds, sailors have used them for centuries to reach “good trading locations”. They are steady and dependable… unless it is an El Nino year. During El Nino the warmer ocean slows the strength of these winds. They actually move eastward across Central America and impact the Gulf of Mexico. During El Nino years these eastward moving Pacific winds push hurricanes out of the Gulf into the Atlantic. These are the hurricane seasons when Bermuda is hit frequently.
La Nina is the opposite. The Pacific waters moving into the equatorial area from California and Peru are colder than normal. These colder waters move faster and farther across the equatorial waters of the Pacific increasing the Trade Winds moving west… not east. With these Trade Winds moving in the direction they should, even stronger than normal, hurricanes are “sucked” into the Gulf of Mexico. La Nina seasons are very busy hurricane seasons for us. And you guessed it, it is a La Nina year. La Nina usually follows the El Nino and we can sometimes experience them for two seasons, but 12 months is typical.
The thing is La Nina’s have been occurring for centuries. We have certainly had hurricane seasons that were busier than normal but not to the extent we saw this year. You have to look at climate change in general, and other atmospheric conditions that could influence this. I am sure the meteorologists and climatologists are as interested in what happened (is happening) this year as we are.
Hopefully we will not see another season like this for some time.
Happy Thanksgiving.
by Andrea Albertin | Oct 9, 2020
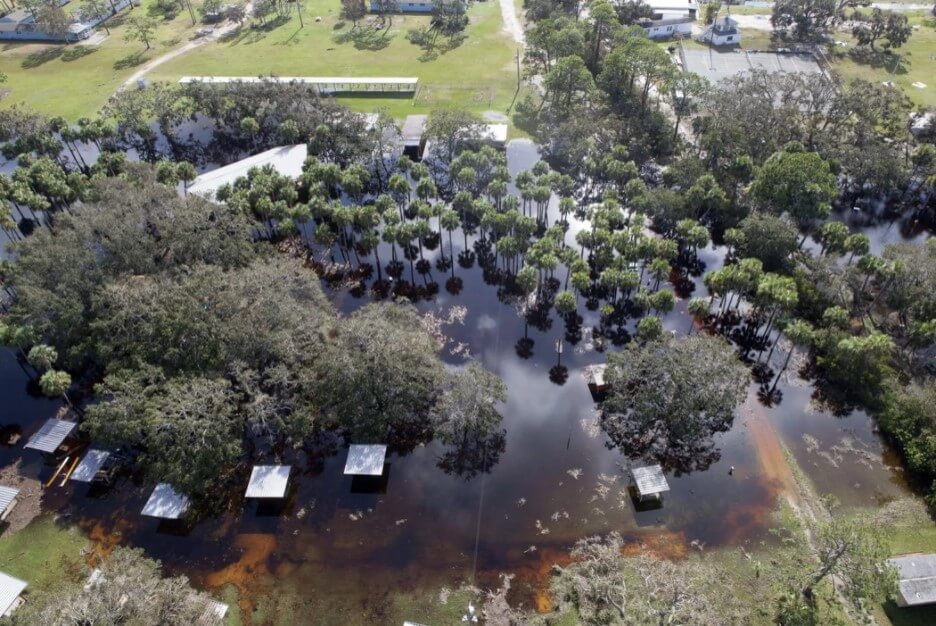
Special care needs to be taken with your septic system after flooding. Image: B. White NASA. Public Domain
During and after floods or heavy rains, the soil in your septic system drainfield can become waterlogged. For your septic system to treat wastewater, water needs to drain freely in the drainfield. Special care needs to be taken with your septic system under flood conditions.
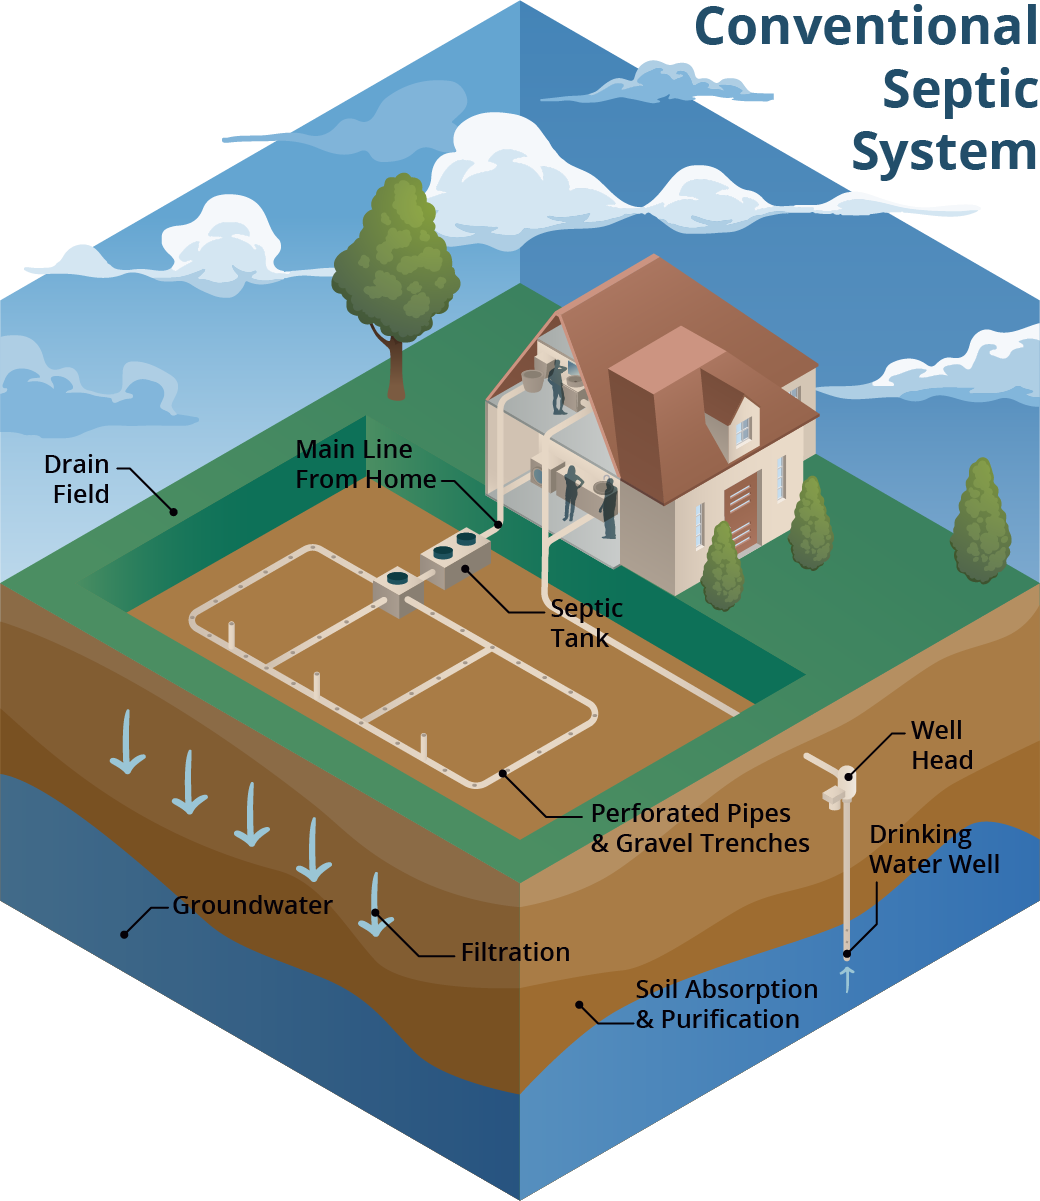
A conventional septic system is made up of a septic tank (a watertight container buried in the gound) and a drainfield. Image: Soil and Water Science Lab UF/IFAS GREC.
A conventional septic system is made up of a septic tank and a drainfield or leach field. Wastewater flows from the septic tank into the drainfield, which is typically made up of a distribution box (to ensure the wastewater is distributed evenly) and a series of trenches or a single bed with perforated PVC pipes. Wastewater seeps from these pipes into the surrounding soil. Most wastewater treatment occurs in the drainfield soil. When working properly, many contaminants, like harmful bacteria, are removed through die-off, filtering and interaction with soil surfaces.
What should you do if flooding occurs?
The U.S. Environmental Protection Agency (EPA) offers these guidelines:
- Relieve pressure on the septic system by using it less or not at all until floodwaters recede and the soil has drained. Under flooded conditions, wastewater can’t drain in the drainfield and can back up in your septic system and household drains. Clean up floodwater in the house without dumping it into the sinks or toilet. This adds additional water that an already saturated drainfield won’t be able to process. Remember that in most homes all water sent down the pipes goes into the septic system.
- Avoid digging around the septic tank and drainfield while the soil is waterlogged. Don’t drive vehicles or equipment over the drainfield. Saturated soil is very susceptible to compaction. By working on your septic system while the soil is still wet, you can compact the soil in your drainfield, and water won’t be able to drain properly. This reduces the drainfield’s ability to treat wastewater and leads to system failure.
- Don’t open or pump the septic tank if the soil is waterlogged. Silt and mud can get into the tank if it is opened and can end up in the drainfield, reducing its drainage capability. Pumping under these conditions can cause a tank to float or ‘pop out’ of the ground, and can damage inlet and outlet pipes.
- If you suspect your system has been damaged, have the tank inspected and serviced by a professional. How can you tell if your system is damaged? Signs include: settling, wastewater backs up into household drains, the soil in the drainfield remains soggy and never fully drains, a foul odor persists around the tank and drainfield.
- Keep rainwater drainage systems away from the septic drainfield. As a preventive measure, make sure that water from roof gutters doesn’t drain towards or into your septic drainfield. This adds an additional source of water that the drainfield has to process.
- Have your private well water tested if your septic system or well were flooded or damaged in any way. Your well water may not be safe to drink or use for household purposes (making ice, cooking, brushing teeth or bathing). You need to have it tested by the Health Department or other certified laboratory for total coliform bacteria and coli to ensure it is safe to use.
For more information on septic system maintenance after flooding, go to:
More information on having your well water tested can be found at:
More Information on conventional and advanced treatment septic systems can be found on the UF/IFAS Septic System website