This fish is a classic example of why scientists use scientific names. There are numerous common names for this species and multiple ones even in the Gulf region. Ling, Cabio, Lemonfish, Cubby Yew, Black kingfish, Black salmon, Crabeater, and Sergeant fish to name a few. The Cajun name for the fish is Limon – possibly where the name Lemonfish came from. Based on the references, Cobia seems to be the most accepted name, but Ling is often used here along the Florida panhandle. Again, this is a great example of why scientists use scientific names when writing or speaking about species. There is less chance for confusion. I say less because at times the scientific names change as well, and some confusion can still occur.
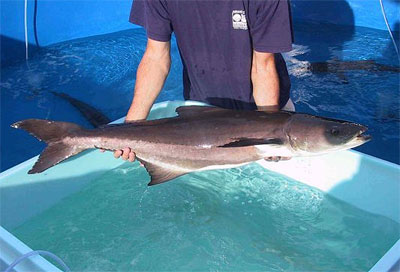
The Cobia
Photo: NOAA
The scientific name for this fish is Rachycentron canadum. The genus name refers to the sharp spines of the first dorsal fin, which are sharp. The species name may refer to Canada. It is a common practice to give a species the name of the area/location in which it was first described. But it seems that Carlos Linnaeus, the biologist who first described it, used a specimen from the Carolinas to do so. So, not sure why the name was given4. It is the only North American fish in the family Rachycentridae and its closest relative are the remoras of the shark sucker family.
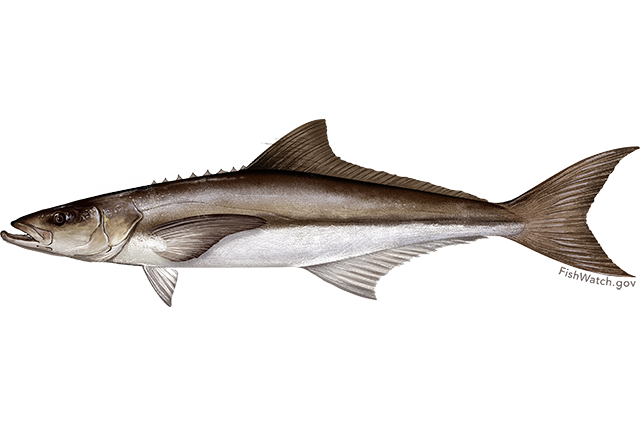
Some state that cobia have only one dorsal fin, but in fact they have two. The first is a series of 7-9 spines spaced with no membrane connecting. They are small, sharp, and somewhat embedded into the body. This is very similar to how the remoras and shark suckers first dorsal spines work, albeit remora’s first dorsal is softer. Cobia have a low depressed head that gives them the appearance of a shark when viewed from the side. It is often confused with sharks because they can get quite large – an average of five feet in length and up to 100 pounds in weight. The small juveniles resemble remora quite a bit. They are darker in color with pronounced lighter colored lateral stripes and their caudal fin (tail) is more lancelet and less lunate than the adults.
Biogeographically they are listed as worldwide, albeit tropical to subtropical – they do not like cold water. In the United States they are found all along the east and Gulf coast, but are absent from the west coast – again, a dislike for cold water. The literature states that there are two population stocks of cobia here. The Atlantic group and the Gulf of Mexico group all head south towards the Florida Keys for winter. However, breeding appears to take place in the northern parts of their range and so no genetics are exchanged while the two groups co-exist in the Keys. If this is the case, and it seems to be, there is a reproductive barrier, or behavioral barrier, that could, over time, isolate these two groups long enough that the gene pools could become different enough that attempts to breed between the groups would not produce viable offspring. If this were the case then they could be listed as subspecies, possibly the Atlantic and Gulf Cobia. But this has not happened. There are also studies that suggest in the Gulf there may be isolated groups. One comment is that there are cobia along Florida’s Gulf coast that migrate inshore and offshore but do not make the run to the Keys and back4. There are also studies that show a similar behavior with a group over near Texas. Obviously, there is a lot of work to be done on the movement and genetics of these possible subgroups to completely understand the biogeography of this animal. And don’t forget, there are cobia along the European/African coast of the Atlantic as well as the Indian and western Pacific.
Cobia resemble both shark suckers and sharks.
Photo: University of Florida
But migrate they do. The “Ling Run”, as it known in the Pensacola area, is something many anglers wait for early in the year. We even have some local bait and tackle shops monitoring water temperature to announce when the run will begin. When water temperatures warm to 67°F it is time. Local anglers flock the Gulf side piers and head out on their boats with high ling towers to search for them. At the beginning of the ling run I have seen the inshore Gulf of Mexico littered with hundreds of boats covering the surface like small dots as far as you can see. One boat I remember was about 20 feet long and had precariously placed a large step ladder in the center as a “ling tower”. The angler was perched at the top of the ladder, holding on in the chop, searching the waters for his target.
Cobia will travel alone or in groups of up to 100 and are often attracted to objects in the water. Flotsam like Sargassum weed, or marine debris are places that anglers focus on. They are known to shadow sharks, manta rays, and sea turtles. I know anglers when they see a sea turtle begin throwing bait in that direction in hopes that a cobia is nearby. To the west of us in Alabama they seem to visit the offshore gas rigs and are attracted to the fishing piers many communities have extending into the Gulf – hence the large crowds of non-boating anglers visiting them during the run. Many anglers are known to drop FADs (Fish Attracting Devices) into the water to attract cobia, though these are not allowed during cobia/ling tournaments – which also pop up across the panhandle during the run.
Despite this apparent heavy fishing pressure, it is considered a sustainable fishery. Cobia mature at an early age, 2 years for males and 3 for females – and they live for about 12 years. They mass spawn in the northern waters. A typical season will find females breeding 15-20 times and producing 400,000 – 2,000,000 per spawn event. There is no evidence that this fishery is overfished, and there is commercial fishery for them as well. Due to their quick growth rates, large size, and high-quality flesh, there is interest in offshore aquaculture of this species.
It is an amazing fish. One of the best fish sandwiches I have ever had was a fresh ling sandwich. It is also a very interesting species from a biographical point. Enjoy the next “Ling Run” along the panhandle – or “cobia run”, or “lemonfish run”, which ever you wish to call it.
One of the programs I focus on as a Sea Grant Extension Agent in Escambia County is restoring the health of our estuary. One of the projects in that program is increasing the encounters with estuarine animals that were once common. Currently I am focused on horseshoe crabs, diamondback terrapins, and bay scallops. Horseshoe crabs and bay scallops were more common here 50 years ago. We are not sure how common diamondback terrapins were. We know they were once very common near Dauphin Island and are often found in the Big Bend area, but along the emerald coast we are not sure. That said, we would like to see all of them encountered more often.
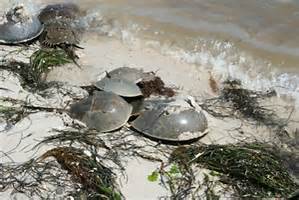
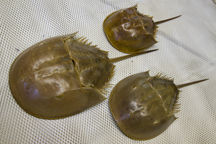
Horseshoe crabs breeding on the beach. Photo: Florida Sea Grant
There are a variety of reasons why species decline in numbers, but habitat loss is one of the most common. Water quality declined significantly 50 years ago and certainly played a role in the decline of suitable habitat. The loss of seagrass certainly played a role in the decline of bay scallops, but overharvesting was an issue as well. In the Big Bend region to our east, horseshoe crabs are also common in seagrass beds and the decline of that habitat locally may have played a role in the decline of that animal in our bay system.
Salt marshes are what terrapins prefer. We have lost a lot of marsh due to coastal development. Unfortunately, marshes often exist where we would like houses, marinas, and restaurants. If the decline of these creatures in our bay is a sign of the declining health of the system, their return could be a sign that things are getting better.
Seagrass beds have declined over the last half century. Photo: Rick O’Connor
Salt marshes have declined due to impacts from coastal development. Photo: Molly O’Connor
For over 10 years we have been conducting citizen science monitoring programs to monitor the frequency of encounters of these creatures. All three are here but the increase in encounters has been slow. An interesting note was the fact that many locals had not heard of two of them. Very few knew what a horseshoe crab was when I began this project and even fewer had heard of a terrapin. Scallops are well known from the frequent trips locals make to the Big Bend area to harvest them (the only place in the state where it is legal to do so), but many of those were not aware that they were once harvested here.
I am encouraged when locals send me photos of either horseshoe crabs or their molts. It gives me hope that the animal is on the increase. Our citizen science project focuses on locating their nesting beaches, which we have not found yet, but it is still encouraging.
Volunteers surveying terrapin nesting beaches do find the turtles and most often sign that they have been nesting. The 2022 nesting season was particularly busy and, again, a good sign.
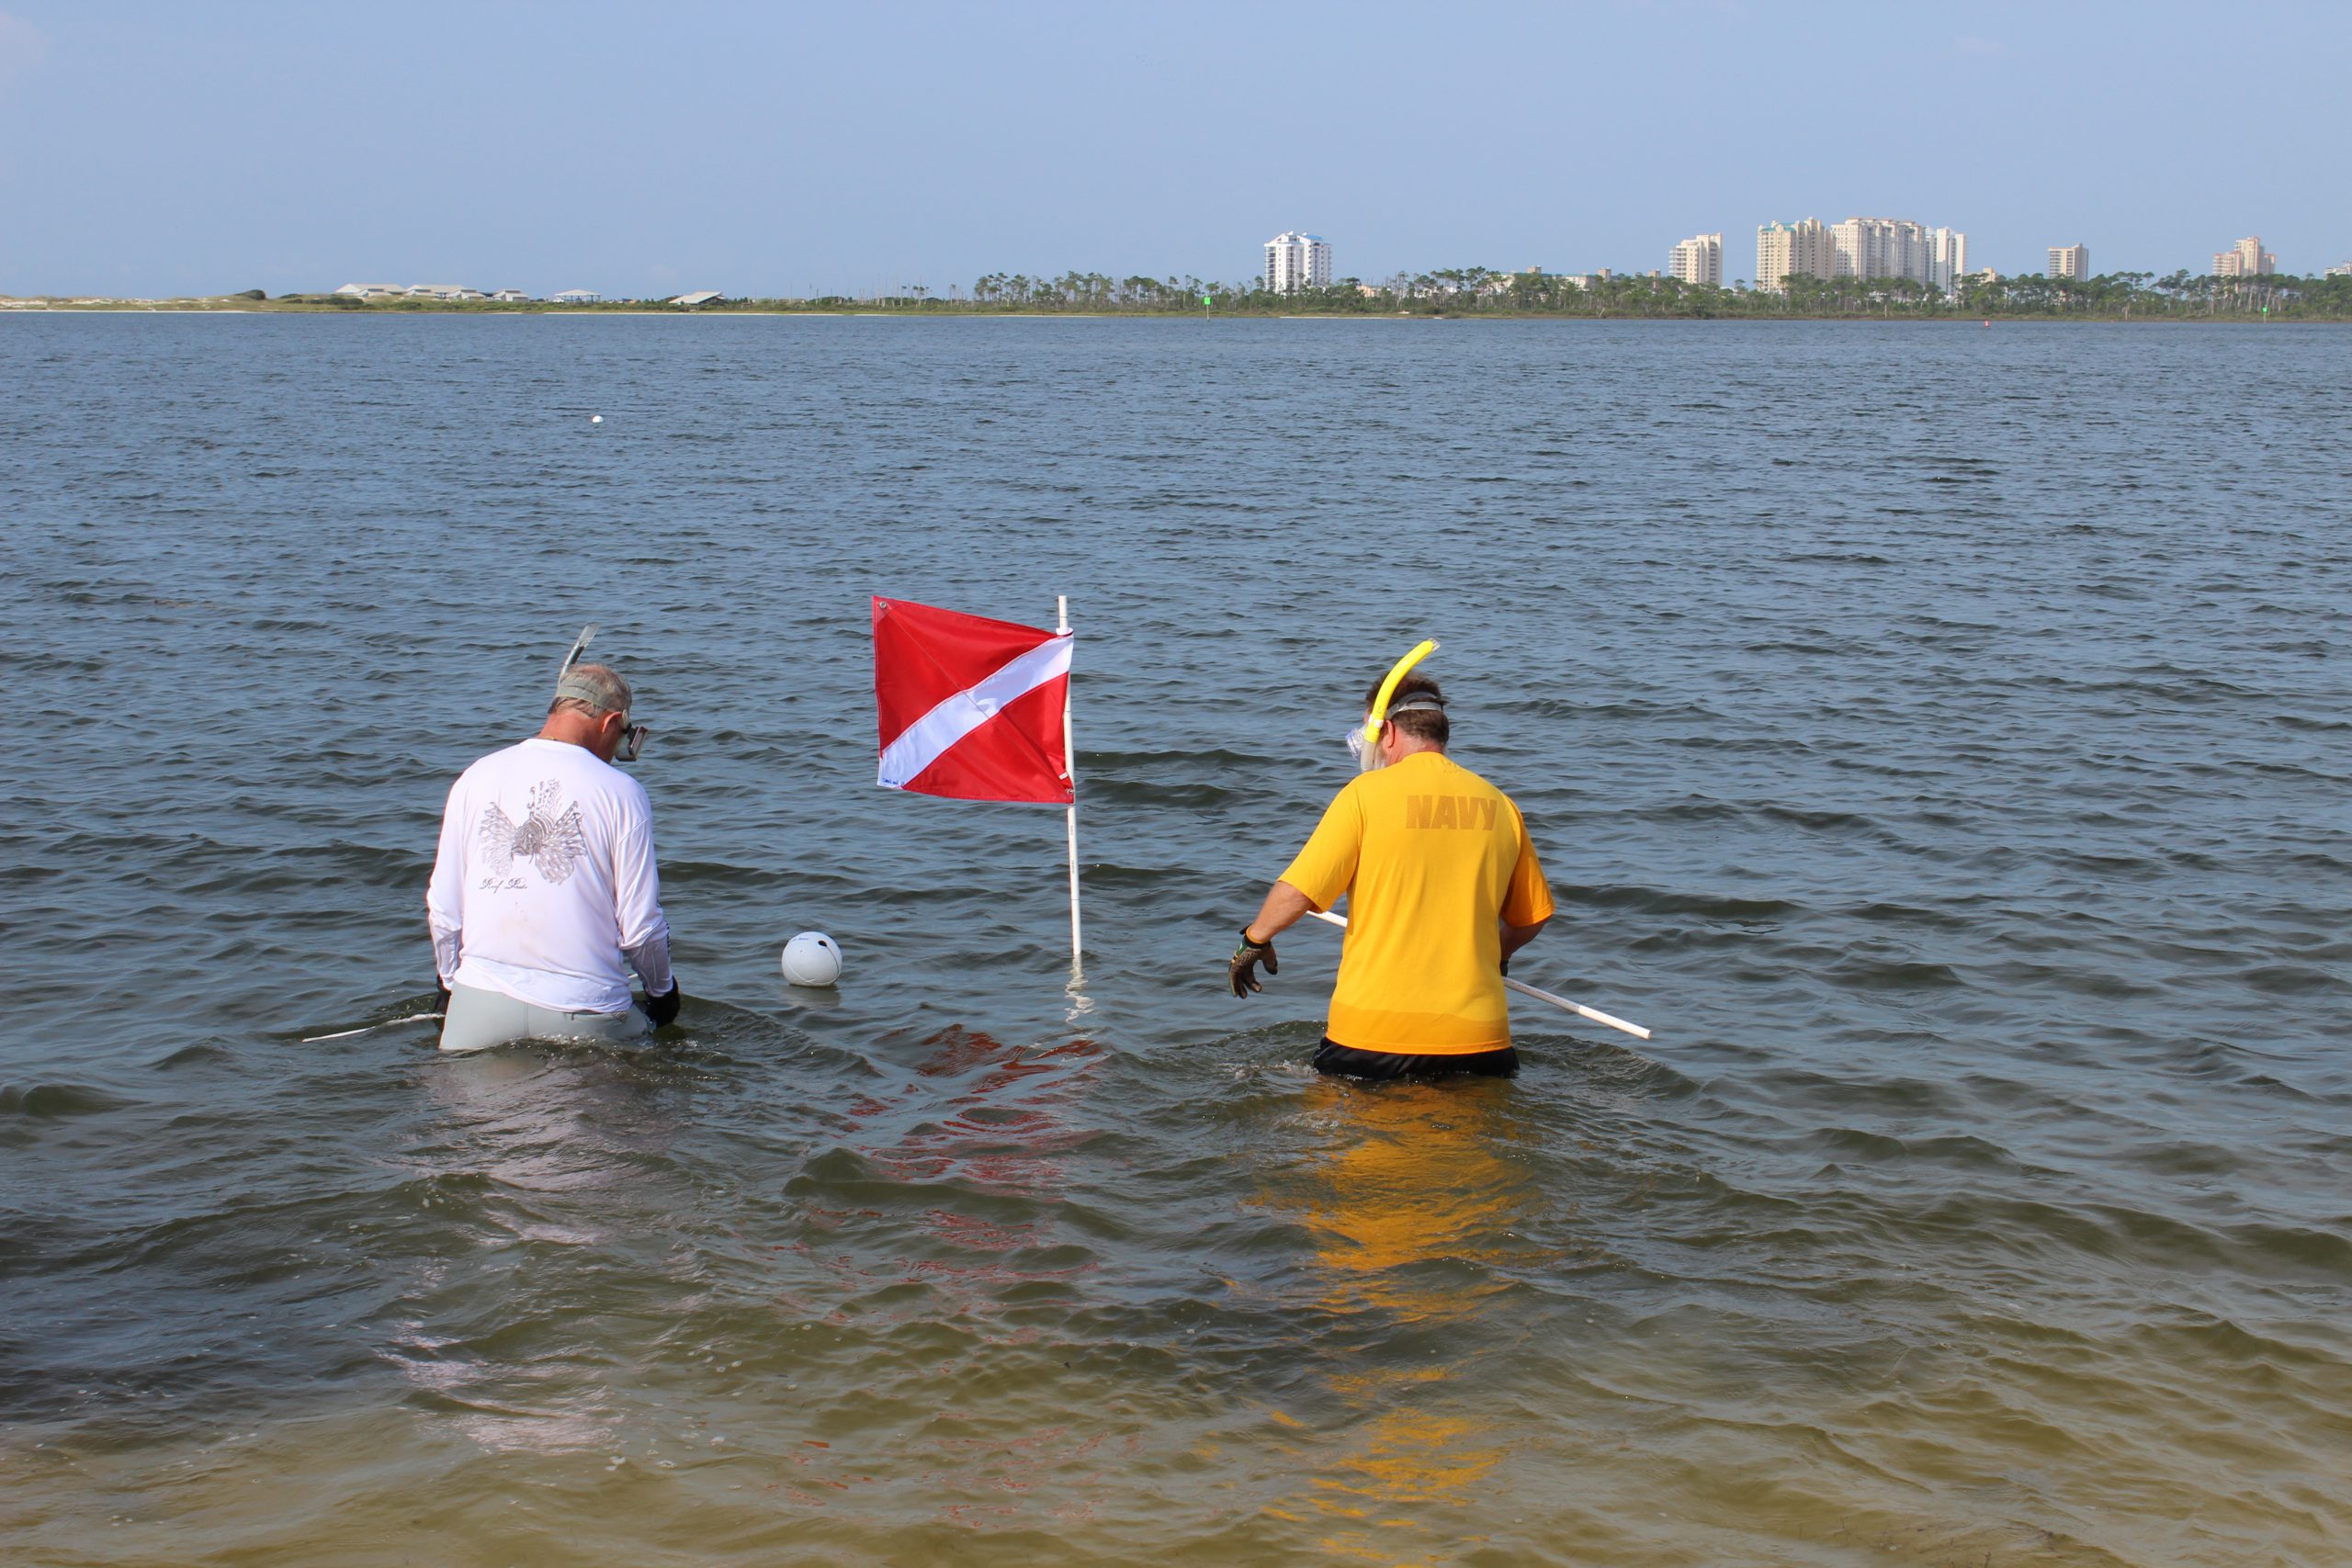
It is now time to do our annual Scallop Search. Each year we solicit volunteers to survey a search grid within either Big Lagoon or Santa Rosa Sound. Over the years the results of these surveys have not been as positive as the other two, but we do find them, and we will continue to search. If you are interested in participating in this year’s search, we will be conducting them during the last week of July. You can contact me at the Escambia County Extension Office (850-475-5230 ext.1111) or email roc1@ufl.edu or Chris Verlinde at the Santa Rosa County Extension Office (850-623-3868) or email chrismv@ufl.edu and we can set you up.
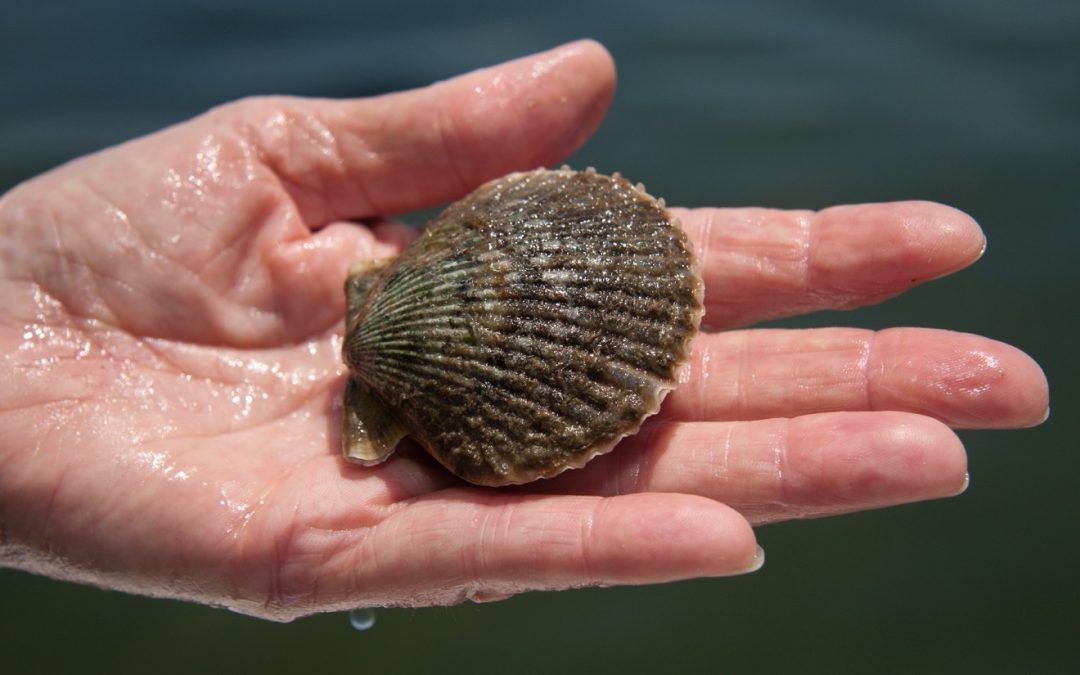
Bay scallops need turtle grass to survive. Photo: UF IFAS
Volunteers participating in the Great Scallop Search. Photo: Molly O’Connor
Final note…
Each June I camp out west somewhere and each year I look for those hard-to-find animals. After 10 years of looking for a mountain lion, I saw one this year. Finding these creatures can happen. Let’s hope encounters with all three become more common in our bay.
“Bluefish!” … “It’s just a school of bluefish!” So yelled the lifeguard in Jaws II when Chief Brody had mistaken a school of bluefish for the rogue great white shark that was plaguing the town. He would not have been the first to mistake these large schools for a larger fish, particularly a predatory shark, but as some know, bluefish are quite predatory themselves.
Bluefish Image: University of South Florida
Growing up along the Florida panhandle we heard little about this species. We had heard stories of large bluefish schooling along the Atlantic coast killing prey with their razor-sharp teeth and, at times, biting humans. But not much was mentioned about them swimming along our shores. But they do, and I have caught some.
Bluefish are one of several in a group Hoese and Moore refer to as “mackerel-like fish” in Fishes of the Gulf of Mexico. They differ in that they lack the finlets found along the dorsal and ventral sides of the mackerel body and mackerels lack scales having a smoother skin. Bluefish are the only members of the family Pomatomidae. They can reach three feet in length and up to 30 pounds. They travel in large schools viciously feeding on just about anything they can catch and seem to really like menhaden. They move inshore for feeding and protection from larger ocean predators but do move offshore for breeding.
Bluefish landed from the Gulf of Mexico are much smaller than their Atlantic cousins, rarely weighing in more than three pounds. They do have a deep blue-green color to them and thin caudal peduncle and forked tail giving them the resemblance of a mackerel or jack. Some say they are bit too oily to eat while others enjoy them quite a bit. There is a commercial fishery for them in Florida and, as you would expect, it is a larger fishery along the east coast. Most of the panhandle counties have had commercial landings, albeit small ones.
Biogeographically, the blue fish are found all along the Atlantic seaboard and into the Gulf of Mexico. It is listed as worldwide but seems to be absent from the Caribbean and other tropical seas. This could be due to a distaste of warmer waters, or the lack of their prey targets.
They are an interesting and less known fish in our region. Swimming in a school of them should be done with caution, there are reports of nips and bites from these voracious predators.
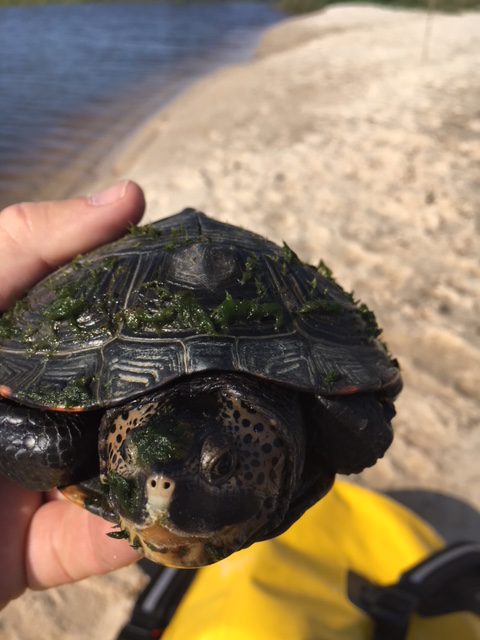
As the Sea Grant Extension Agent in Escambia County, one of my program areas is to help restore a healthy estuary. To do this we focus on educating the public how to improve water quality, restore habitat, and manage invasive species, but we also focus on how to monitor fish and wildlife. The fish and wildlife I focus on are those that were once common in the bay and are trying to make a comeback – such as scallops and horseshoe crabs. But there is another estuarine creature we are interested in that does not fall into the classic “bring them back” model and that is the estuarine turtle known as the diamondback terrapin.
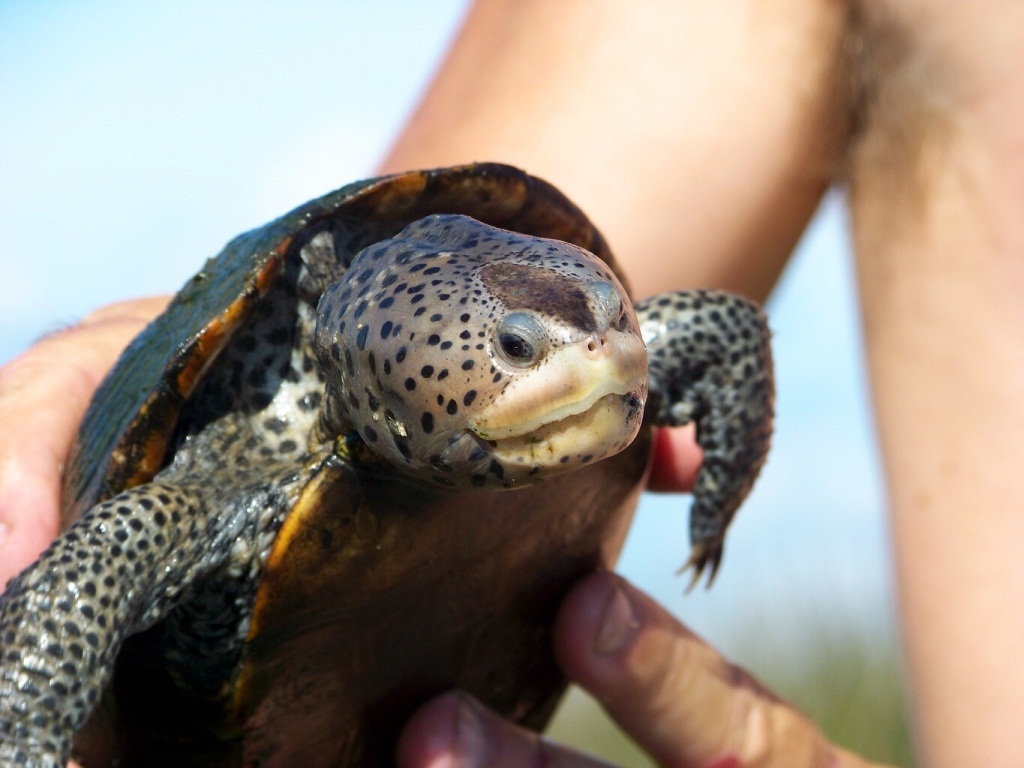
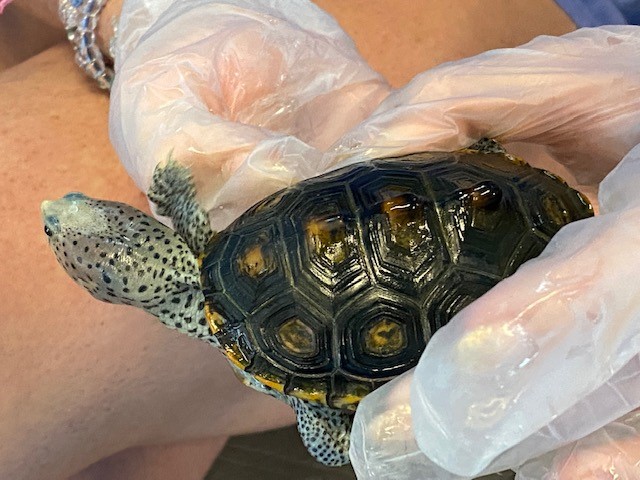
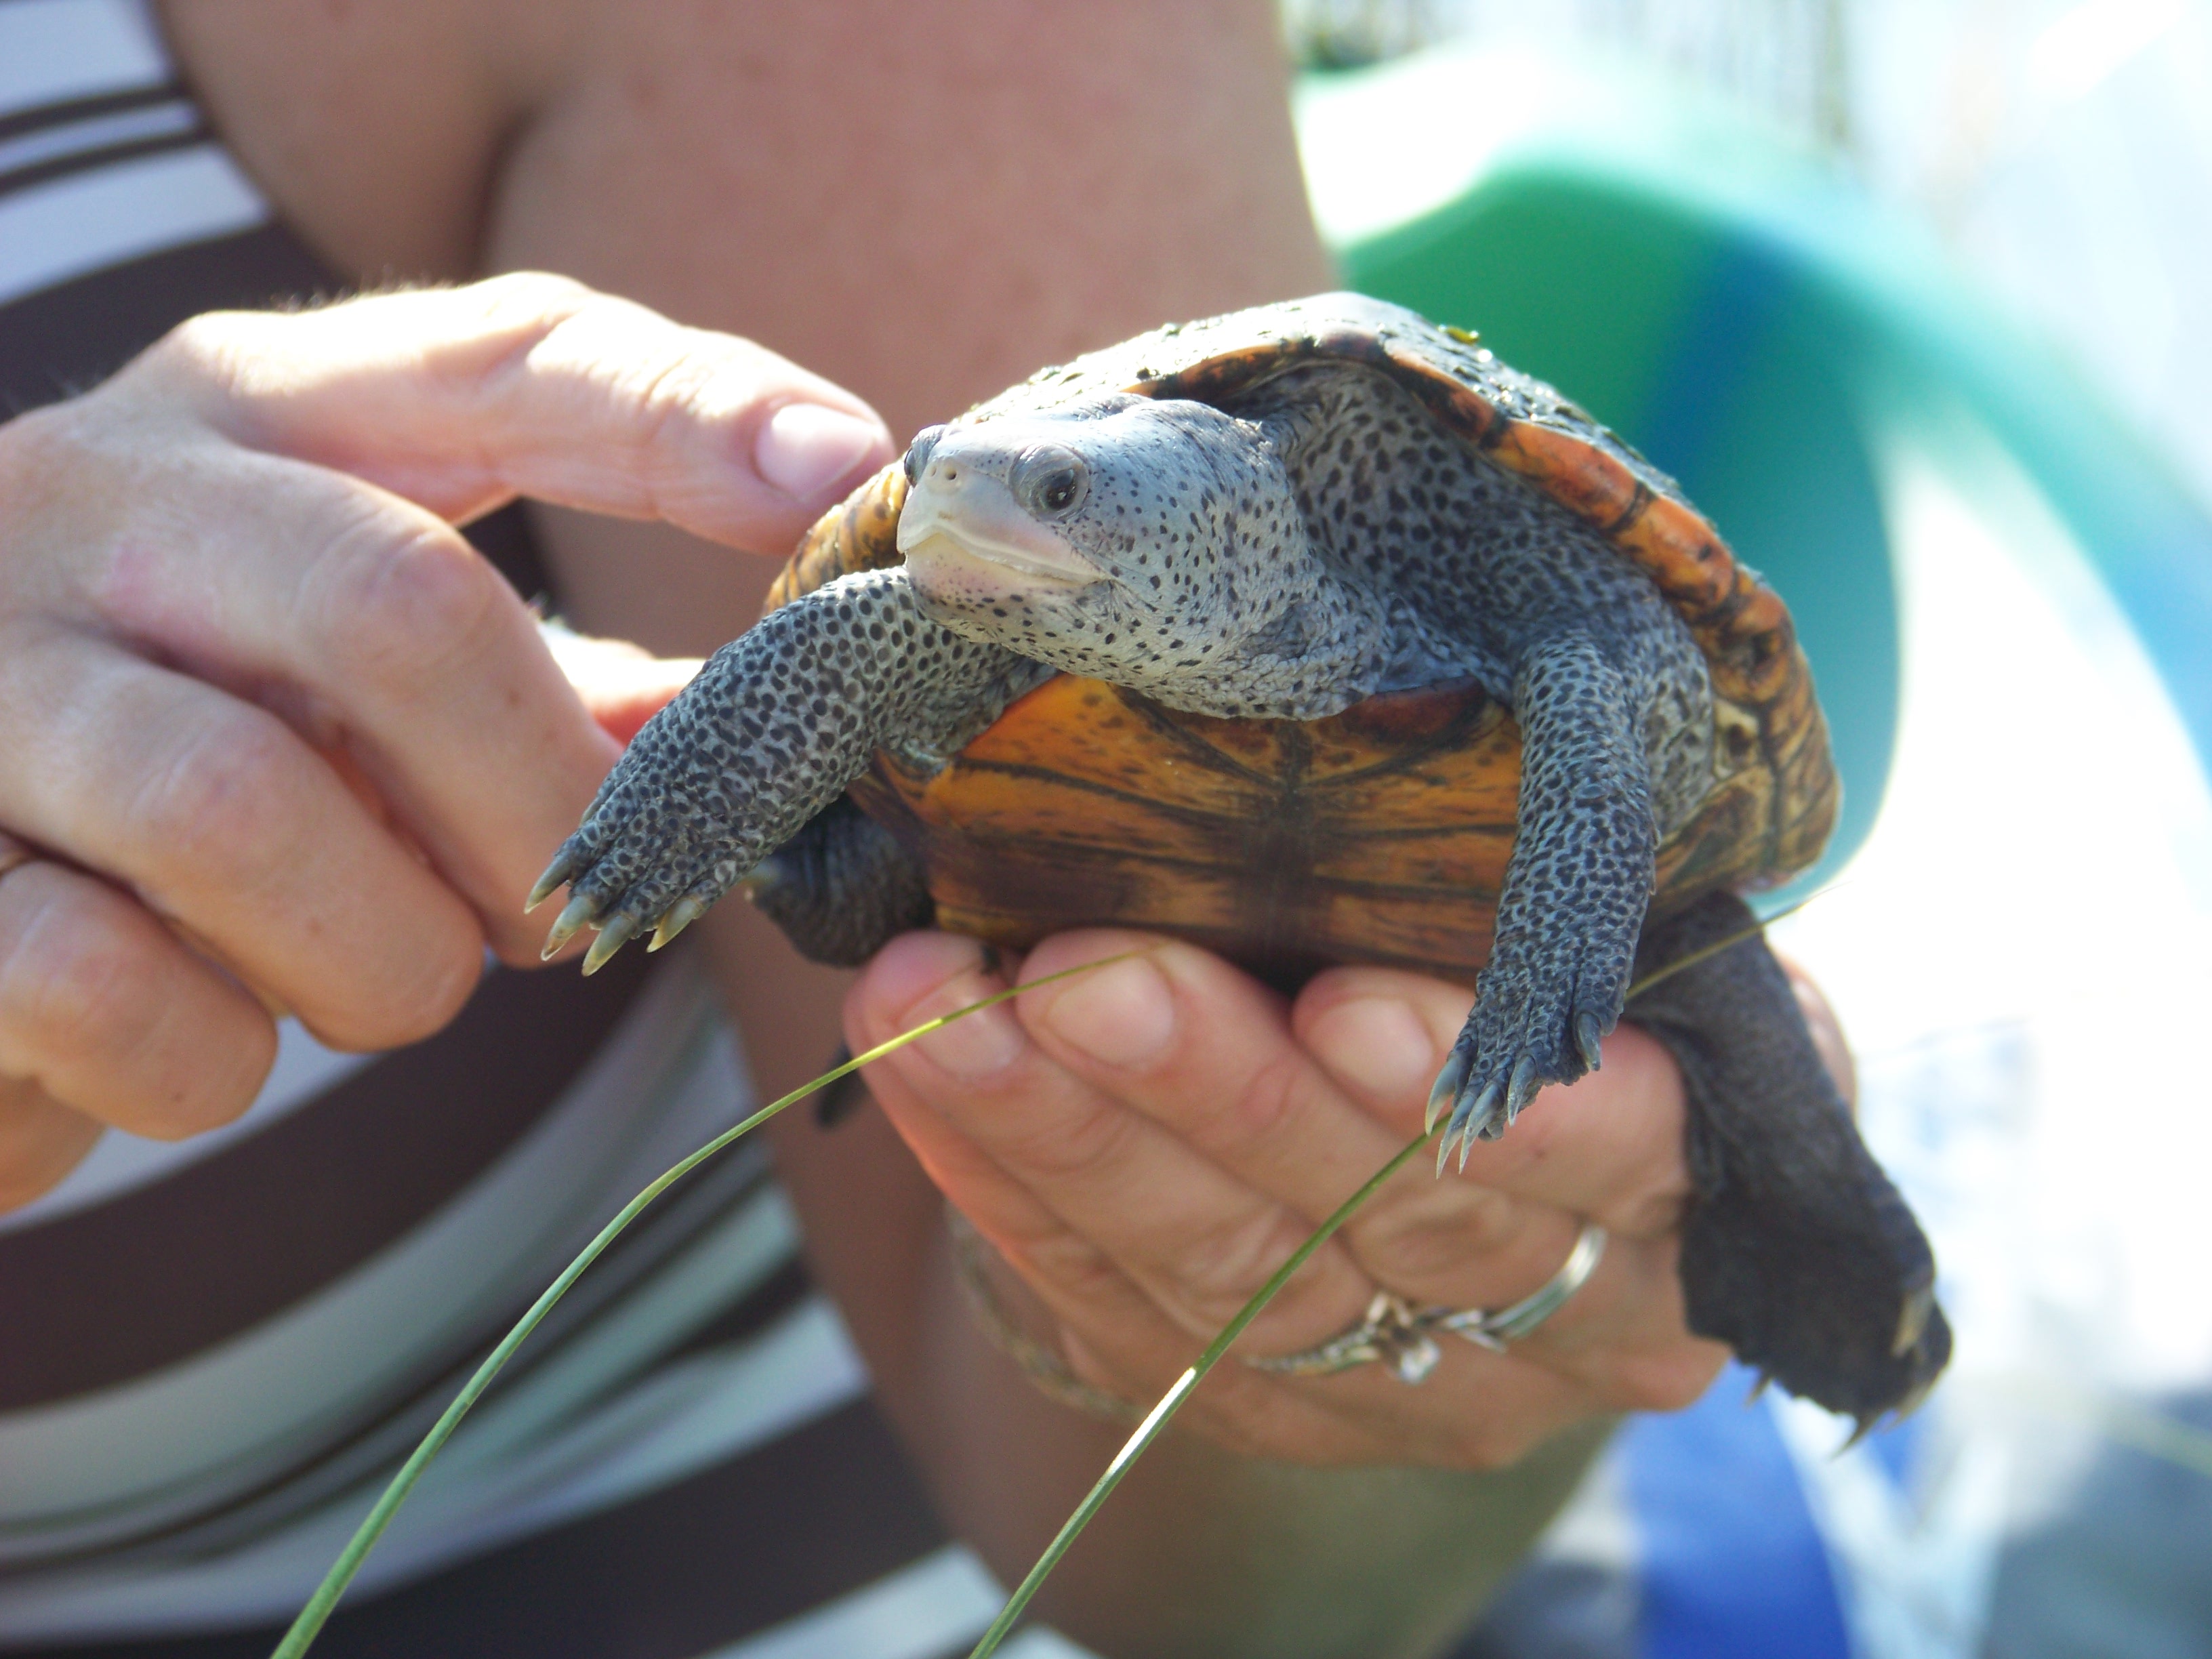
The diamondback terrapin. Photo: Molly O’Connor
Unlike scallops and horseshoe crabs, this is not an animal that people remember as a kid. In fact, very few Floridians in the panhandle have ever heard of it. Some older distribution maps of their range show that they exist from Cape Cod MA to Brownsville TX, but with a gap in the Florida panhandle. That was because there was no scientific literature of the animal’s existence here. And that was when the Panhandle Terrapin Project began – to confirm whether or not terrapins existed here.
In 2005, working with students at Washington High School in Pensacola, we began our search by placing “Wanted Posters” at boat ramps in Escambia and Santa Rosa counties near good terrapin habitat, which is salt marsh. We began to get calls almost right away, but for a variety of other turtle species. Folks were calling us with photos of box turtles, yellow-bellied sliders, and cooters. It showed there was interest in the project but was evident they were not familiar with the terrapin.
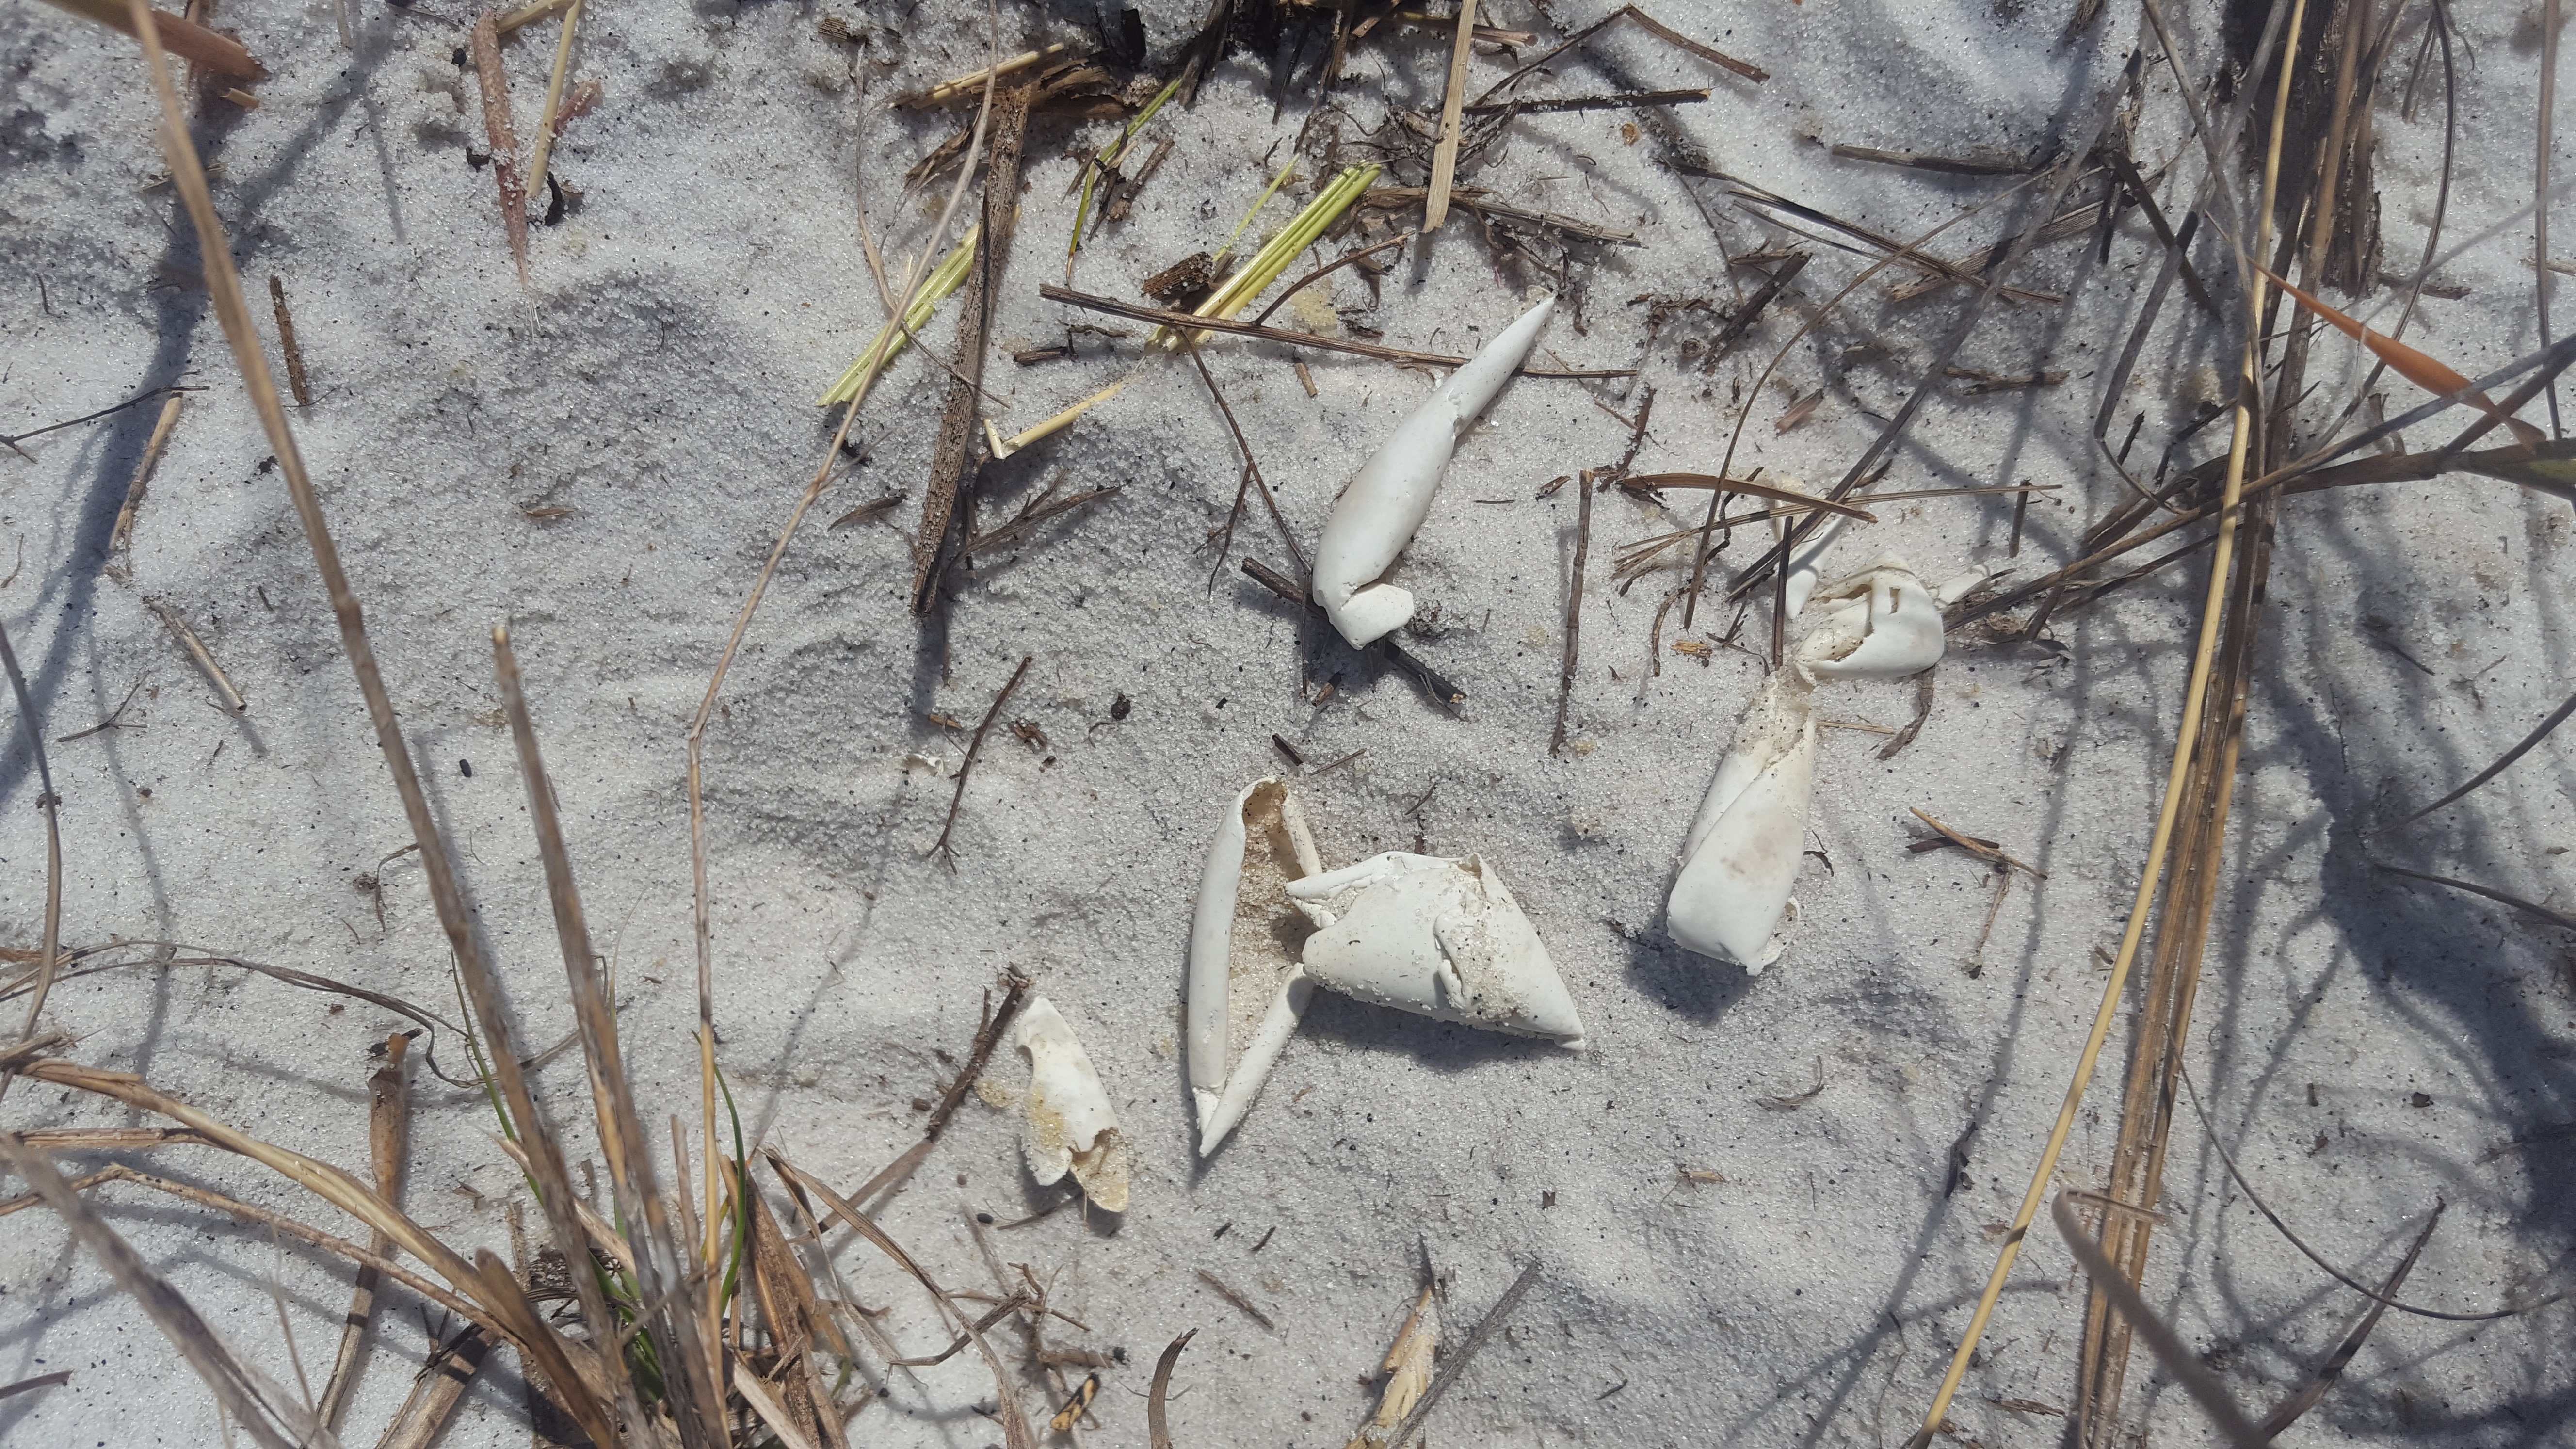
Around 80% of the terrapin nests are depredated by raccoons, or some other predator. Photo: Bob Blais
Volunteers log the number of female tracks they see on their beaches. Photo: Cindy Marvel
I interviewed several ole gill netters to see if they remember ever capturing them – same response, “I never heard of those”. I did show one gill netter a photo and he responded – “you know, I think we did catch a couple of these”. But no confirmation of their existence here. It was time to begin searching ourselves.
The team began to survey good terrapin habitat and walking potential nesting beaches looking for any evidence. We did not find it. Then one day in 2007 a gentleman working on a construction site responded to one of our “Wanted Posters”. He said he had seen one of our terrapins. After all of the calls that led to other species, I was not so sure – but he convinced me it might be. So, we checked it out. The sign was placed in good habitat and there were potential nesting beaches nearby. We searched… and we found. What we found were nests that had been depredated by raccoons. There were empty eggshells laying around and two dead hatchlings. There were also tracks in the sand. Confirmation… there were terrapins here!
It was now time to take the show on the road and see if terrapins exist in other counties along the panhandle. My wife and I would take part of our summer vacations and camp along the coast searching. We found at least one record of a terrapin in each of the counties between the Alabama state line and Apalachicola River. All of this was presented to the Florida Diamondback Terrapin Working Group of which there are members from the Florida Fish and Wildlife Conservation Commission. Word was out.
Terrapins prefer sandy beaches and lay their eggs during daylight hours. Photo: Molly O’Connor
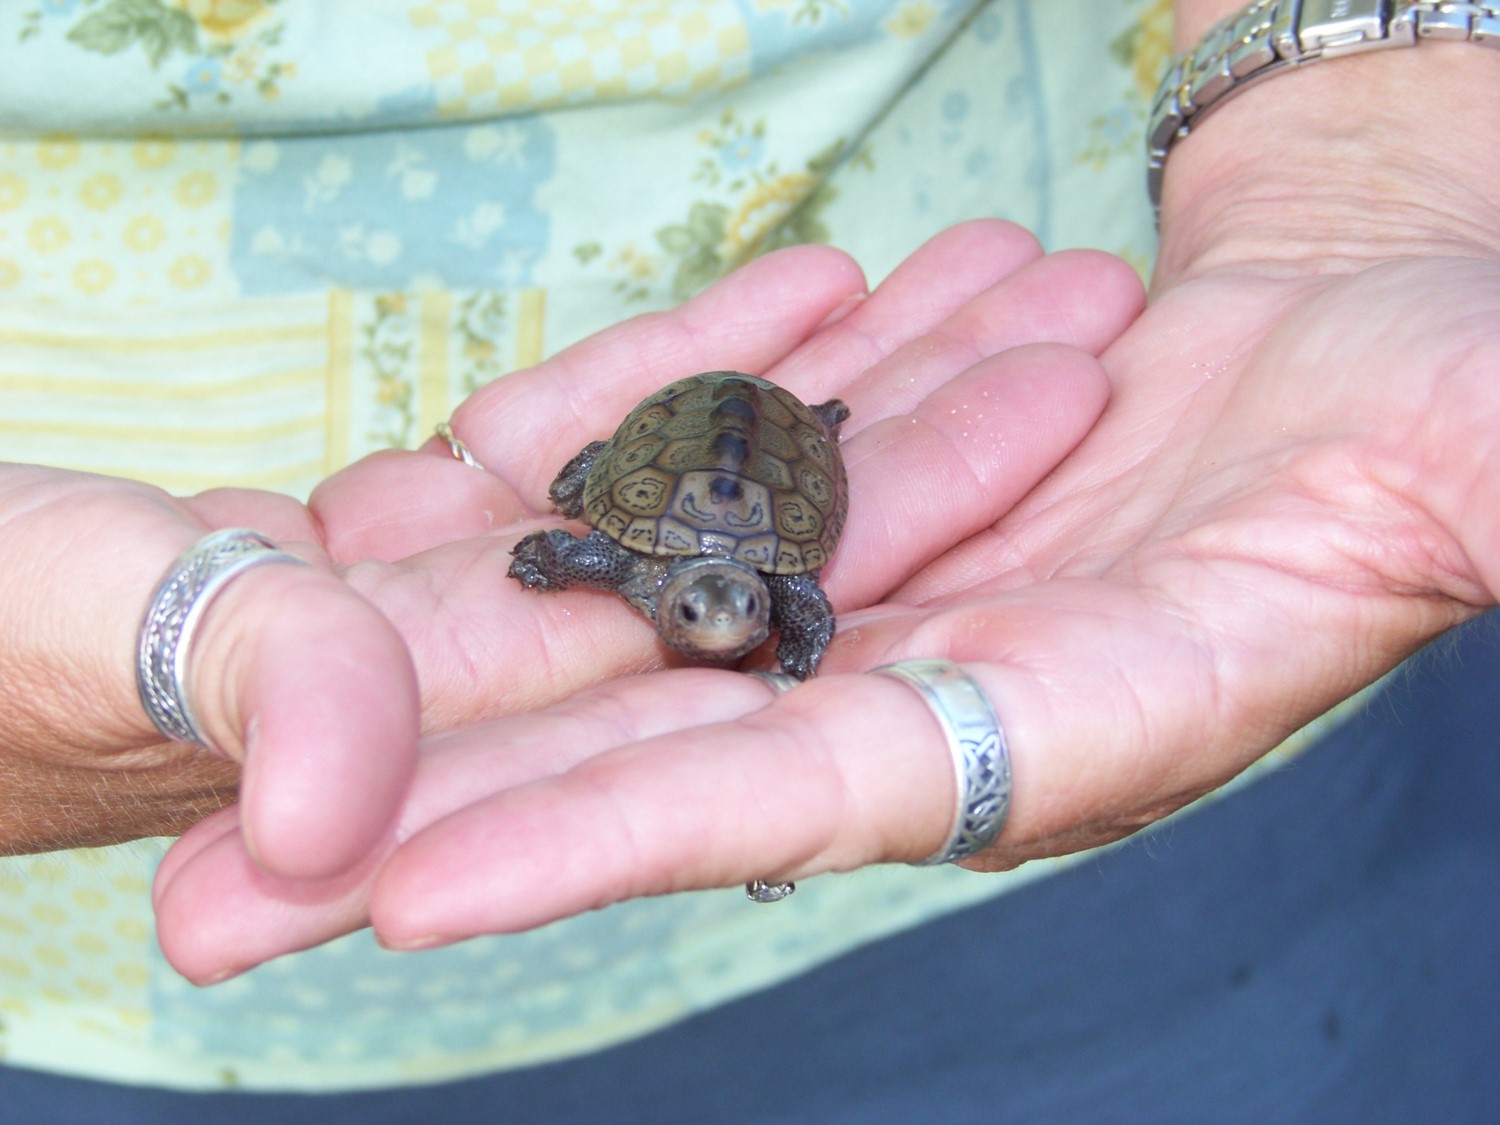
A terrapin hatchling. Photo: Molly O’Connor
The next step was to assess their status. How many are here and how are those populations doing?
We did this by following a method developed by Tom Mann with the Mississippi Department of Wildlife. Tom was monitoring terrapins in that state and the subspecies he worked with, the Mississippi Terrapin (Malaclemys terrapin pileata) was the one that was thought to be in Pensacola Bay. So, it was Tom’s method we decided to follow. This includes walking nesting beaches and logging individual tracks and depredated nests in 16-day cycles. Tom’s model assumed that all mature females in the population nest each season and that they do not lay more than one clutch in a 16-day period. The idea is that each track and nest represented one female, and assuming the sex ratio of male to female is 1:1, doubling the number of tracks and depredated nests found in that period would give an idea of how many adult males and females are in this group. Seemed easy enough so these surveys became part of our project.
Another method learned by attending conferences was a 30-minute head count. If you can find the lagoons where the terrapins actually live you can sit and count the number of heads you see in a 30-minute period. It is true that 23 heads does not mean there are 23 terrapins, but the relative abundance can be monitored. If you typically see 20-23 heads and over time that decreases to 11-15, then the relative abundance is declining. It is a method that citizen science volunteers can do and so was included in the project.
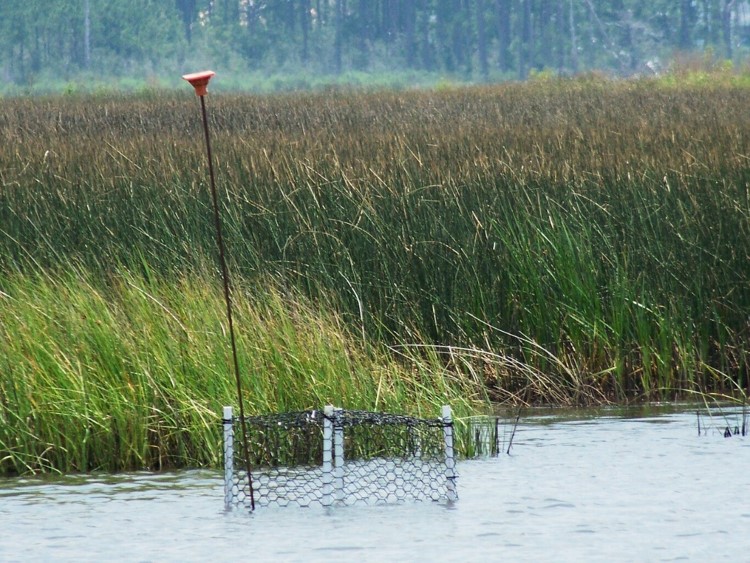
Modified crab traps is one method used to capture adults. Photo: Molly O’Connor
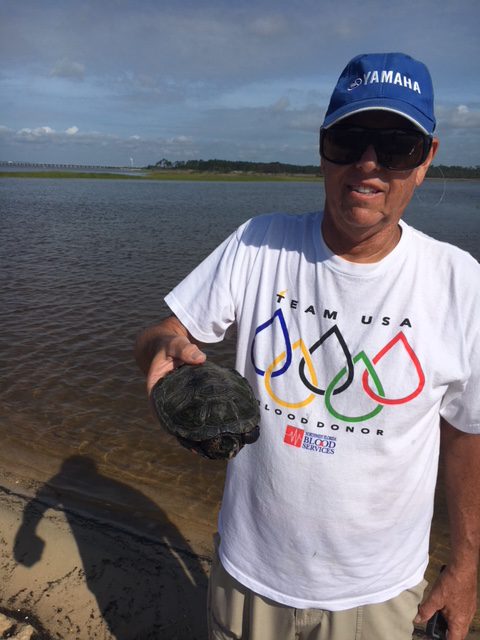
A diamondback terrapin being measured and marked before release. Photo: Rick O’Connor
We also wanted to try and capture individuals to mark and tag. Mark recapture is a method used to estimate populations but capturing terrapins has been historically difficult to do. Several methods have been used by members of the Working Group and we have tried them as well. We have captured terrapins, but very few.
In 2018 the Team partnered with the U.S. Geological Survey to increase the robustness of the project. The Florida Fish and Wildlife Conservation Commission became interested in tissue samples from captured animal to study the genetics of the terrapins in this area. Since 2015 we have trained 228 individuals to conduct surveys, and some have been with me that entire time. Many of them have spent countless hours helping assess the status of this animal in our bays. Many days they see nothing. Others a few tracks or depredated nests. Some locations have good luck with head counts, but many of them finding nothing.
The Mississippi terrapin found in Pensacola Bay is darker in color than the Ornate terrapin found in other bays of the panhandle. Photo: Rick O’Connor
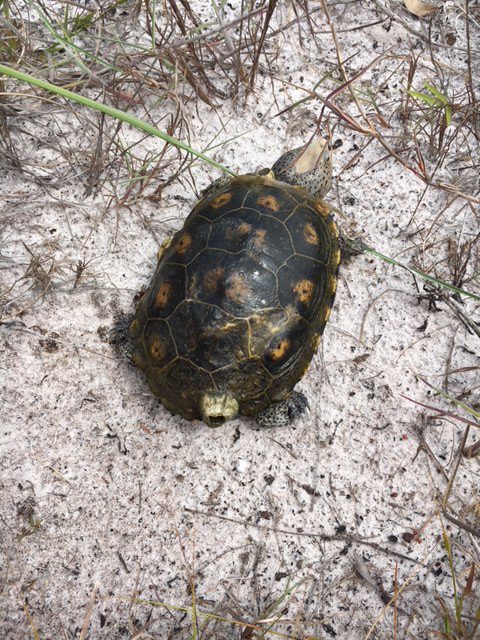
This terrapin has the coloration of the Ornate terrapin but was found much further west than the literature suggest it lives. Photo: Rick O’Connor
I keep track of “Frequency of Occurrence” (FOO) – the number of surveys where some sort of terrapin encounter happens. This encounter can be as simple as a track in the sand, but they had SOME encounter. It is my hope that over time encounters with them will increase, just as I hope it does with scallops and horseshoe crabs. Since 2007 the FOO has ranged from 12-86% of the surveys conducted, with an average of about 25%. The best year was 2011 (86%), just after the Deepwater Horizon spill. There was a steady increase in FOO from 2007 to 2012 when it took a significant drop. However, this is not because the relative abundance of terrapins suddenly dropped. 2012 was the year I moved from the marine science program at Washington High School to Florida Sea Grant Extension. There were all new volunteers and the learning curve started over. They were not as good at detecting them as the previous group. But that is changing. 2022 is looking to be a busy year for the team.
So far this year we have seen terrapin activity on almost every nesting beach between here and Apalachicola. One site had 49 heads in a 30-minute head count! There have been several active nests, numerous tracks, and plenty of depredated nests. In addition, we have found one dead hatchling and captured two adults. Tissue from these have been collected for the genetic study. But the strangest story this year… a security guard has told us of terrapin hatchlings that have been dropped on their guard shack by birds. Sea birds are known to do this to try and crack open shells of mollusk so they can feed on them. I have never heard of this with terrapins, not here or anywhere.
A dedicated volunteer is rewarded with a capture. Photo: Rick O’Connor
It seems it is going to be a terrific year for the terrapin project this year. It is exciting for our volunteers to have so many encounters and nice to know that the public is becoming more familiar with this animal. I cannot say whether the population is increasing or not but our knowledge, understanding, and encounters are.
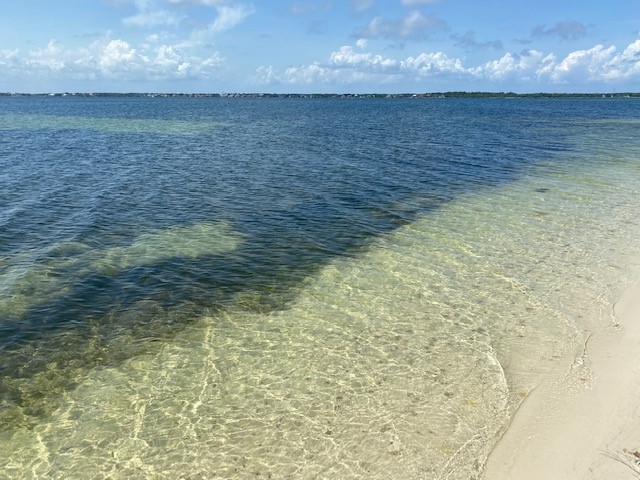
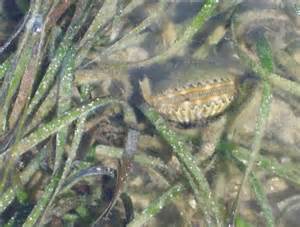
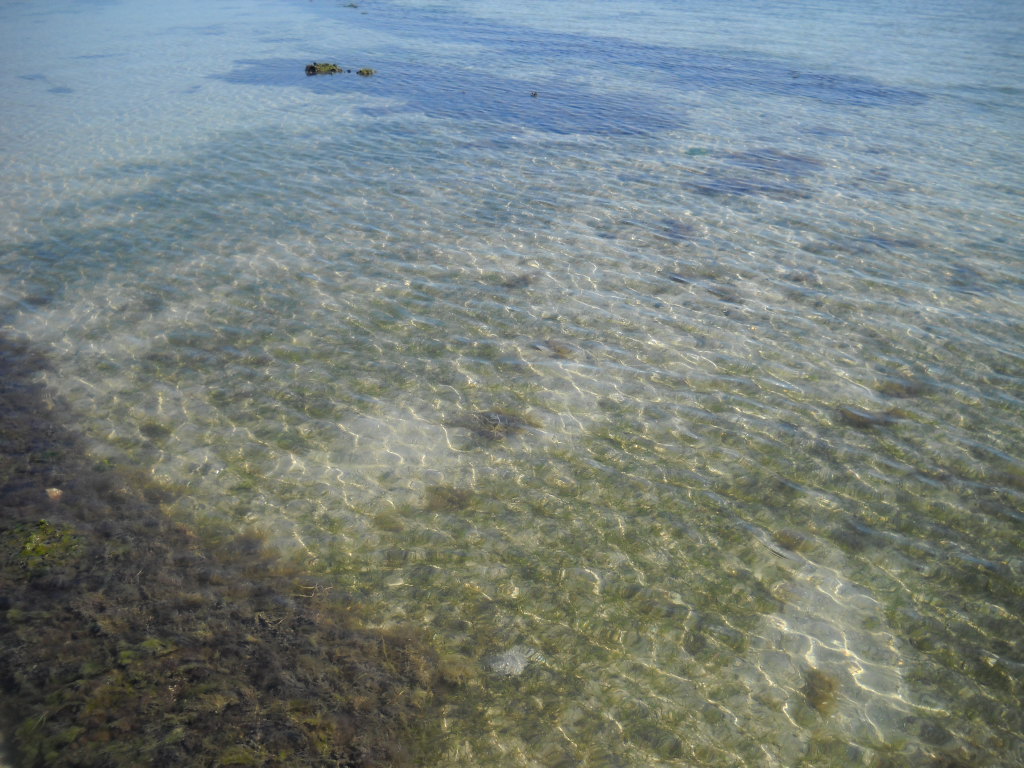
It is 1922 and you are rowing your wooden skiff from a small beach house near what will become the town of Gulf Breeze Florida across Santa Rosa Sound on your way to Santa Rosa Island. The water is 10-15 feet deep, and you can see the bottom. It is covered with a lush garden of seagrasses with numerous silver fish jutting in and out of the blades. Most are there only for a moment before they are lost again. You notice a brown colored puffer fish hovering over the grass as you past by. Maybe a small sea turtle grazing, or a tannish colored stingray flying over the meadow. As you get closer to the island, which is covered with sand dunes reaching 20-40 feet in height and shrubby live oak and magnolia trees, you begin to see Florida conchs and horseshoe crabs, maybe fields of bay scallops littering the grass in every direction.
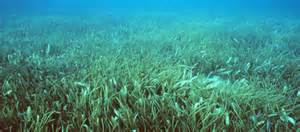
An amazing meadow of underwater grass. Photo: Virginia Sea Grant
Sounds amazing, doesn’t it? And it was actually like this once.
What changed?
I asked this question of some ole timers who grew up on Bayou Texar in Pensacola decades ago. You might be surprised to learn that Bayou Texar resembled this scene. They described water that was between 10-15 feet deep, had sand and seagrass on the bottom, and you could catch shrimp the size of your hand by tossing out a cast net. But Bayou Texar no longer looks like this.
Most told me the first thing they remember was a change in the water clarity. The water became more and more turbid. Then the shrimp went away, then some of the fish. They mentioned several species of fish that no longer exist there. The cause of the turbid water? … Development. They were developing all around the Bayou after World War II and that was when things began to change. They mentioned the road going in on the east side of the bayou as the point when turbidity issues began. The houses came later.
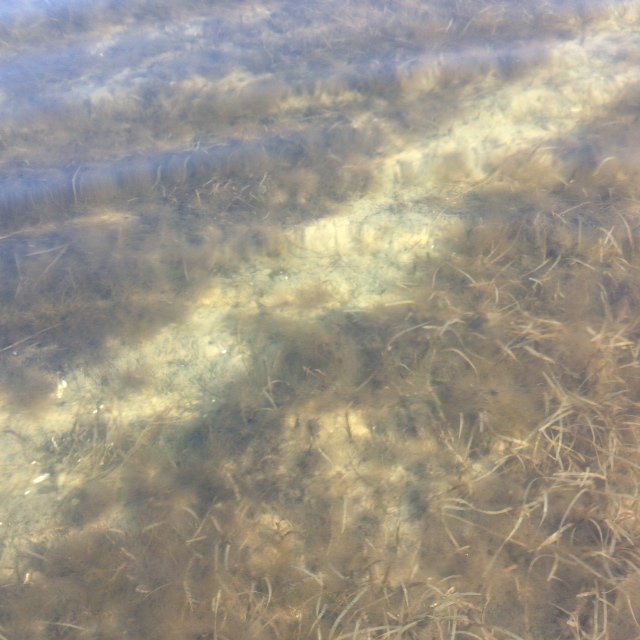
With little rain over the last few days the water clarity was excellent and you could see the seagrass very well.
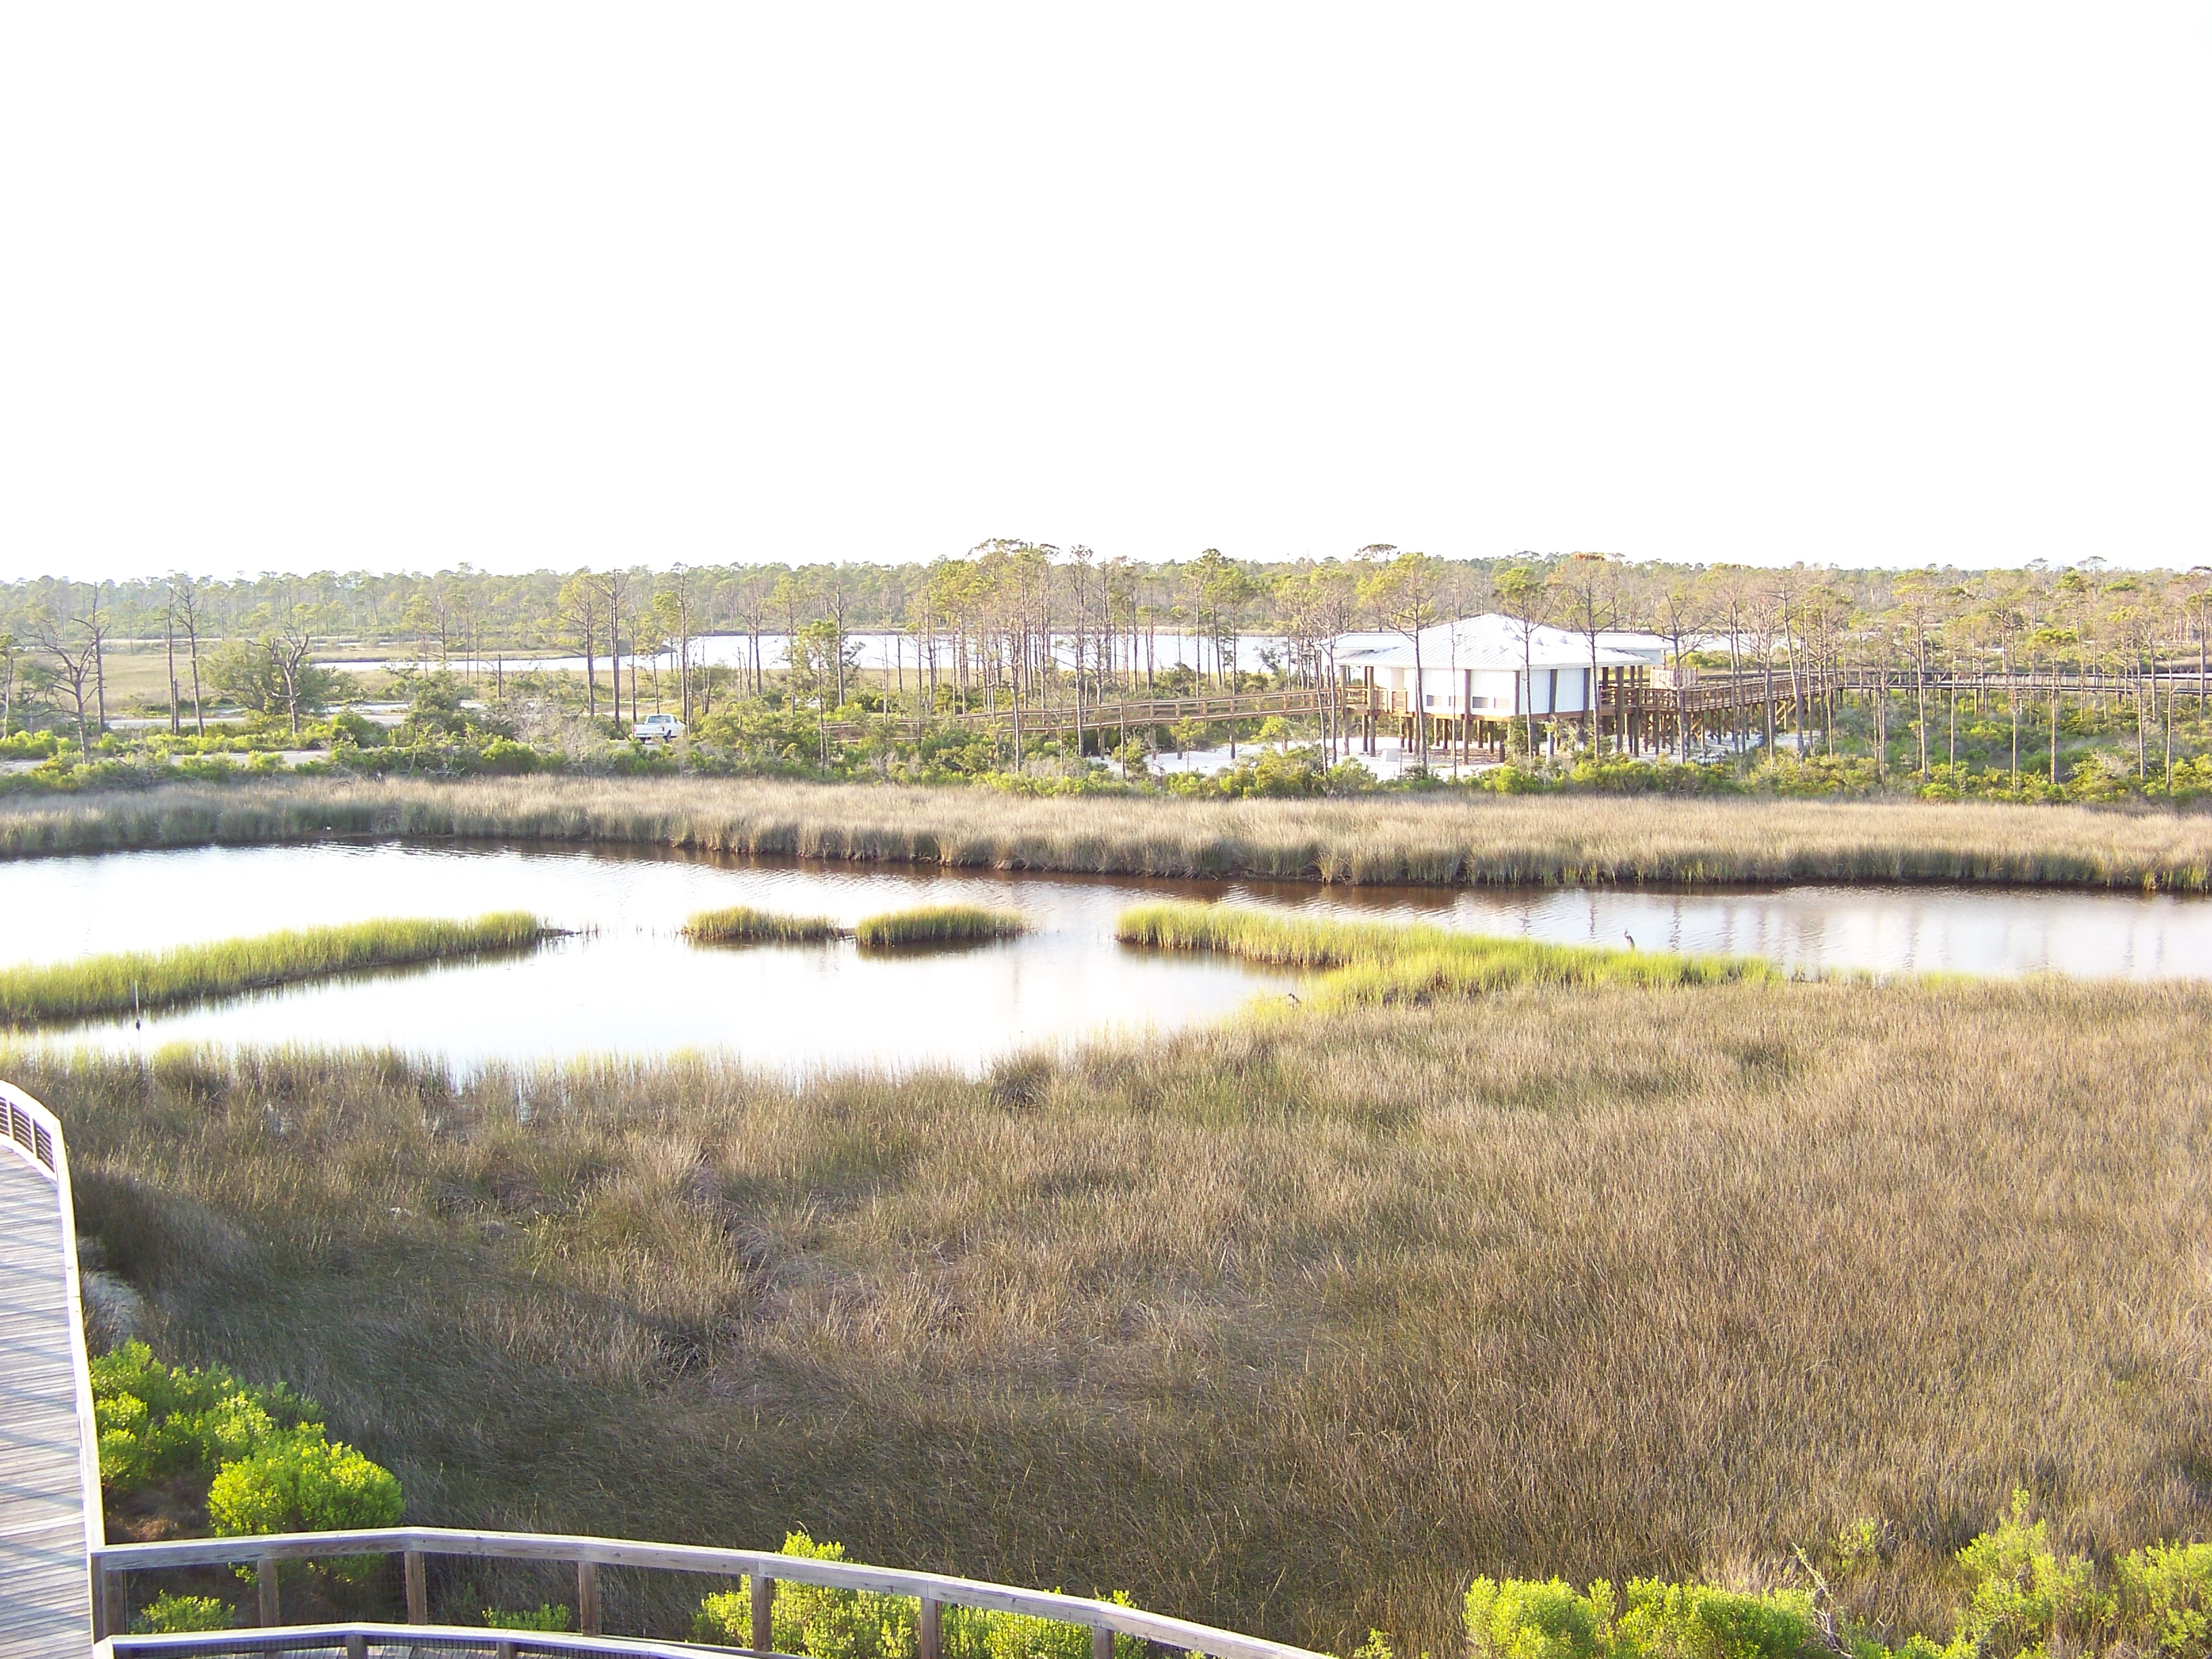
The city of Gulf Breeze was founded in 1935 and was originally called Casablanca because of a white house there that could be seen from Pensacola. As the community grew the waters became more turbid as well, and the amazing underwater garden declined. But this was not just happening in Gulf Breeze and Bayou Texar, it was happening everywhere.
But it was bound to happen. As the human population grows more space is needed for homes, businesses, and schools. More roads are needed to reach these locations and a bridge was placed to reach Santa Rosa Island, so you no longer had to paddle a skiff to reach it. Once on the island, growth continued. More homes, roads, and businesses. With more run-off, turbidity, and the garden continued to decline.
Shoal grass. One of the common seagrasses in Florida. Photo: Leroy Creswell
The thing was we did not know at the time that (a) we were causing this decline and (b) how much we really wanted that garden there. I often hear the question “what happened to all of the blue crabs?” I think they know the answer, but they remember a time when blue crabs were more abundant, can you imagine what it probably was like for our friend paddling across in 1922. And there has been a noticeable difference in crab numbers in their life. There are folks, including myself, who remember bay scallops in the Sound and horseshoe crabs on what they called “Horseshoe Crab Island” in Little Sabine. This is one of the amazing things about this story – how fast the decline was. Now we better understand how important these underwater meadows were to the function of a healthy estuary and there is interest in restoring them.
Bay scallops need turtle grass to survive. Photo: UF IFAS
To restore seagrass, you first have to understand, and mitigate, what is causing the decline. Seagrasses are vascular plants that possess roots, stems, and leaves. They produce flowers and sexually reproduce using seed. This is not the case with seaweeds, which are nonvascular and lack the above, but they often mistakenly called seaweeds. There are three species that dominate our seagrass meadows in the Florida panhandle and a fourth one that is not as common. The uncommon one has a round blade like a pine needle and is called manatee grass (Syringodium filiforme).
The three common species all have flat blades. Widgeon grass (Ruppia maritima) has blades that branch. It tolerates a wide range of salinity and is more abundant in the upper regions of our estuaries. Shoal grass (Halodule wrightii) has a single flat, non-branching, blade that is very narrow (< 3mm) and resembles human hair. Turtle grass (Thalassia testudinum) is also flat, non-branching, but wide (>3mm) and resembles St. Augustine grass.
Like other grasses, these plants require sunlight and nutrients to survive. They also need to grow in the low energy locations of our estuaries. Sunlight, of course, is key for photosynthesis and clear water is the key to getting enough of it. 15-25% of the sunlight reaching the surface of the water must also reach the bottom where the grasses are. Nutrients can be obtained through the water column and sediments. The stems run horizontal beneath the sand and are called rhizomes. They help hold sediments in place increasing the much-needed water clarity as well as reduce shoreline erosion. The blades extend from the substrate up into the water column bathing in the sunlight. They are covered by microscopic plants and animals that resemble scum when you run fingers over them but provide mush of the food for the creatures that live there.
And live there they do.
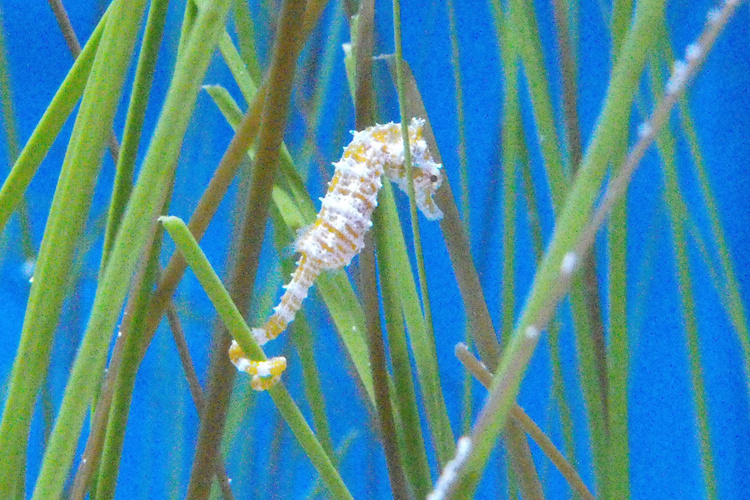
It has been estimated that it least 80% of the commercial and recreational important shell and finfish spend at least part of their lives in the seagrass meadows. Ducks, manatees, and sea turtles are some of the grazers on these plants and sea horses, pipefish, and pinfish are abundant.
Photo: NOAA
When humans began developing around the Sound in the 1940s and 1950s the sediment run-off decreased water clarity, cutting off the much-needed sunlight, and in some locations covered the grasses. Excessive nutrients from our fertilizers, and detergents increased phytoplankton growth which in turn decreased water clarity more and enhanced the growth of macroalgae which smothered the meadow like a blanket. Hot water discharges from industrial processing along the shores stressed the grasses as did prop and anchor scars from power boat plowing through and anchoring in them. These same boats and jet skis increase wave energy with their wake, as do seawalls when waves reflect off of them. Marinas, bridges, and docks all required dredging in the meadow which not only removed the grasses but increased turbidity even further. All of this triggered the decline of these amazing gardens. And with them the decline of the cherished fisheries as well.
The scarring of seagrass but a propeller.
In recent years the Florida Fish and Wildlife Conservation Commission (FWC) conducted surveys across the state to assess the status of our seagrass beds. They estimated that there was a little over 2 million acres of seagrasses in Florida waters, 39,000 in the western panhandle. Though much of these beds appeared to be stable, or even increasing acreage, those in the panhandle were still in decline and all of Florida’s seagrass gardens were less than the acreage in the 1950s.
In this study they found the Perdido Bay had primarily shoal grass. Big Lagoon and Santa Rosa Sound were a mix of shoal and turtle grass, with some manatee grass reported from Santa Rosa Sound. Aerial imagery found –
Perdido Bay had 642 acres of seagrass in 1987; 125 acres in 2002 for a net loss of 5.4% / year
Pensacola Bay had 892 acres in 1992; 511 acres in 2003 for a net loss of 3.9% / year
Big Lagoon had 538 acres in 1992; 544 acres in 2003 for a net gain of 0.1% / year
Santa Rosa Sound had 2,760 acres in 1992; 3,032 acres in 2003 for a net gain of 0.9% / year
The numbers in the lower portion of the bay are encouraging and suggest some behavior changes we made in recent decades have helped. Both development and monitoring continue. We will see.
What can be done to help restore the garden?
First, reduce run-off into the bay. This can be done by engineering designs with green infrastructure methods but can also be done by the private homeowner as well. Using native plants in your landscape reduces the need to irrigate your property and landscape designs which include rain gardens and rain barrels will also help reduce run-off.
The reduction of nutrients begins with the reduction of fertilizers on the landscape. Using Florida Friendly Landscapingprincipals can lead to a beautiful landscape that does not require fertilizers. If you choose to use nonnative plants that do require fertilizers, use only what the plant needs – do not over do it.
If you live along the waterfront, you can further reduce nutrients by planting a living shoreline. The plants used in living shorelines are known to remove nutrients from run-off from your property, as well as reduce erosion and provide more habitat for fisheries. One living shoreline project in Bayou Grande has seen an increase in shoal grass beds since they planted it.
When boating, be aware where seagrasses exist. Lift your motor when moving through them to avoid prop scarring and anchor in open sandy locations. You can also follow the principals of a Florida Clean Boater to reduce your impact on water quality that could impact the seagrasses.
With a little effort on our part, we can enhance some of the positive numbers we have seen in seagrass assessments and hopefully turn the current negative trends into positives. Maybe the garden will return. For more information on how you can apply any of these principals contact your county Extension office.