by Rick O'Connor | Apr 8, 2021
EDRR Invasive Species
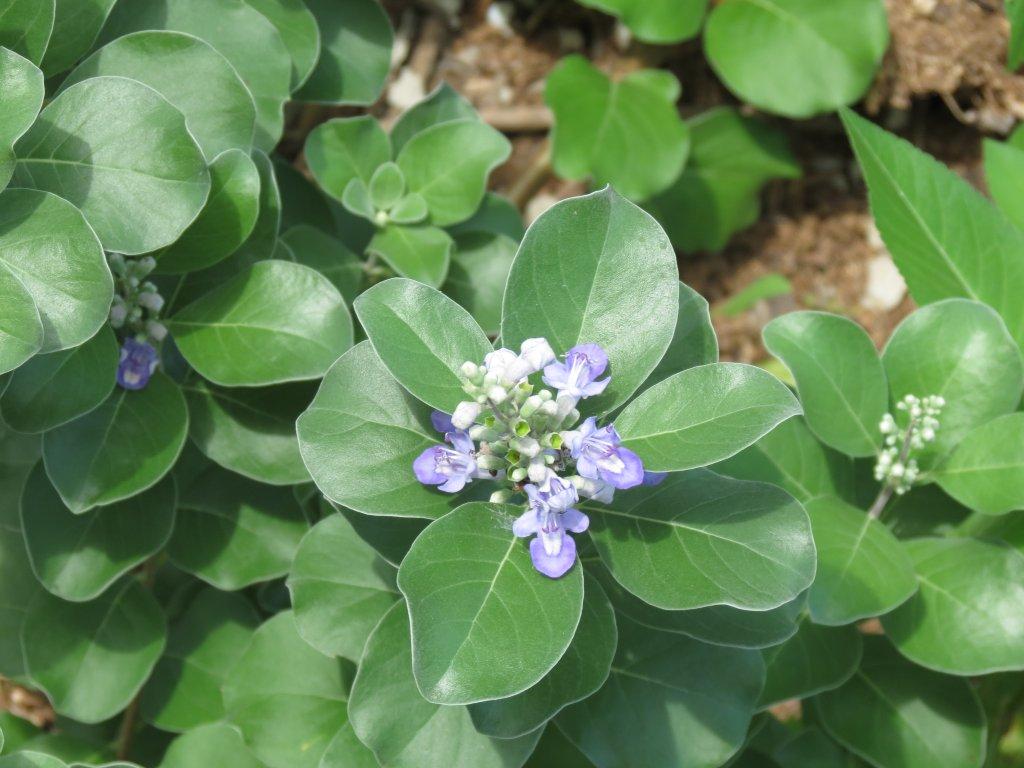
Beach Vitex (Vitex rotundfolia)
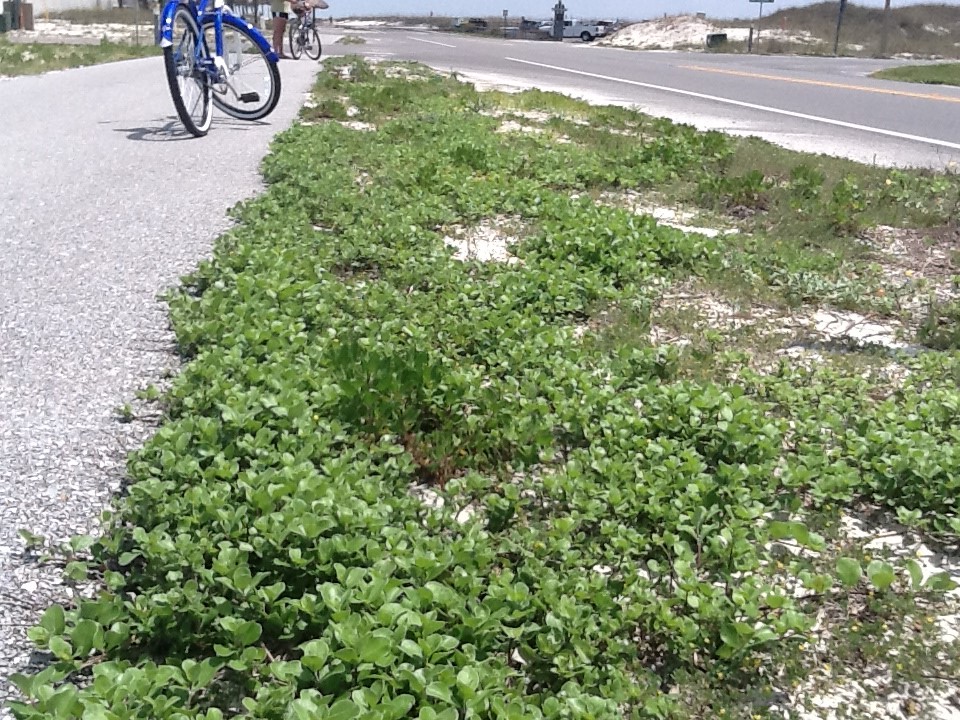
Vitex beginning to take over bike path on Pensacola Beach. Photo credit: Rick O’Connor
Define Invasive Species: must have ALL of the following –
- Is non-native to the area, in our case northwest Florida
- Introduced by humans, whether intentional or accidental
- Causing either an environmental or economic problem, possibly both
Define EDRR Species: Early Detection Rapid Response. These are species that are either –
- Not currently in the area, in our case the Six Rivers CISMA, but a potential threat
- In the area but in small numbers and could be eradicated
Native Range:
Beach vitex is native to the coastal shores of Asian countries bordering the Pacific rim. It is also found in Hawaii.
Introduction:
There are conflicting records as to when it was first introduced to the U.S. One record has it in the country as early as the 1950s. However, there are no records of plants from that stock still existing. Most records suggest the release of the plant occurred in the 1980s when it was brought to North Carolina as a potential ornamental plant. It was then used in dune restoration after a series of hurricanes and became a problem. Thus, it was intentionally introduced.
EDDMapS currently list 649 records of beach vitex. Most are in North Carolina. There are 82 records in Florida and 46 (56%) are in the Pensacola Bay area. We currently have 75 records from the Pensacola Bay area. Not all are reported on EDDMapS due to private property restrictions. Records do occur in coastal Alabama, Mississippi, as well as Okaloosa and Franklin counties in the Florida panhandle.
Distribution is most likely due to the high tolerance of salt water by the seeds and dispersal by currents, as well as intentional plantings by local landscapers and homeowners. Vitex rotundifolia is now a noxious weed in Florida and can no longer be sold.
Within our CISMA there are records in all coastal counties (Baldwin, Escambia, Santa Rosa, and Okaloosa)
Description:
Beach vitex is a perennial plant that initiates from a main taproot and extends herbaceous vines across the surface of the substrate in almost a 360° pattern. The vines can grow as much as 20 feet in length and become more woody with age. As the plant grows, secondary roots extend from each of the nodes from the above ground stems (vines) and becomes more of a shrub, reaching a height of about two feet.
The two-inch leaves are ovate in shape, a light green to blue-green color, and are aligned opposite of each other. They turn a reddish brown during the fall and winter and many plants will lose their leaves completely during this time.
The blossom is a lavender color and made of numerous small petals. The blossoms are present during the spring and summer. They will produce numerous charcoal gray fruits in fall and winter. Each fruit can hold up to four seeds. It has been reported that the plant can produce over 1000 seeds / m2.
Issues and Impacts:
After planting for dune restoration in North Carolina, the plant quickly became a monoculture. It is allelopathic creating a hydrophobic situation in the soil. This situation can cause the decline of native plants, such as sea oats (Uniola paniculata). As the plant becomes more of a shrub it decreases the amount of sunlight reaching the surface further decreasing the smaller native plants and the ability for many to germinate.
This altering of the native dune plant community can have potential impacts on the native faunal communities. There are concerns on its impacts to protected species such as beach mice and nesting sea turtles.
Having a taproot system rather than a fibrous one like the sea oat, can comprise dune integrity during tropical storms. It is known that these dune systems provide protection for natural and developed areas behind them.
Management:
Finding the plants early and removing by hand is the first and best option. The plant is relatively new to the panhandle area and smaller ones are often found. Once the small plants are found, you can simply cut the above ground vine into 2 foot sections and place in a trash bag – you should double bag this. Woody vines may puncture the bag so shorter sections may be needed for those.
Once you reach the taproot you may be able to pull it from the ground, or you may need to dig it out. This method works well in loose dry sandy soils, it may require more digging and cutting if soils are more compacted. If you cannot remove the entire taproot, we recommend spot spraying the remainder with glyphosate. Be careful not to over spray, glyphosate is non-selective and will kill any native plants it comes into contact with.
In cases where the patch of vitex is too large to remove by hand then chemical treatment will be needed. Several studies have been published as to which herbicides are effective. Imazapyr, Triclopyr, and Glyphosate are all products that have been used both in foliage application and cut stem with success. The exact concentrations vary with abundance of plants and surrounding habitats and re-treatments over a few years may be required. We recommend you reach out to your local CISMA or county extension office for more direct help on your situation.
For more information on this EDRR species, contact your local extension office.
References
Invasive Species – Beach Vitex. Rick O’Connor. 2017. UF IFAS Escambia County Blog. http://blogs.ifas.ufl.edu/escambiaco/2017/03/20/invasive-species-beach-vitex/.
Early Detection and Distribution Mapping System (EDDMapS)
https://www.eddmaps.org/
Six Rivers CISMA
https://www.floridainvasives.org/sixrivers/
by Erik Lovestrand | Mar 11, 2021
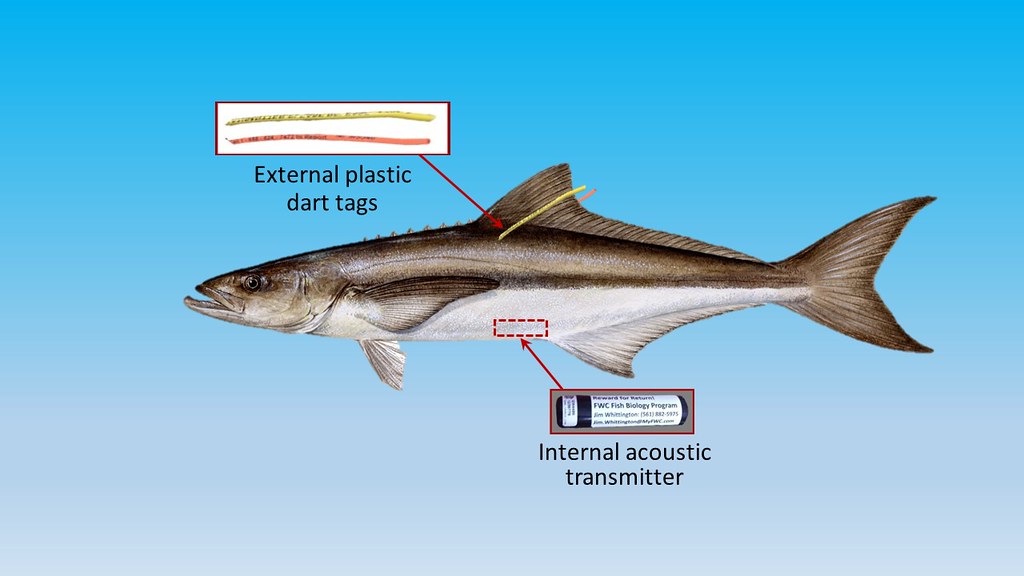
Cobia Researchers use Transmitters as well as Tags to Gather Data on Migratory Patterns
I must admit to having very limited personal experience with Cobia, having caught one sub-legal fish to-date. However, that does not diminish my fascination with the fish, particularly since I ran across a 2019 report from the Gulf States Marine Fisheries Commission titled “Management Profile for Gulf of Mexico Cobia.” This 182-page report is definitely not a quick read and I have thus far only scratched the surface by digging into a few chapters that caught my interest. Nevertheless, it is so full of detailed life history, biology and everything else “Cobia” that it is definitely worth a look. This posting will highlight some of the fascinating aspects of Cobia and why the species is so highly prized by so many people.
Cobia (Rachycentron canadum) are the sole species in the fish family Rachycentridae. They occur worldwide in most tropical and subtropical oceans but in Florida waters, we actually have two different groups. The Atlantic stock ranges along the Eastern U.S. from Florida to New York and the Gulf stock ranges From Florida to Texas. The Florida Keys appear to be a mixing zone of sorts where Cobia from both stocks go in the winter. As waters warm in the spring, these fish head northward up the Atlantic and Gulf coasts of Florida. The Northern Gulf coast is especially important as a spawning ground for the Gulf stock. There may even be some sub-populations within the Gulf stock, as tagged fish from the Texas coast were rarely caught going eastward. There also appears to be a group that overwinters in the offshore waters of the Northern Gulf, not making the annual trip to the Keys. My brief summary here regarding seasonal movement is most assuredly an over-simplification and scientists agree more recapture data is needed to understand various Cobia stock movements and boundaries.
Worldwide, the practice of Cobia aquaculture has exploded since the early 2000’s, with China taking the lead on production. Most operations complete their grow-out to market size in ponds or pens in nearshore waters. Due to their incredible growth rate, Cobia are an exceptional candidate for aquaculture. In the wild, fish can reach weights of 17 pounds and lengths of 23 inches in their first year. Aquaculture-raised fish tend to be shorter but heavier, comparatively. The U.S. is currently exploring rules for offshore aquaculture practices and cobia is a prime candidate for establishing this industry domestically.
Spawning takes place in the Northern Gulf from April through September. Male Cobia will reach sexual maturity at an amazing 1-2 years and females within 2-3 years. At maturity, they are able to spawn every 4-6 days throughout the spawning season. This prolific nature supports an average annual commercial harvest in the Gulf and East Florida of around 160,000 pounds. This is dwarfed by the recreational fishery, with 500,000 to 1,000,000 pounds harvested annually from the same region.
One of the Cobia’s unique features is that they are strongly attracted to structure, even if it is mobile. They are known to shadow large rays, sharks, whales, tarpon, and even sea turtles. This habit also makes them vulnerable to being caught around human-made FADs (Fish Aggregating Devices). Most large Cobia tournaments have banned the use of FADs during their events to recapture a more sporting aspect of Cobia fishing.
To wrap this up I’ll briefly recount an exciting, non-fish-catching, Cobia experience. My son and I were in about 35 feet of water off the Wakulla County coastline fishing near an old wreck. Nothing much was happening when I noticed a short fin breaking the water briefly, about 20 yards behind a bobber we had cast out with a dead pinfish under it. I had not seen this before and was unaware of what was about to happen. When the fish ate that bait and came tight on the line the rod luckily hung up on something in the bottom of the boat. As the reel’s drag system screamed, a Cobia that I gauged to be 4-5 feet long jumped clear out of the water about 40 yards from us. Needless to say, by the time we gained control of the rod it was too late; a heartbreaking missed opportunity. Every time we have been fishing since then, I just can’t stop looking for that short, pointed fin slicing towards one of our baits.
by Chris Verlinde | Mar 5, 2021
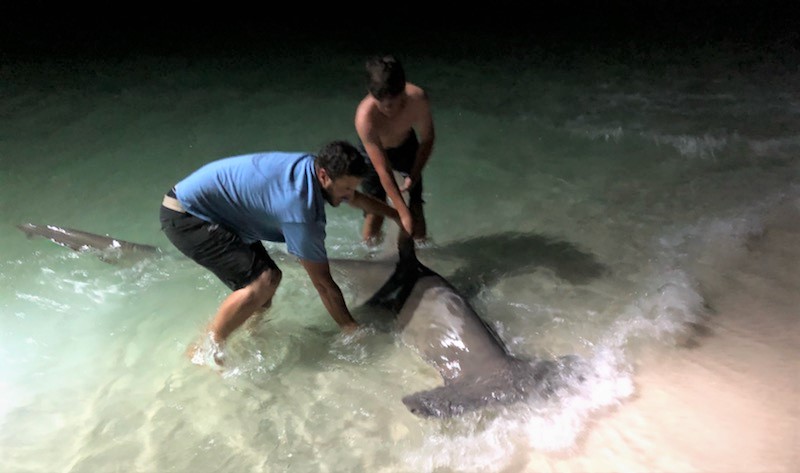
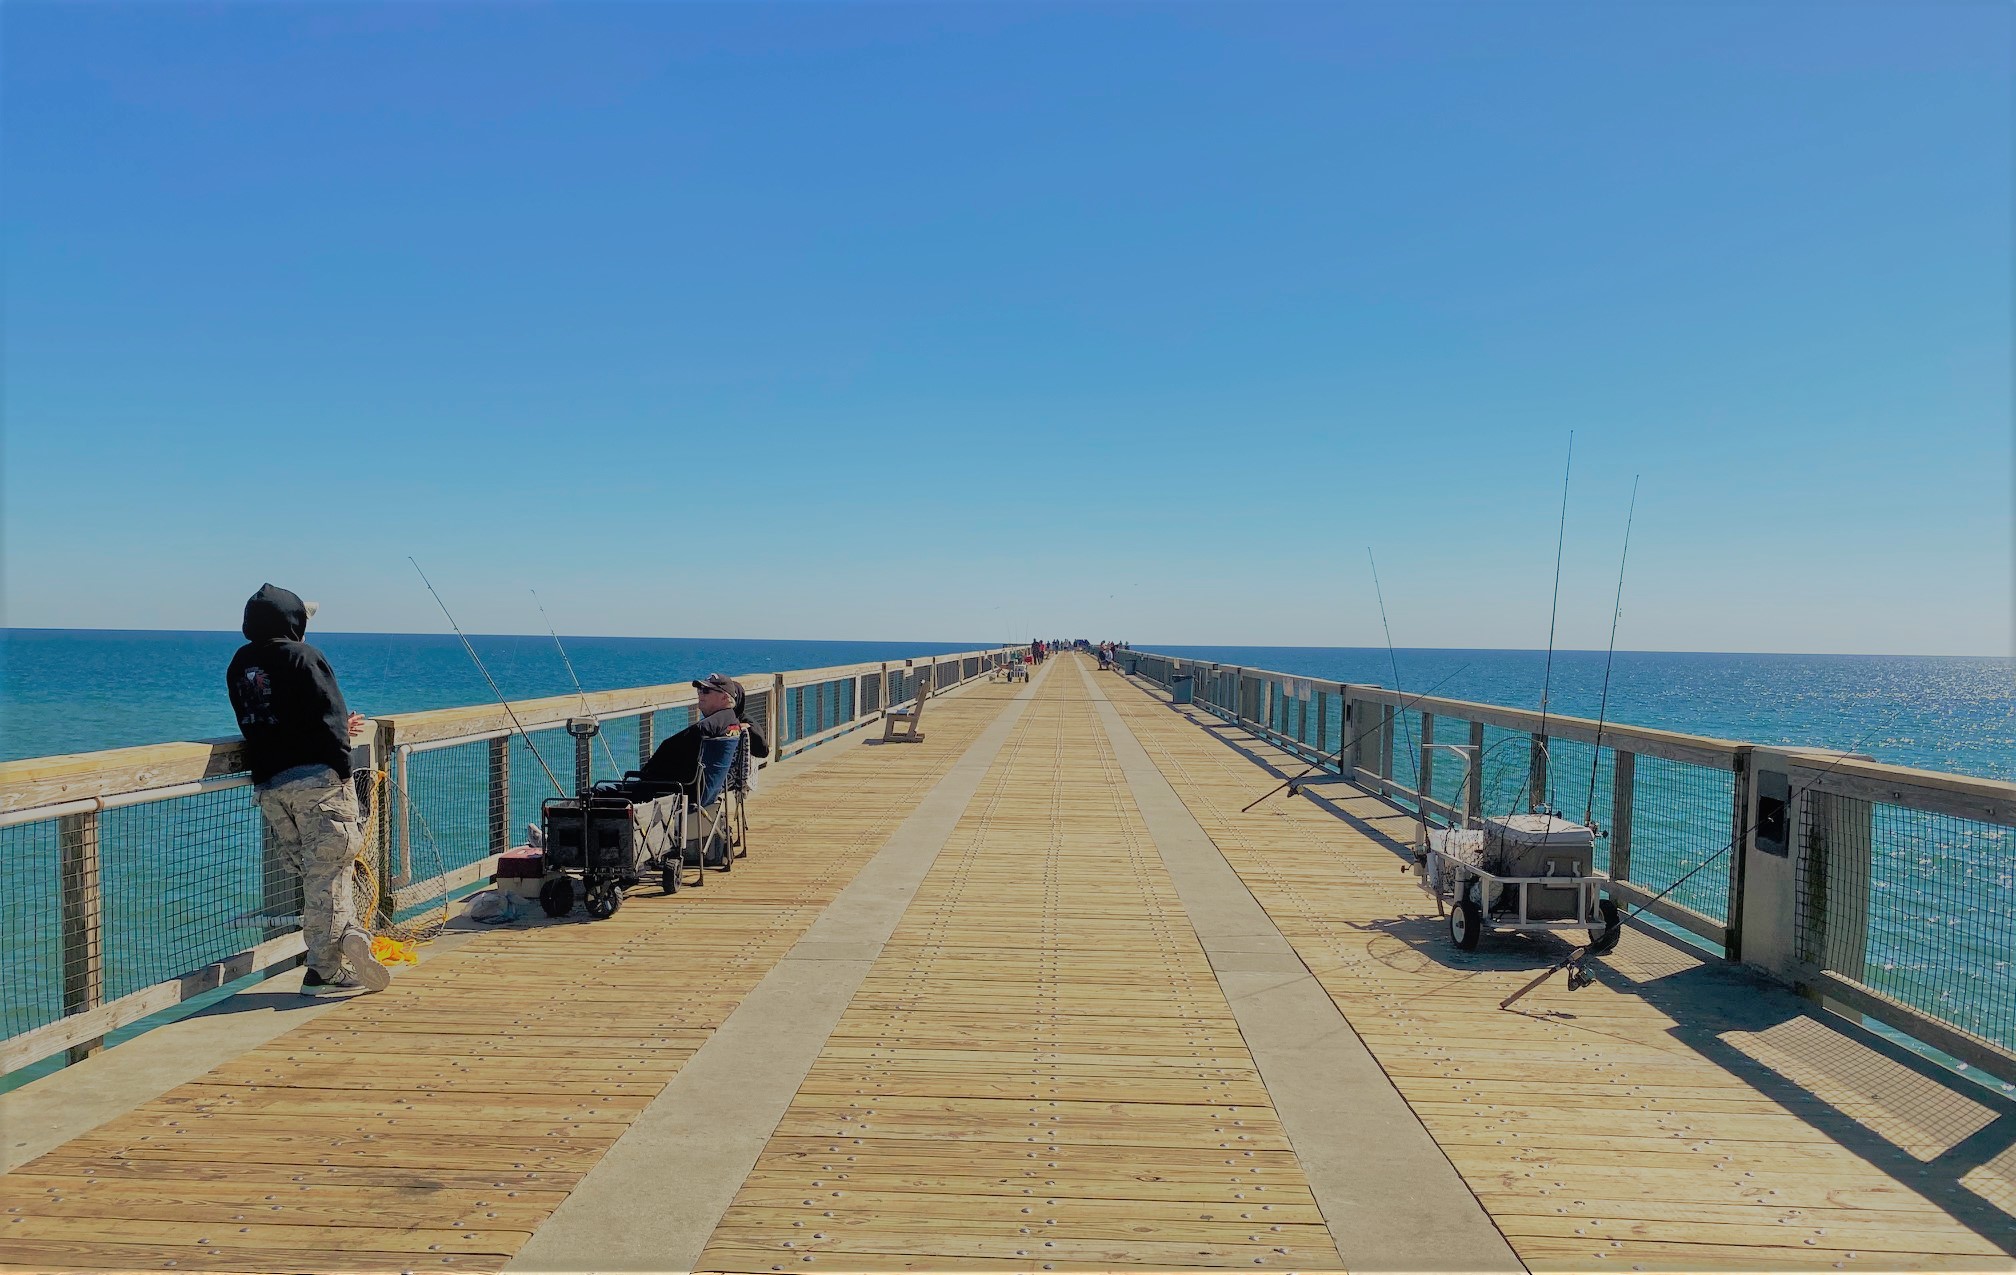
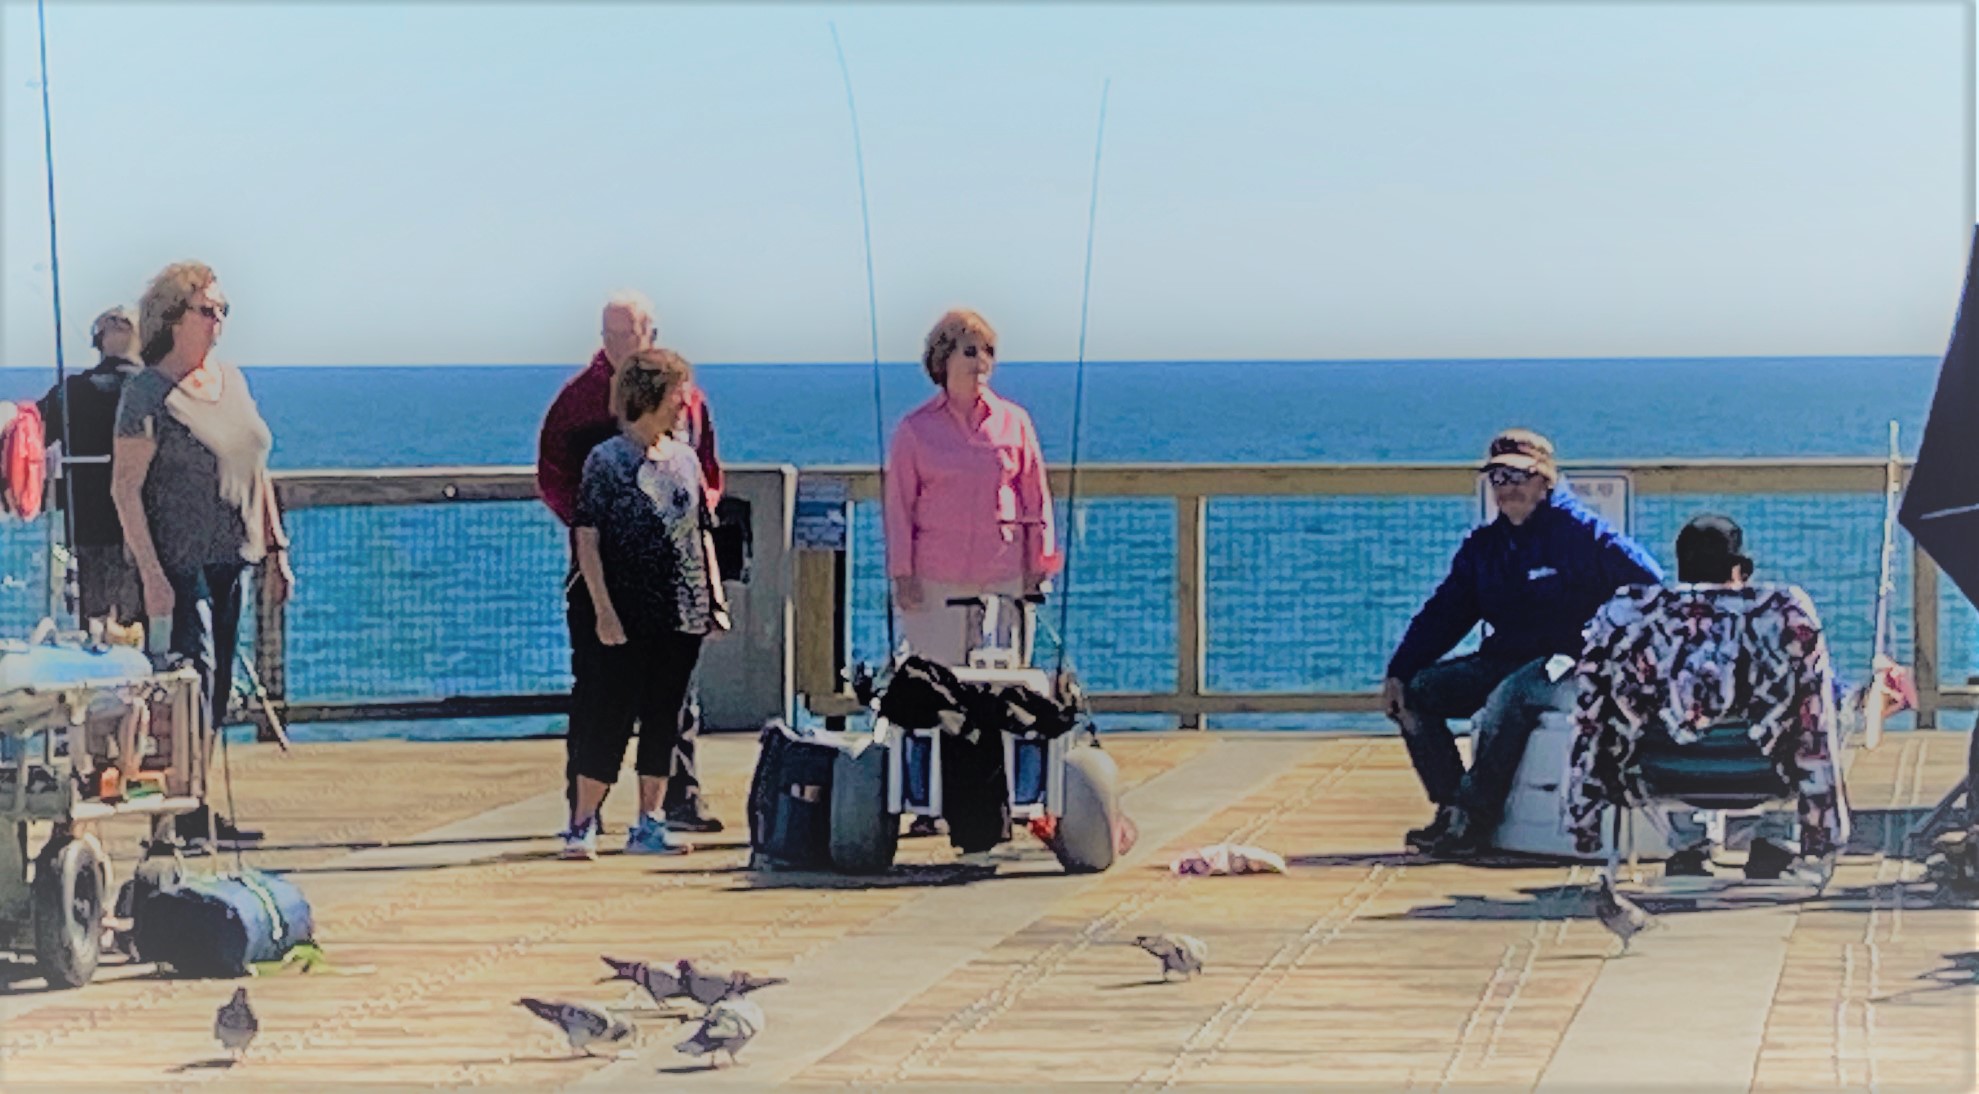
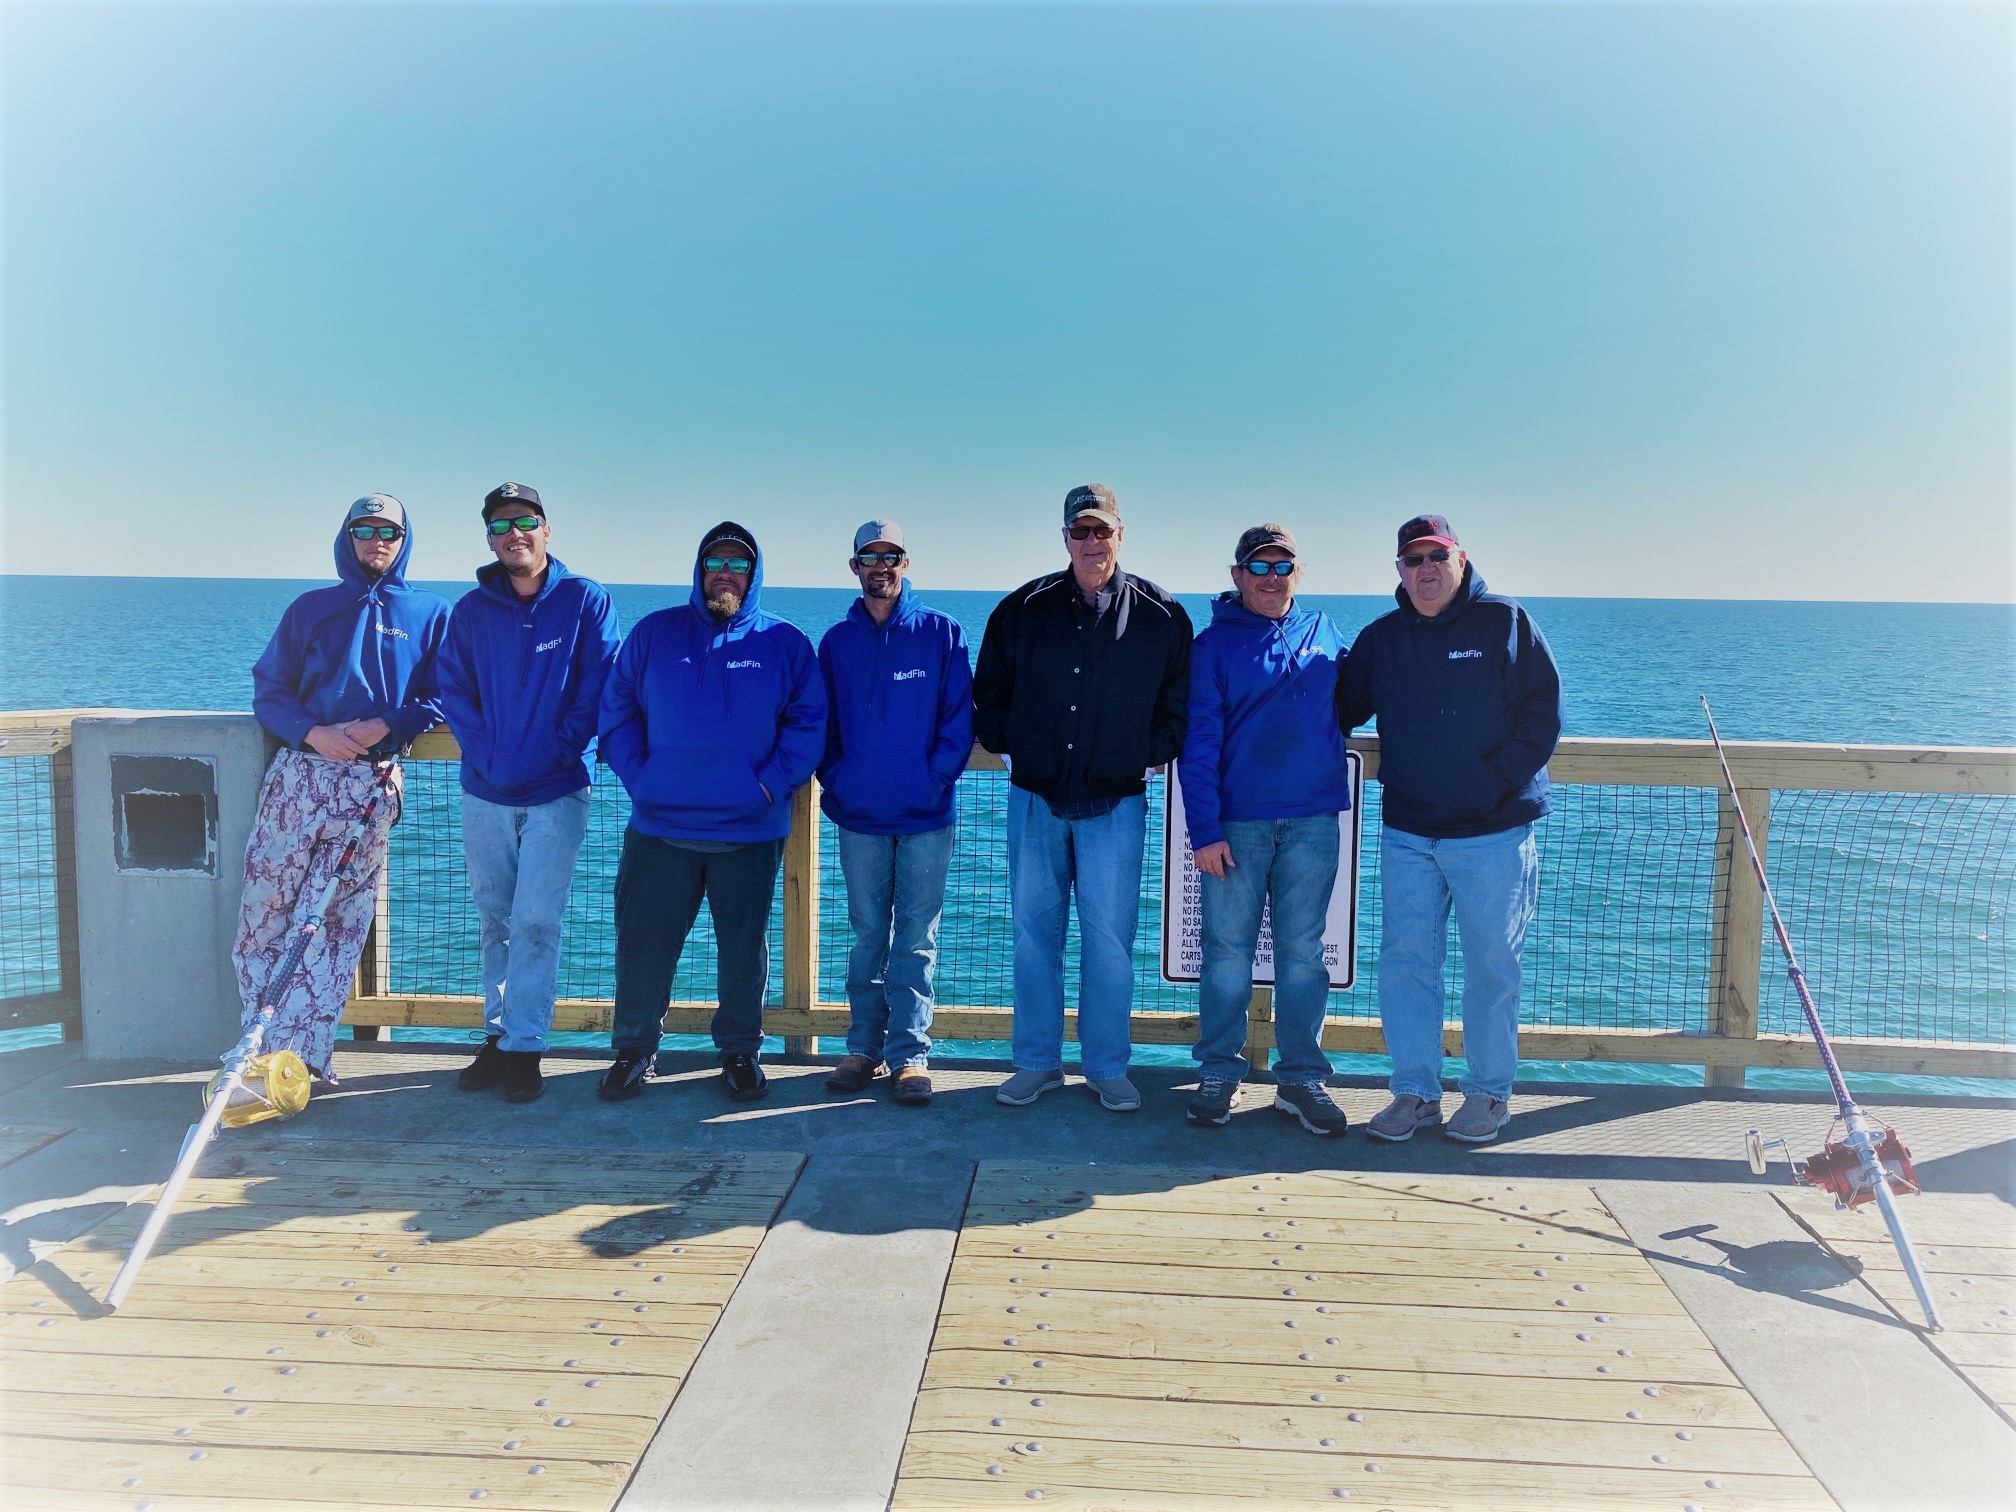
On most days, if you walk to the end of the Navarre Beach Fishing Pier, you will find a group of shark anglers that provide valuable data to the National Oceanic and Atmospheric Administration (NOAA) Cooperative Volunteer Shark Tagging program. Led by Earnie Polk, 50-60 team members have participated in the cooperative tagging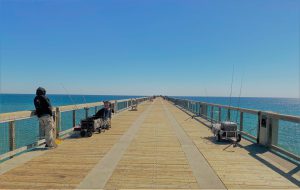 program in the twenty-five years he has been involved.
This group not only provides research data to NOAA, but are also stewards of pier etiquette, Navarre Beach and the surrounding area. Tourists and locals alike are treated to stories of local history, fish tales and general information about the area from Earnie and Team True Blue members. In addition, visitors may see a shark tagged and released or the group catching large fish to be used for shark bait
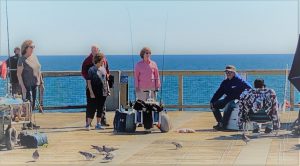
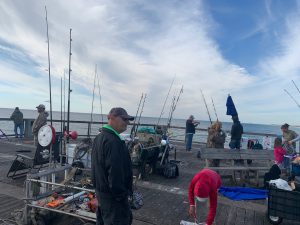

Photo Credit Earnie Polk
The NOAA Cooperative Shark Tagging program has been in existence since 1962. Today thousands of anglers along the Gulf of Mexico and Atlantic Coast have tagged more than 295,000 sharks representing 52 different species. More than 17,500 sharks have been recaptured! This program provides information on shark migration patterns, numbers, locations, migrations, age and growth rates, behavior and mortality.
Earnie estimates he has tagged more than one-thousand sharks for the program. He has refined handling methods to have the least impact on the animal to ensure the survival of the shark after release. The team brings the shark to shore to measure the length and tag the shark just behind the dorsal fin. 
Earnie shared an interesting story about tagging at least eighty Dusky sharks during a red tide event during the late fall of 2015. He noticed as the north winds blew the red tide out, an open area was created along the coast. This allowed clear water for the sharks to travel closer to shore and within distance of the tag and release team.
Today, the tiger shark is the most common shark the team tags and releases. Recently, the team tagged and released a 12’6” tiger shark. Randy Meredith, of the Navarre Newspaper agreed to share the video he edited of the Navarre Fishing Pier and the tag and release of the tiger shark in February 2021.
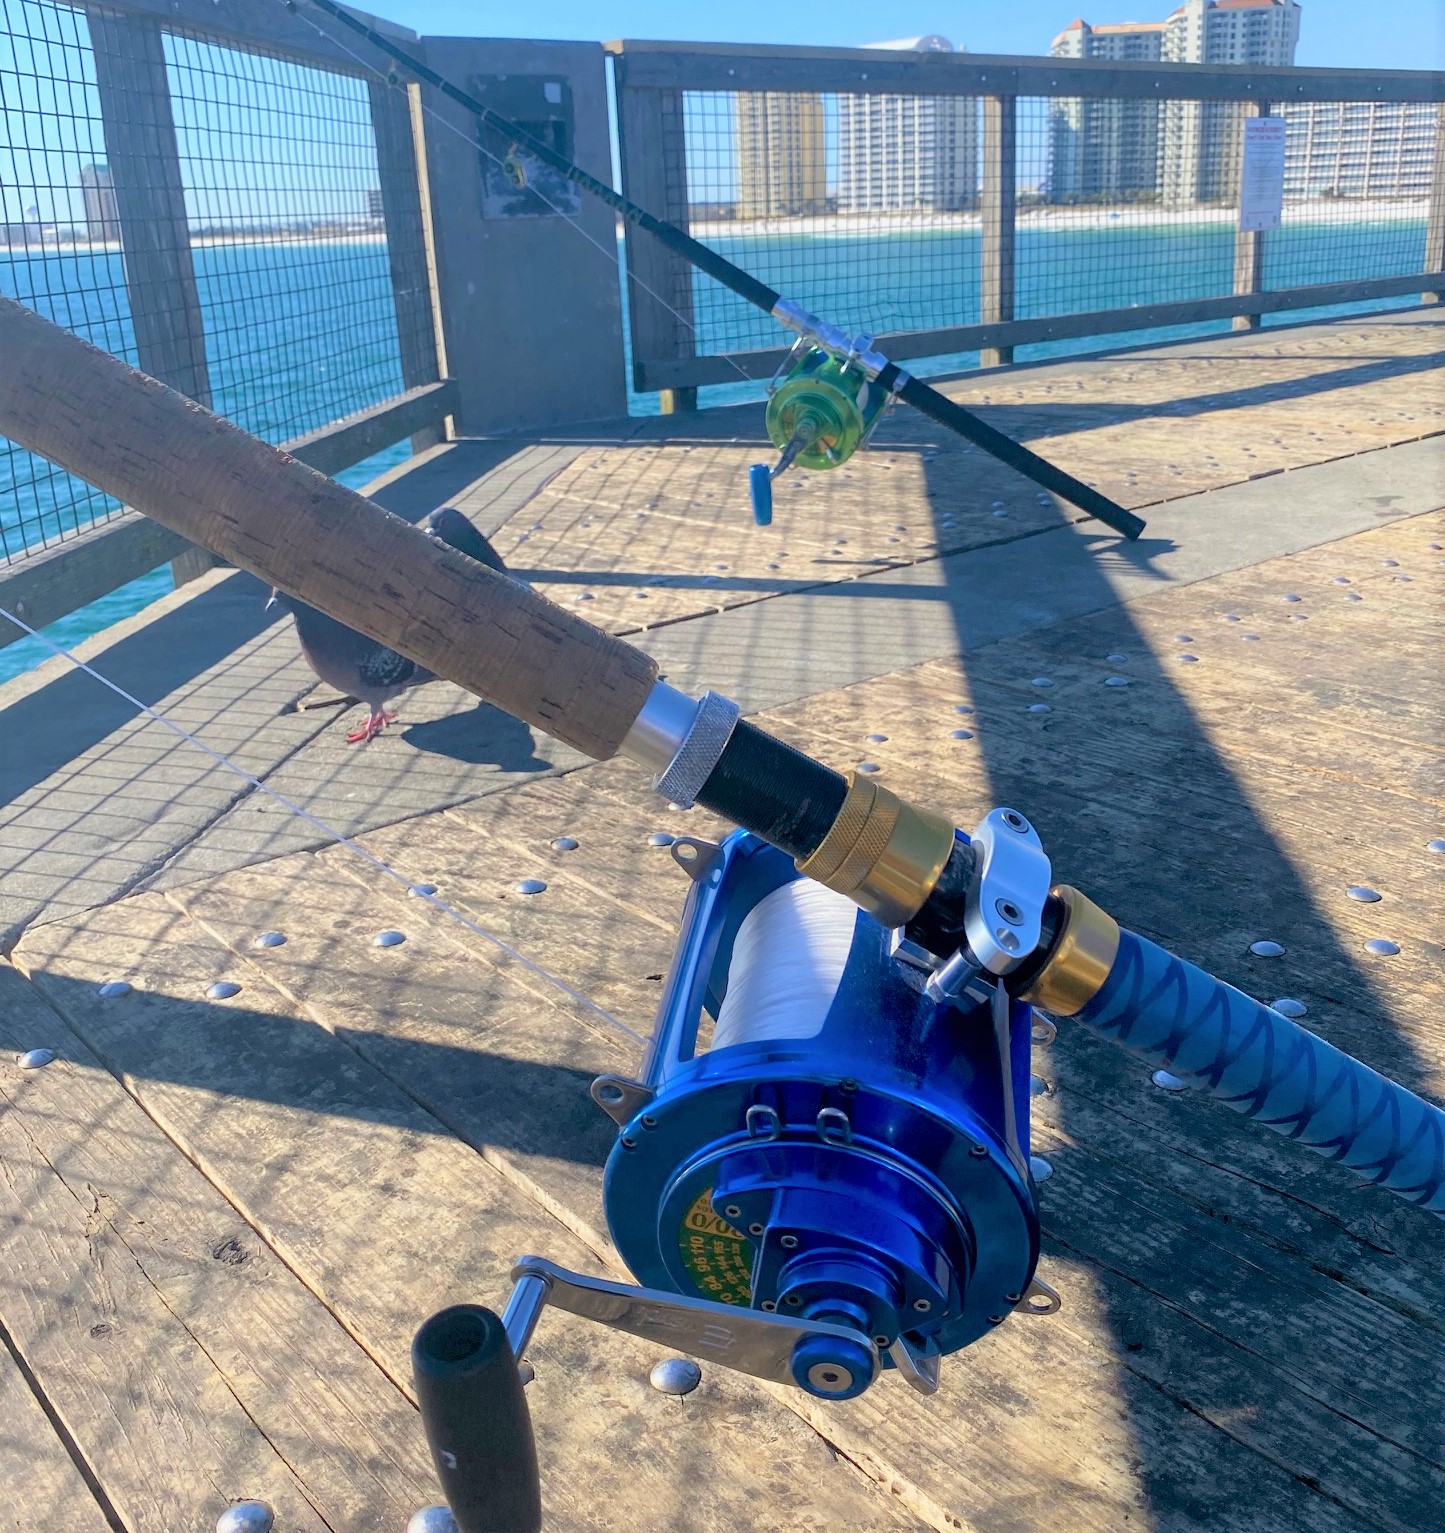
 The team uses heavy gear, 200-pound test line and Everol reels that have drag pressure for a shorter fight to reduce stress on the animal for a better survival rate. Gear is spread along the rails at the end of the pier. Baited lines range from approximately 75 to 400 yards off the end of the pier. You probably wonder how they get their line 400 yards off the pier. Earnie has modified a fiberglass kayak with a battery powered motor. It is lowered to the surface of the water; team members drop their lines onto the kayak and Earnie pilots the kayak out to deeper water.
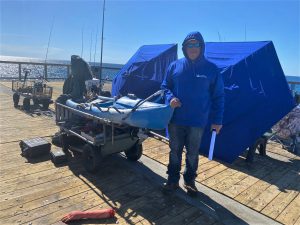
Their strategy is that by dropping more lines, at different depths and locations a shark is bound to trip over one of the lines. They use bait they catch on the pier or other fishing trips. Something big had hit on a cow nose ray over the weekend, so most members were using rays for bait. One team member said, “if the fish had hit on a watermelon, we all would be using watermelon for bait.” These guys have a great sense of humor!!
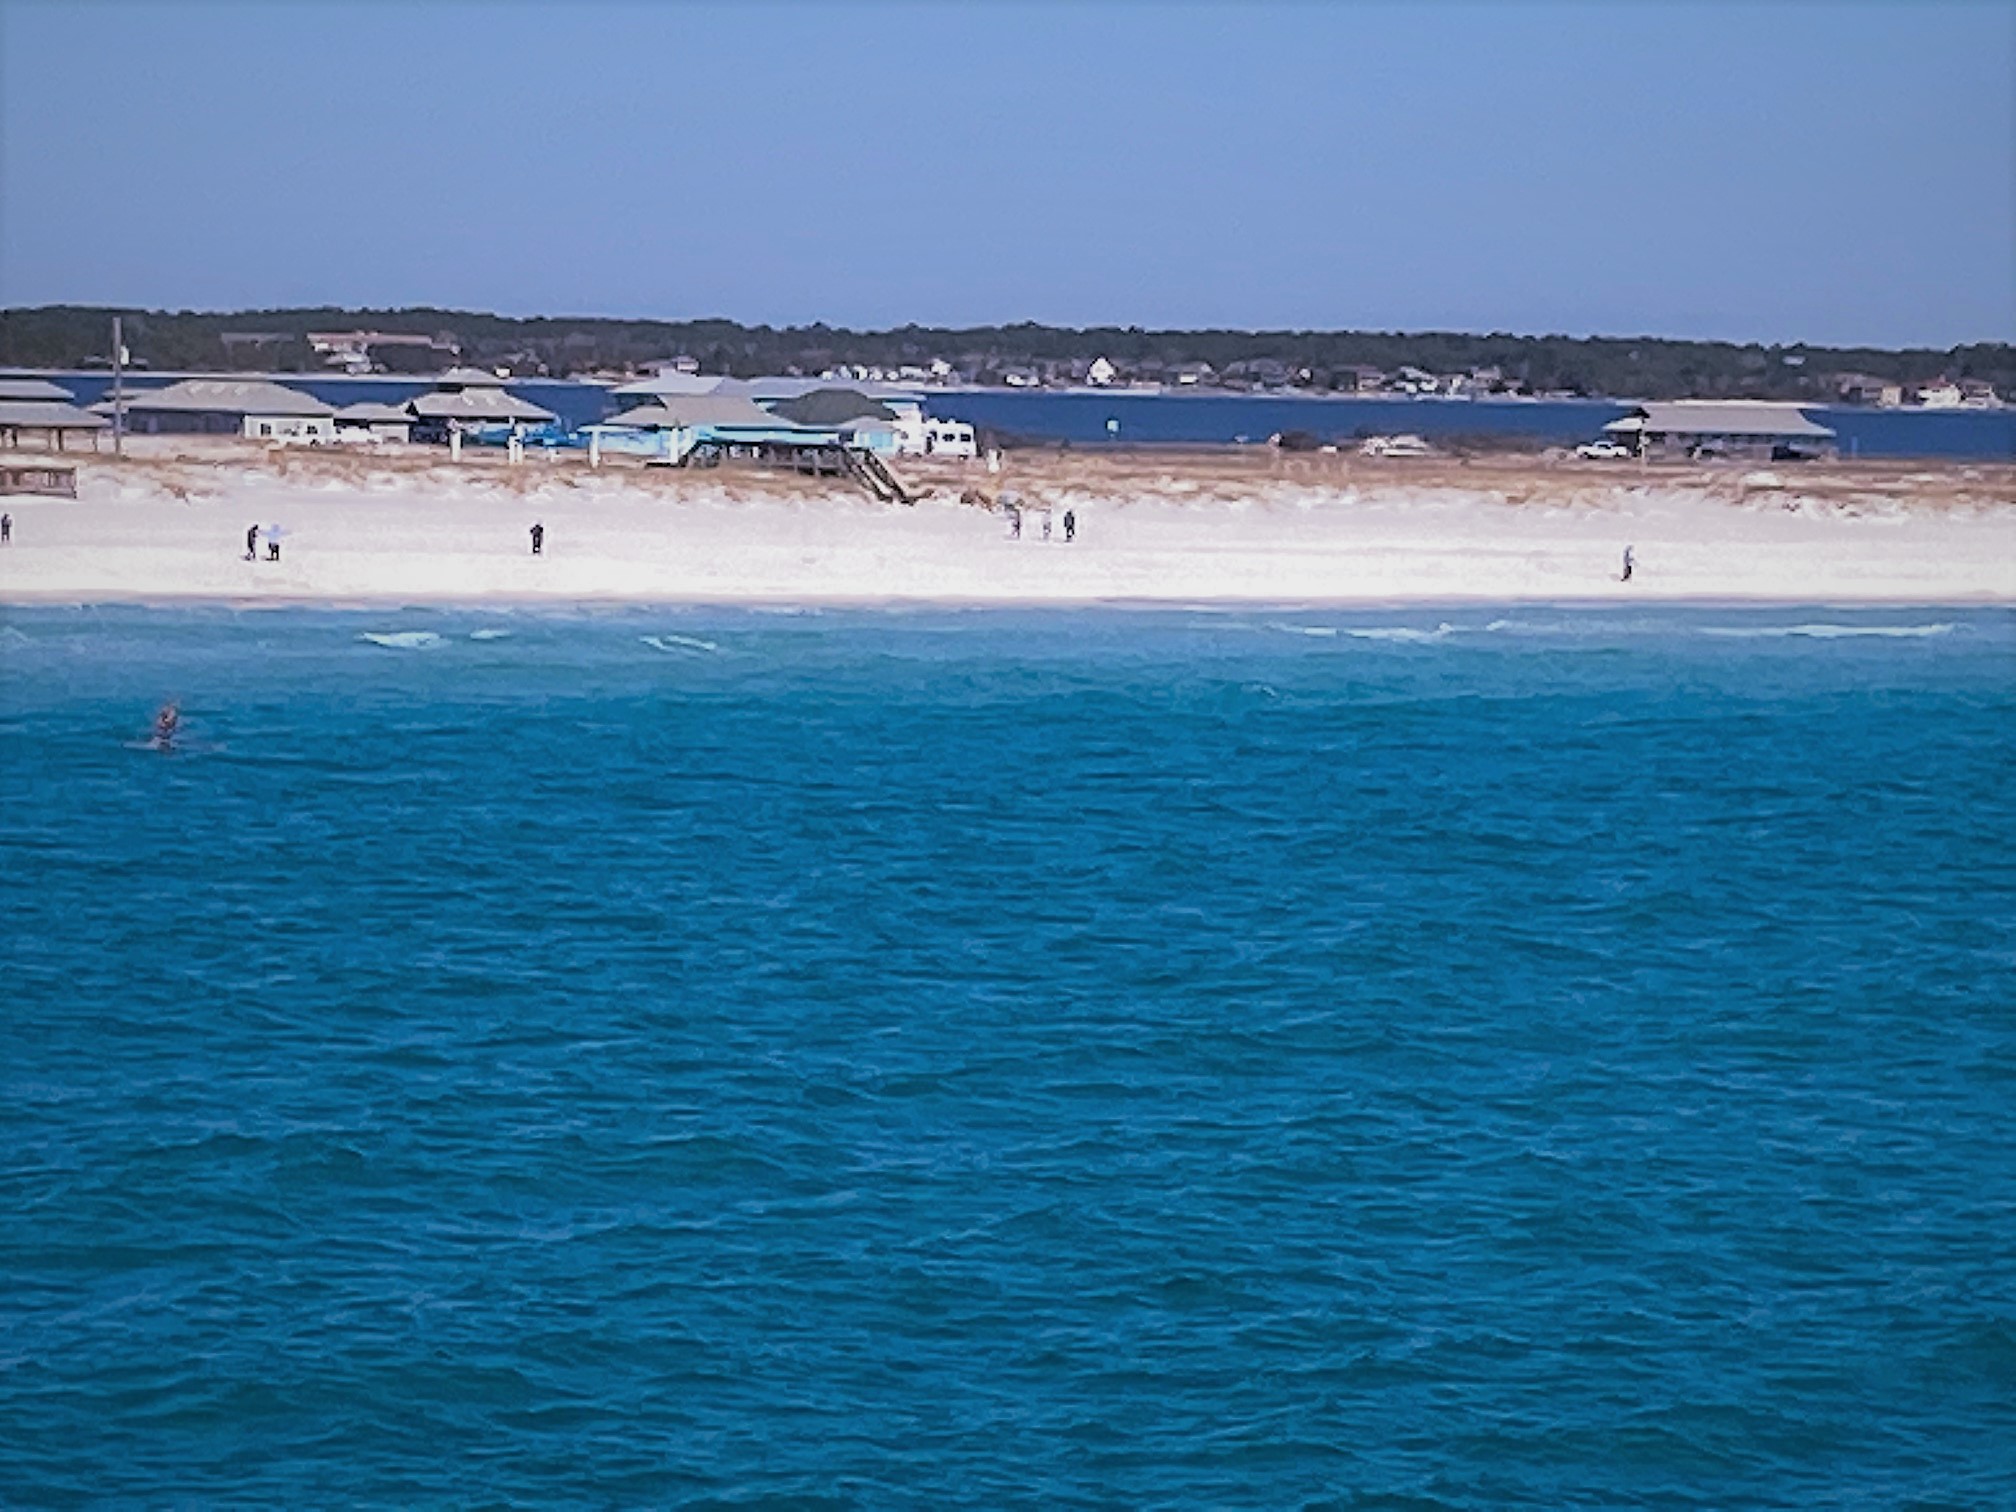
Make sure that the next time you visit Navarre Beach, you take time to walk out to the end of the fishing pier to learn about local sharks, 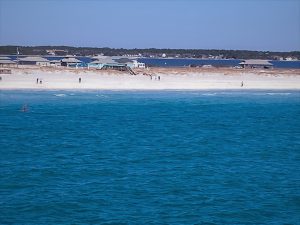 history and the area from these interesting, funny and helpful anglers. On clear days you may see sharks, rays, sea turtles and other types of marine life as you venture out.
Be sure to stop at the pier store to pay the $1.00 per-person fee to enjoy the view!
by Scott Jackson | Feb 26, 2021
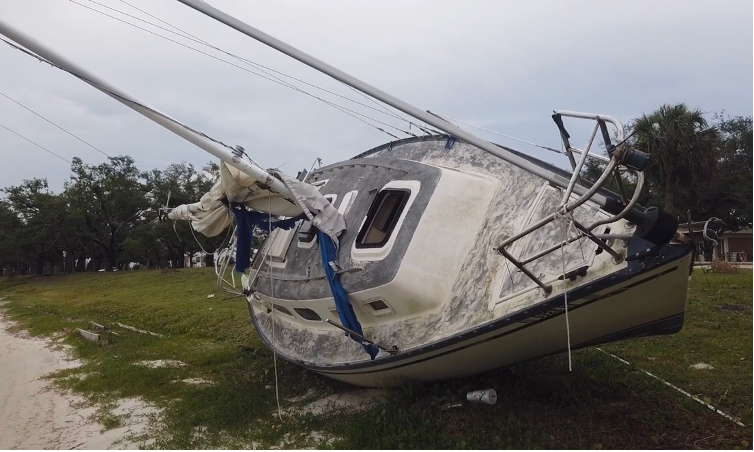
A storm impacted sailboat rests along the shoreline of Carl Gray Park near Gulf Coast State College. This vessel was removed after Panama City Law Enforcement Officers submitted the case for judicial processing. Vessels like this one, once legally processed, can be removed with the Hurricane Michael Marine Debris Removal Funds or by utilizing private funding sources. Photo by L. Scott Jackson
By L. Scott Jackson and Brittany Stark | UF/IFAS Extension Bay County and Florida Sea Grant
I received a phone call requesting an interview from a California based news outlet the day before Hurricane Michael made landfall October 10, 2018. The phone call came as I put the final hurricane shutter on my own home. I had spent the day preparing, bagging sand for old friends and new ones, I met at the sand pile in Lynn Haven. The day’s experience began to sink in – everyone is preparing for a major hurricane! The interviewer asked, “What concerns you the most about this storm?” I thought for second, “What concerns me the most, the Gulf of Mexico hasn’t seen a cold front this year. This is as hot as the Gulf can get, which can fuel large hurricanes.” I couldn’t have imagined what would happen in the next 24 hours after I spoke those words, despite how ominous they were.
In many ways, Michael was our version of the “Perfect Storm”. In the subsequent months and now years, Michael’s extensive devastation continues to confound residents and those responding to provide help.
Emergency responders with the Coast Guard and Florida Fish and Wildlife with Emergency Support Function 10 (ESF-10) worked effectively to address high priority vessels and marine debris problems immediately after Hurricane Michael. According to a media release January 11, 2019, “ESF-10 response teams have completed the following in their efforts to reduce the potential impact to Florida’s marine environment: Assessed 1,370 displaced, wrecked, sunken or beached vessels – 175 vessels mitigated and/or removed from the environment.”
I have been working with a team of professionals from the University of Florida, Florida Fish and Wildlife Commission, and local county Boards of County Commissioners in Bay, Gulf, and Franklin Counties to acquire funds and setup to clean-up what remains of the Hurricane related debris. The targeted area includes the shorelines of St Andrew, St Joe, and Apalachicola Bays. The team received notification of a 3 million dollar grant award from National Oceanic and Atmospheric Administration (NOAA) and the National Fish and Wildlife Foundation (NFWF) in April of 2020. This grant is designed specifically to help communities like ours recover and restore their bays and waterways after hurricanes.
Our project team made extensive use of Aerial Imagery. We estimate about 700 – 800 remaining marine debris targets including 90 vessels in the three-county project area, with the vast majority in Bay County and St Andrew Bay. Our goal is to clean-up and remove over 1,000 tons of marine debris during the project while protecting resources like seagrasses and shoreline vegetation.
The first phase of the vessel removal project was scheduled to begin in 2020. As a result of the pandemic and executive orders from Florida’s Governor, there was a pause to allow vessel owners the opportunity to address violations in this unprecedented situation. This put legal proceedings and investigations on hold from March through September 2020.
As 2021 began we had completed the remaining steps needed to initiate the clean-up and removal activities identified in our grant proposal. FWC completed legal investigations. NOAA finalized the required environmental assessment in consultation with appropriate federal and state agencies. Marine contractors and professionals were qualified and selected. We also employed two dedicated staff to work with impacted property owners that need assistance with shoreline debris and storm impacted vessels in Bay, Gulf, and Franklin Counties.
Our project Manager is Frank Mancinelli, a long-time Callaway resident and Air Force veteran, with professional experience and training in project management. Frank has a communications degree from Florida State University and a Master of Aeronautical Science / Safety degree from Embry-Riddle Aeronautical University. Our program Assistant is Bree Stark, a Florida native and long-time panhandle resident, who graduated from the University of Florida with a degree in Agricultural Education and Communication.
The number of remaining vessels and marine debris targets are astounding for everyone involved. Especially if it’s your property that is impacted. Each vessel has its own set of challenges that need to be addressed legally and logistically prior to removal. There are many obstacles that our project team can help property owners address.
The Hurricane Michael Debris Removal Team Wants to Hear from You!
Need a Hurricane Michael-impacted vessel removed? The Hurricane Michael Marine Debris Removal Project team wants to help!
If you would like to report a Hurricane Michael vessel in need of removal, contact Bree Stark by calling 850-378-2330 or by emailing bay@ifas.ufl.edu. Even if the vessel isn’t yours or on your property, the team needs your help to verify and expand their database of known sites for clean-up. You can also report Hurricane Michael impacted vessels via our online survey at http://bit.ly/HMVessel
(Portions of this Article Originally Published in the Panama City News Herald)
An Equal Opportunity Institution. UF/IFAS Extension, University of Florida, Institute of Food and Agricultural Sciences, Thomas Obreza, Interim-Dean for UF/IFAS Extension. Single copies of UF/IFAS Extension publications (excluding 4-H and youth publications) are available free to Florida residents from county UF/IFAS Extension offices.
by Laura Tiu | Feb 12, 2021

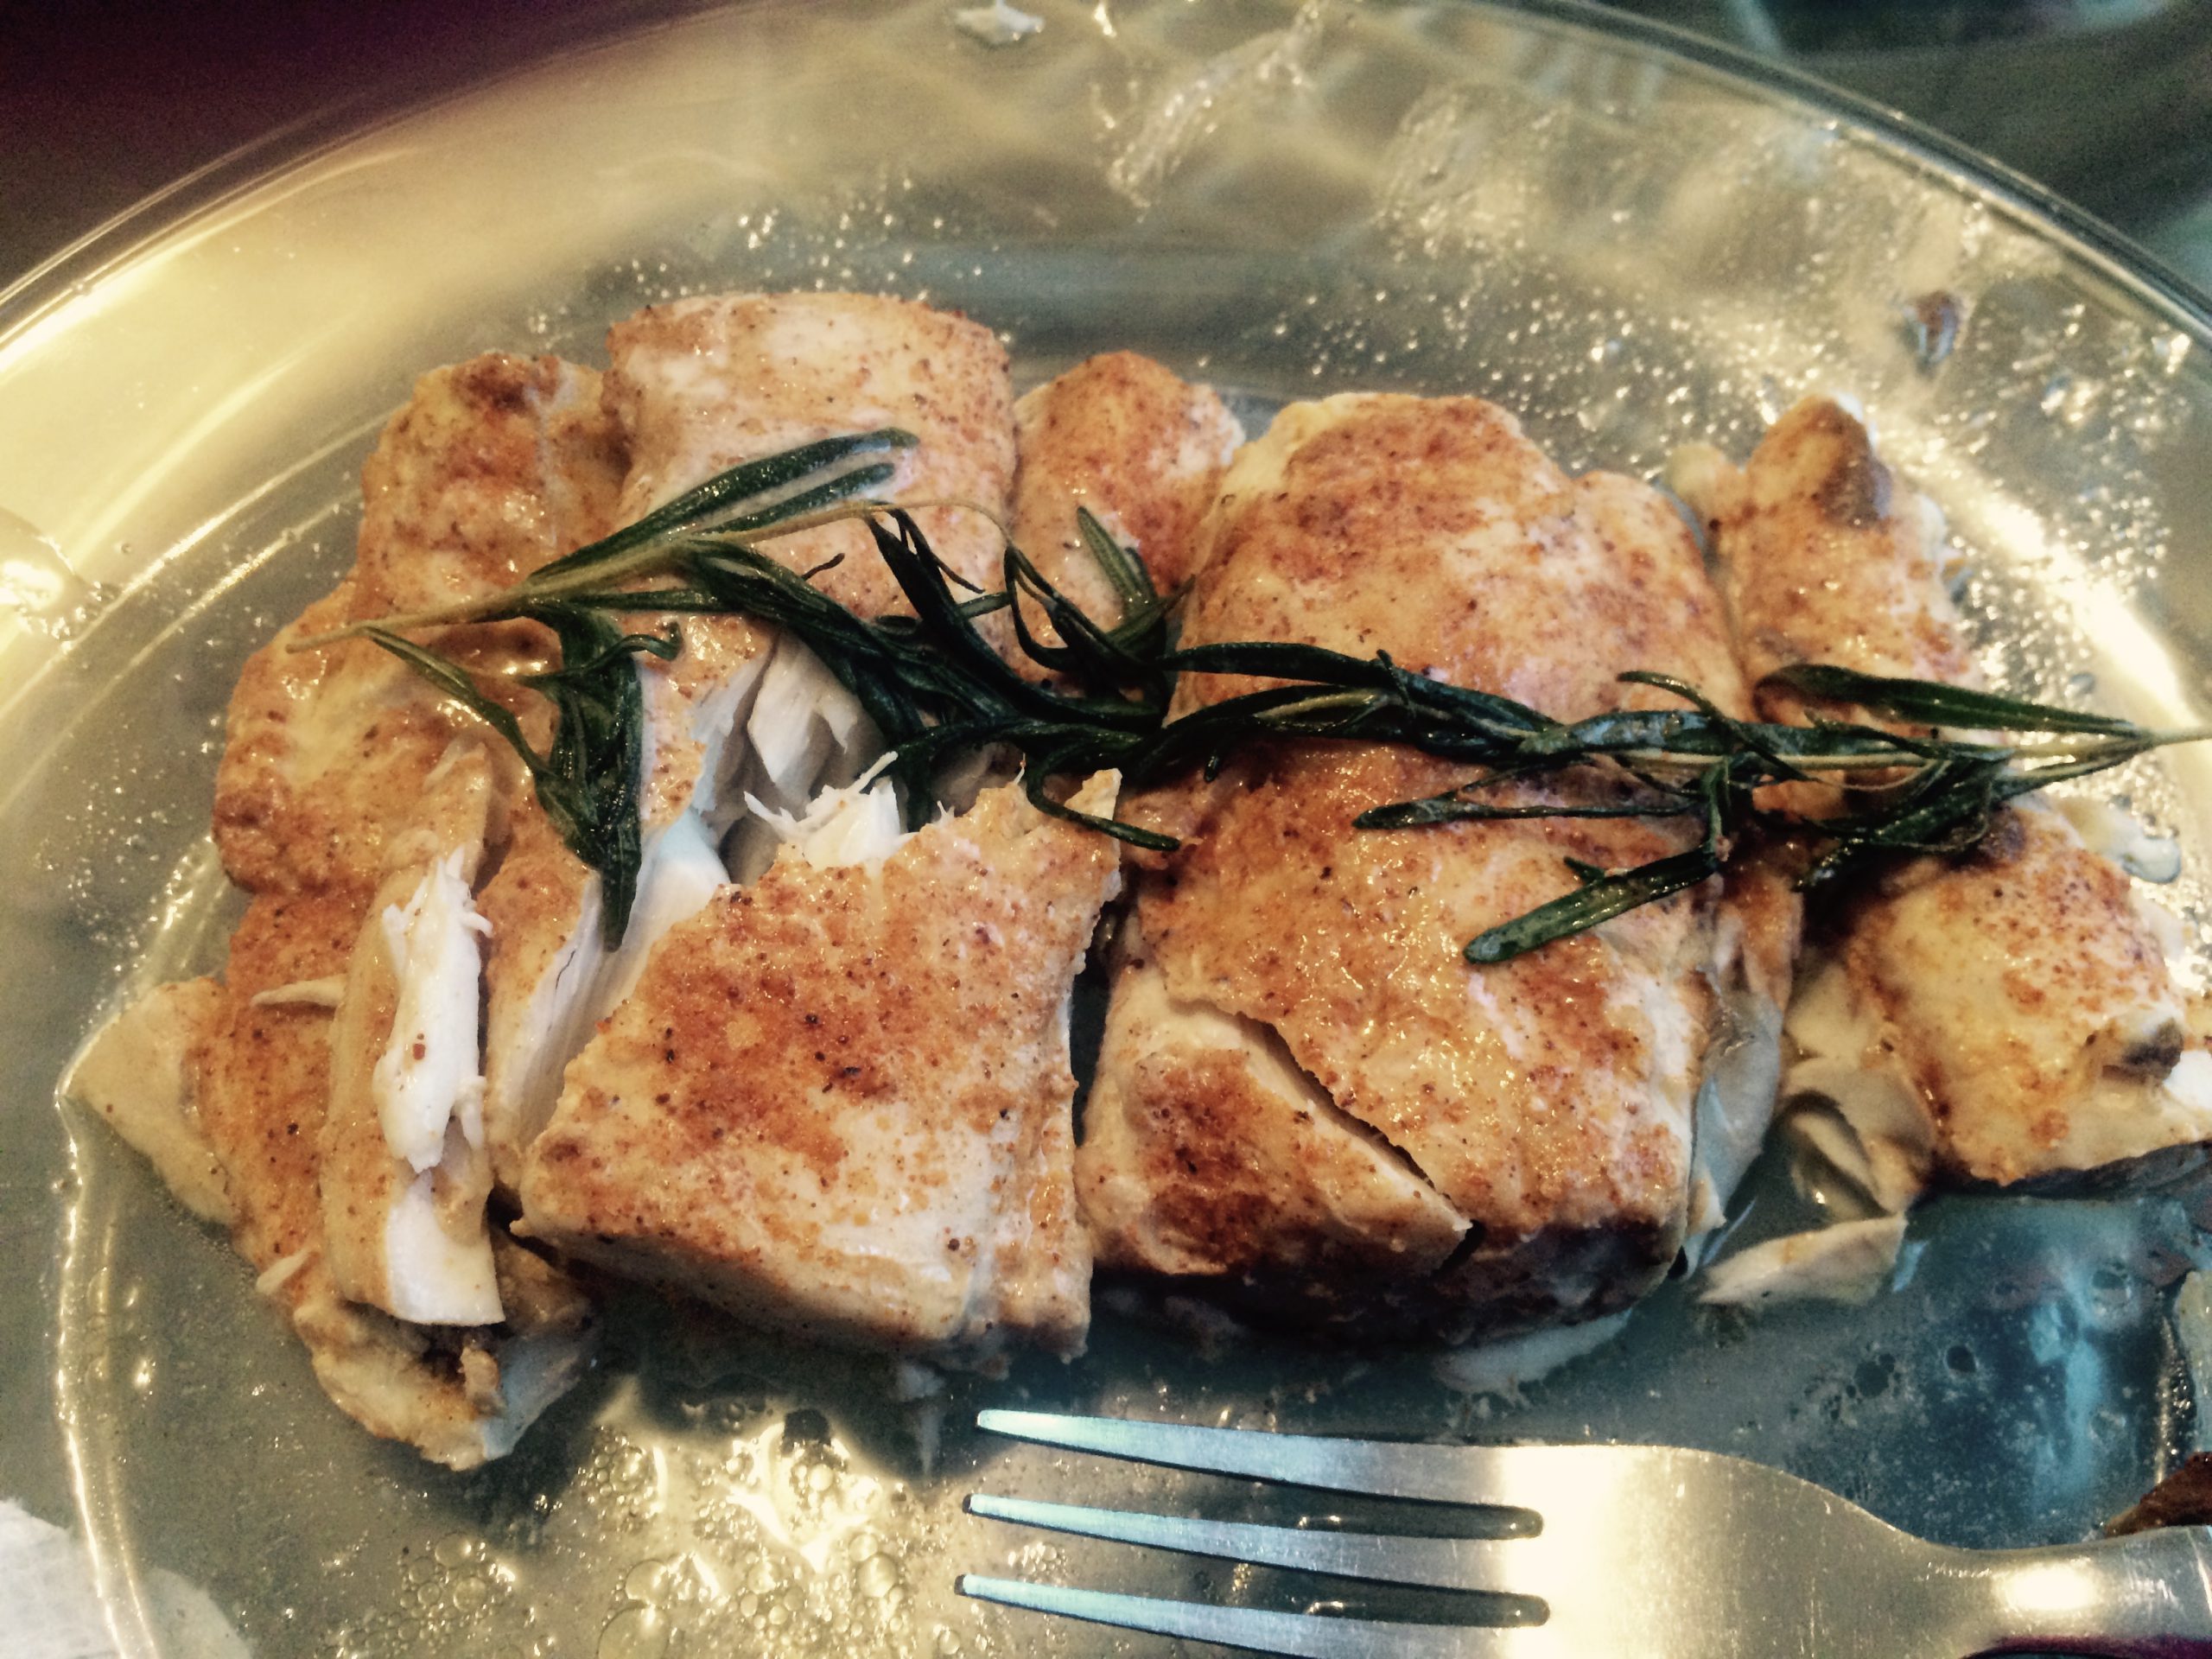
Cooked red snapper (Photo credit: L. Tiu)
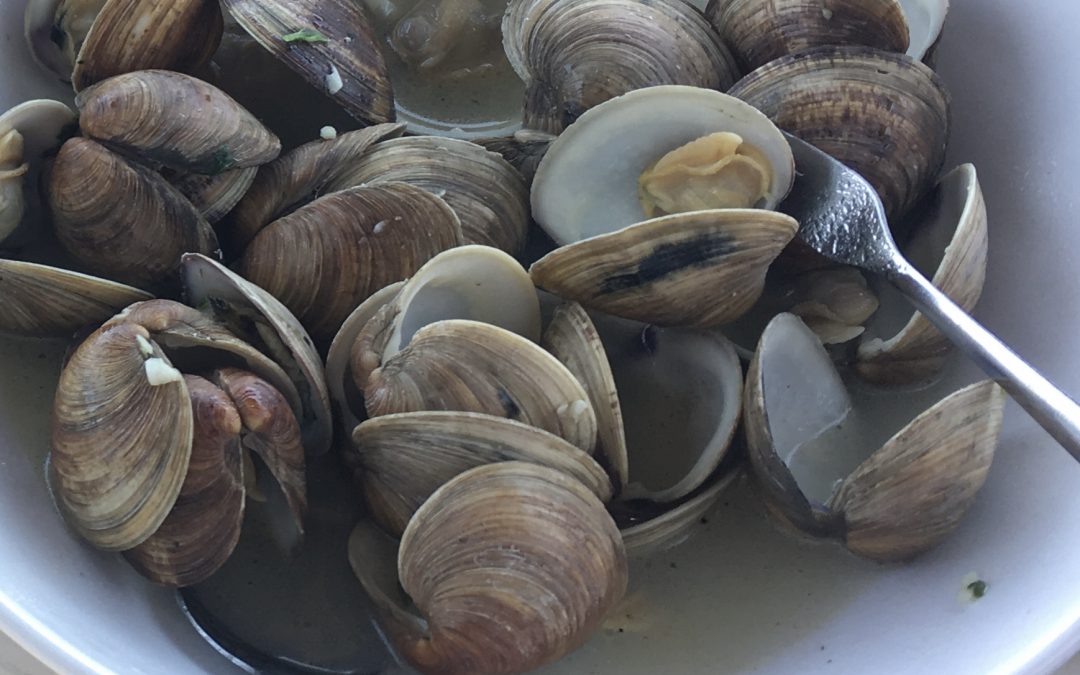
It’s February and for many, our thoughts turn to romance and other things that make the heart happy, like seafood! There is a strong “love” connection between consuming seafood and heart health. Fish and shellfish are low in saturated fat, high in protein and fairly easy and quick to cook. But seafood has a secret weapon in the battle for our hearts as it is considered a good source of omega-3 fatty acids. The health effects of omega-3 fatty acids have been extensively investigated, and it appears that marine fish oil lowers triglycerides, boosts HDL cholesterol, provides other cardiovascular benefits, fights inflammation, and reduces blood clot formation.
The current recommendation from the American Heart Association is 1 to 2 seafood meals, 8 ounces or more, per week be consumed to reduce the risk of congestive heart failure, coronary heart disease, ischemic stroke, and sudden cardiac death, especially when seafood replaces the intake of less healthy foods. This translates into 250 to 500 mg of omega-3 per day or 1750 to 3500 mg per week. For the past 30 years, Americans’ weekly consumption of seafood has hovered around 5 oz per week, with only 10% to 20% of U.S. consumers meeting the 8 ounces minimal federal dietary guideline.
Historically, attention has focused on wild, cold-water, fatty fish like salmon, tuna, mackerel, and sardines as sources of the most omega-3 fatty acids. However, in this case variety is a key. With a growing number of aquaculture fish and shellfish on the market it is important to note that recent studies show for some species of salmon or trout, omega-3 levels are higher in farm-raised species, due to their overall higher fat content. In other good news, many of our local Gulf of Mexico species have been shown to contain good amounts as well. This information means that fishermen and women can eat home-caught fish to get the needed omega-3 fatty acids. Gulf fish are also an excellent source of protein and other nutrients. The following Table contains the omega-3 fatty acid content of some of the most frequently consumed fish and shellfish species in the U.S. So do your heart a favor and start feeding it right.
Omega-3 Content of Frequently Consumed Seafood Products
SEAFOOD PRODUCT
|
|
OMEGA-3s PER 3 OUNCE COOKED PORTION
|
| Herring, Wild (Atlantic & Pacific) |
♥♥♥♥♥ |
>1,500 milligrams |
| Salmon, Farmed (Atlantic) |
♥♥♥♥♥ |
| Salmon, Wild (King) |
♥♥♥♥♥ |
| Mackerel, Wild (Pacific & Jack) |
♥♥♥♥♥ |
SEAFOOD PRODUCT
|
|
OMEGA-3s PER 3 OUNCE COOKED PORTION
|
| Salmon, Wild (Sockeye, Coho, Chum & Pink) |
♥♥♥ |
500 to 1,000 milligrams |
| Sardines, Canned |
♥♥♥ |
| Tuna, Canned (White Albacore) |
♥♥♥ |
| Swordfish, Wild |
♥♥♥ |
| Trout, Farmed (Rainbow) |
♥♥♥ |
| Oysters, Wild & Farmed |
♥♥♥ |
| Mussels, Wild & Farmed |
♥♥♥ |
SEAFOOD PRODUCT
|
|
OMEGA-3s PER 3 OUNCE COOKED PORTION
|
| Tuna, Canned (Light) |
♥♥ |
200 to 500 milligrams |
| Tuna, Wild (Skipjack) |
♥♥ |
| Pollock, Wild (Alaskan) |
♥♥ |
| Rockfish, Wild (Pacific) |
♥♥ |
| Clams, Wild & Farmed |
♥♥ |
| Crab, Wild (King, Dungeness & Snow) |
♥♥ |
| Lobster, Wild (Spiny) |
♥♥ |
| Snapper, Wild |
♥♥ |
| Grouper, Wild |
♥♥ |
| Flounder/Sole, Wild |
♥♥ |
| Halibut, Wild (Pacific & Atlantic) |
♥♥ |
| Ocean Perch, Wild |
♥♥ |
| Squid, Wild (Fried) |
♥♥ |
| Fish Sticks (Breaded) |
♥♥ |
SEAFOOD PRODUCT
|
|
OMEGA-3s PER 3 OUNCE COOKED PORTION
|
| Scallops, Wild |
♥ |
< 200 milligrams |
| Shrimp, Wild & Farmed |
♥ |
| Lobster, Wild (Northern) |
♥ |
| Crab, Wild (Blue) |
♥ |
| Cod, Wild |
♥ |
| Haddock, Wild |
♥ |
| Tilapia, Farmed |
♥ |
| Catfish, Farmed |
♥ |
| Mahimahi, Wild |
♥ |
| Tuna, Wild (Yellowfin) |
♥ |
| Orange Roughy, Wild |
♥ |
| Surimi Product (Imitation Crab) |
♥ |
Source: USDA National Nutrient Database for Standard Reference
by Chris Verlinde | Jan 22, 2021
Santa Rosa Portion of the Oyster Mapping and Assessment Project
Santa Rosa County R.E.S.T.O.R.E. has funded the SRC Oyster shell recycling program and the Pensacola, East and Blackwater Bays Intertidal and Subtidal Oyster Reef mapping and Assessment projects. The Nature Conservancy is managing the oyster reef mapping and assessment project and has contracted with MREC Environmental, LLC to get the work done.
The purpose of the project is to map and assess the condition of known and potential intertidal and subtidal oyster reef resources in the Santa Rosa County portion of the Pensacola Bay system. Results of this mapping project will establish a baseline of the existing locations and condition of oyster resources in SRC. This information will help to guide future restoration projects.
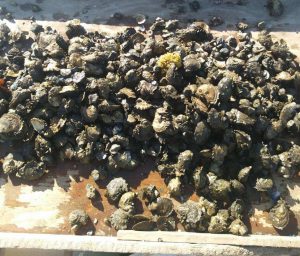
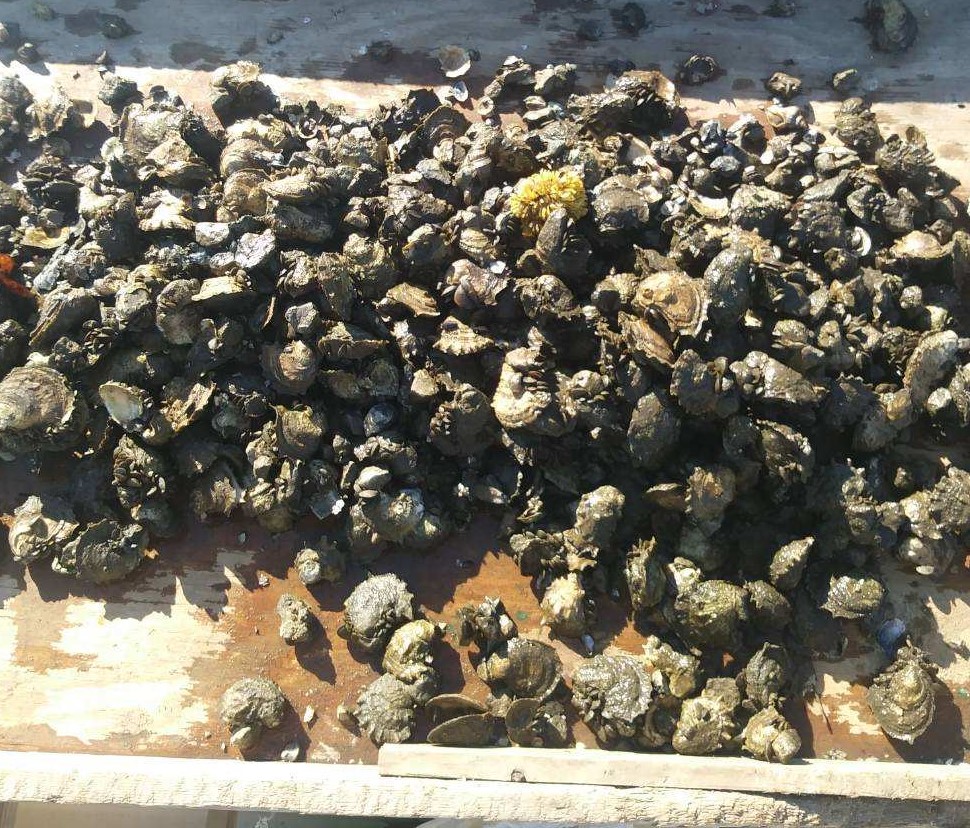
Subtidal oysters are harvested in clumps and are culled using a large knife or hatchet. Photo credit: Calvin Sullivan
Intertidal reefs are typically exposed at low tides and found along the shoreline of our bay system. Sub-tidal reefs are found under water. Gabe Johnson, owner of MREC Environmental has verified existing intertidal reefs using a jet-ski in the fall of 2020. Our bay system does not have as many natural intertidal reefs as in other parts of Florida. There are existing intertidal reefs that have been installed for shoreline protection and habitat enhancement.
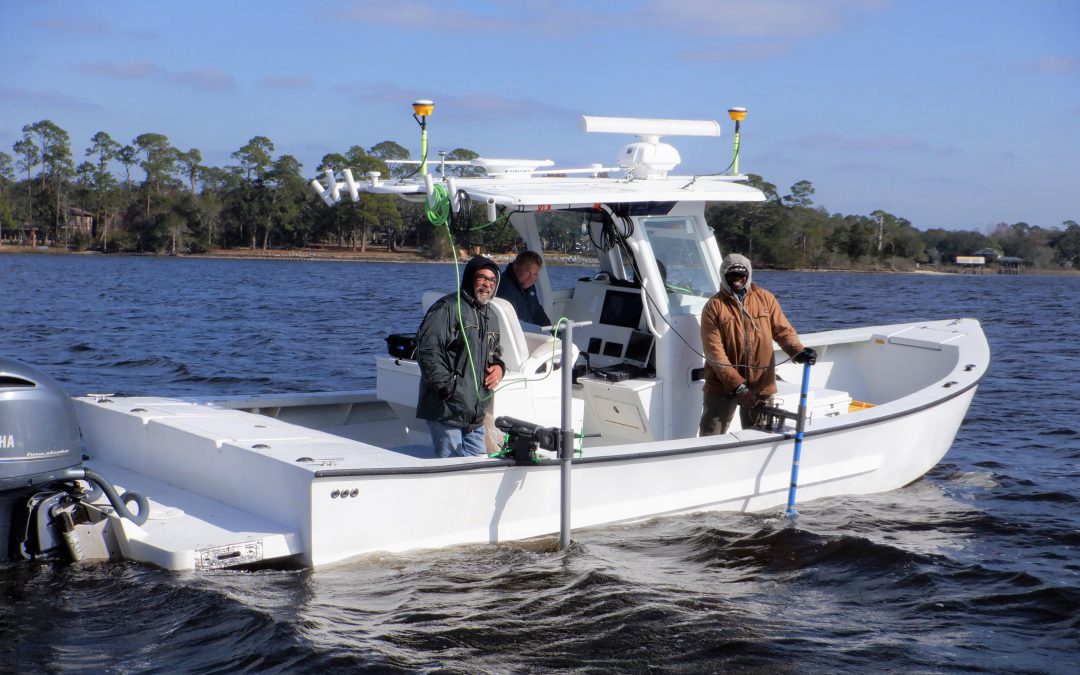
Gabe Johnson and the crew of MREC Environmental are working to complete the initial bottom survey in early 2021. He has set up grids based on historic locations of oyster reefs throughout the Santa Rosa County portion of the Pensacola Bay system. He will then verify his findings by diving sites where oyster shell was found during the bottom survey.

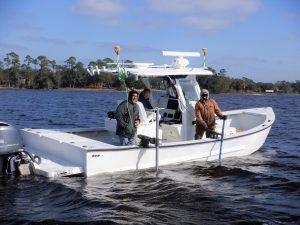
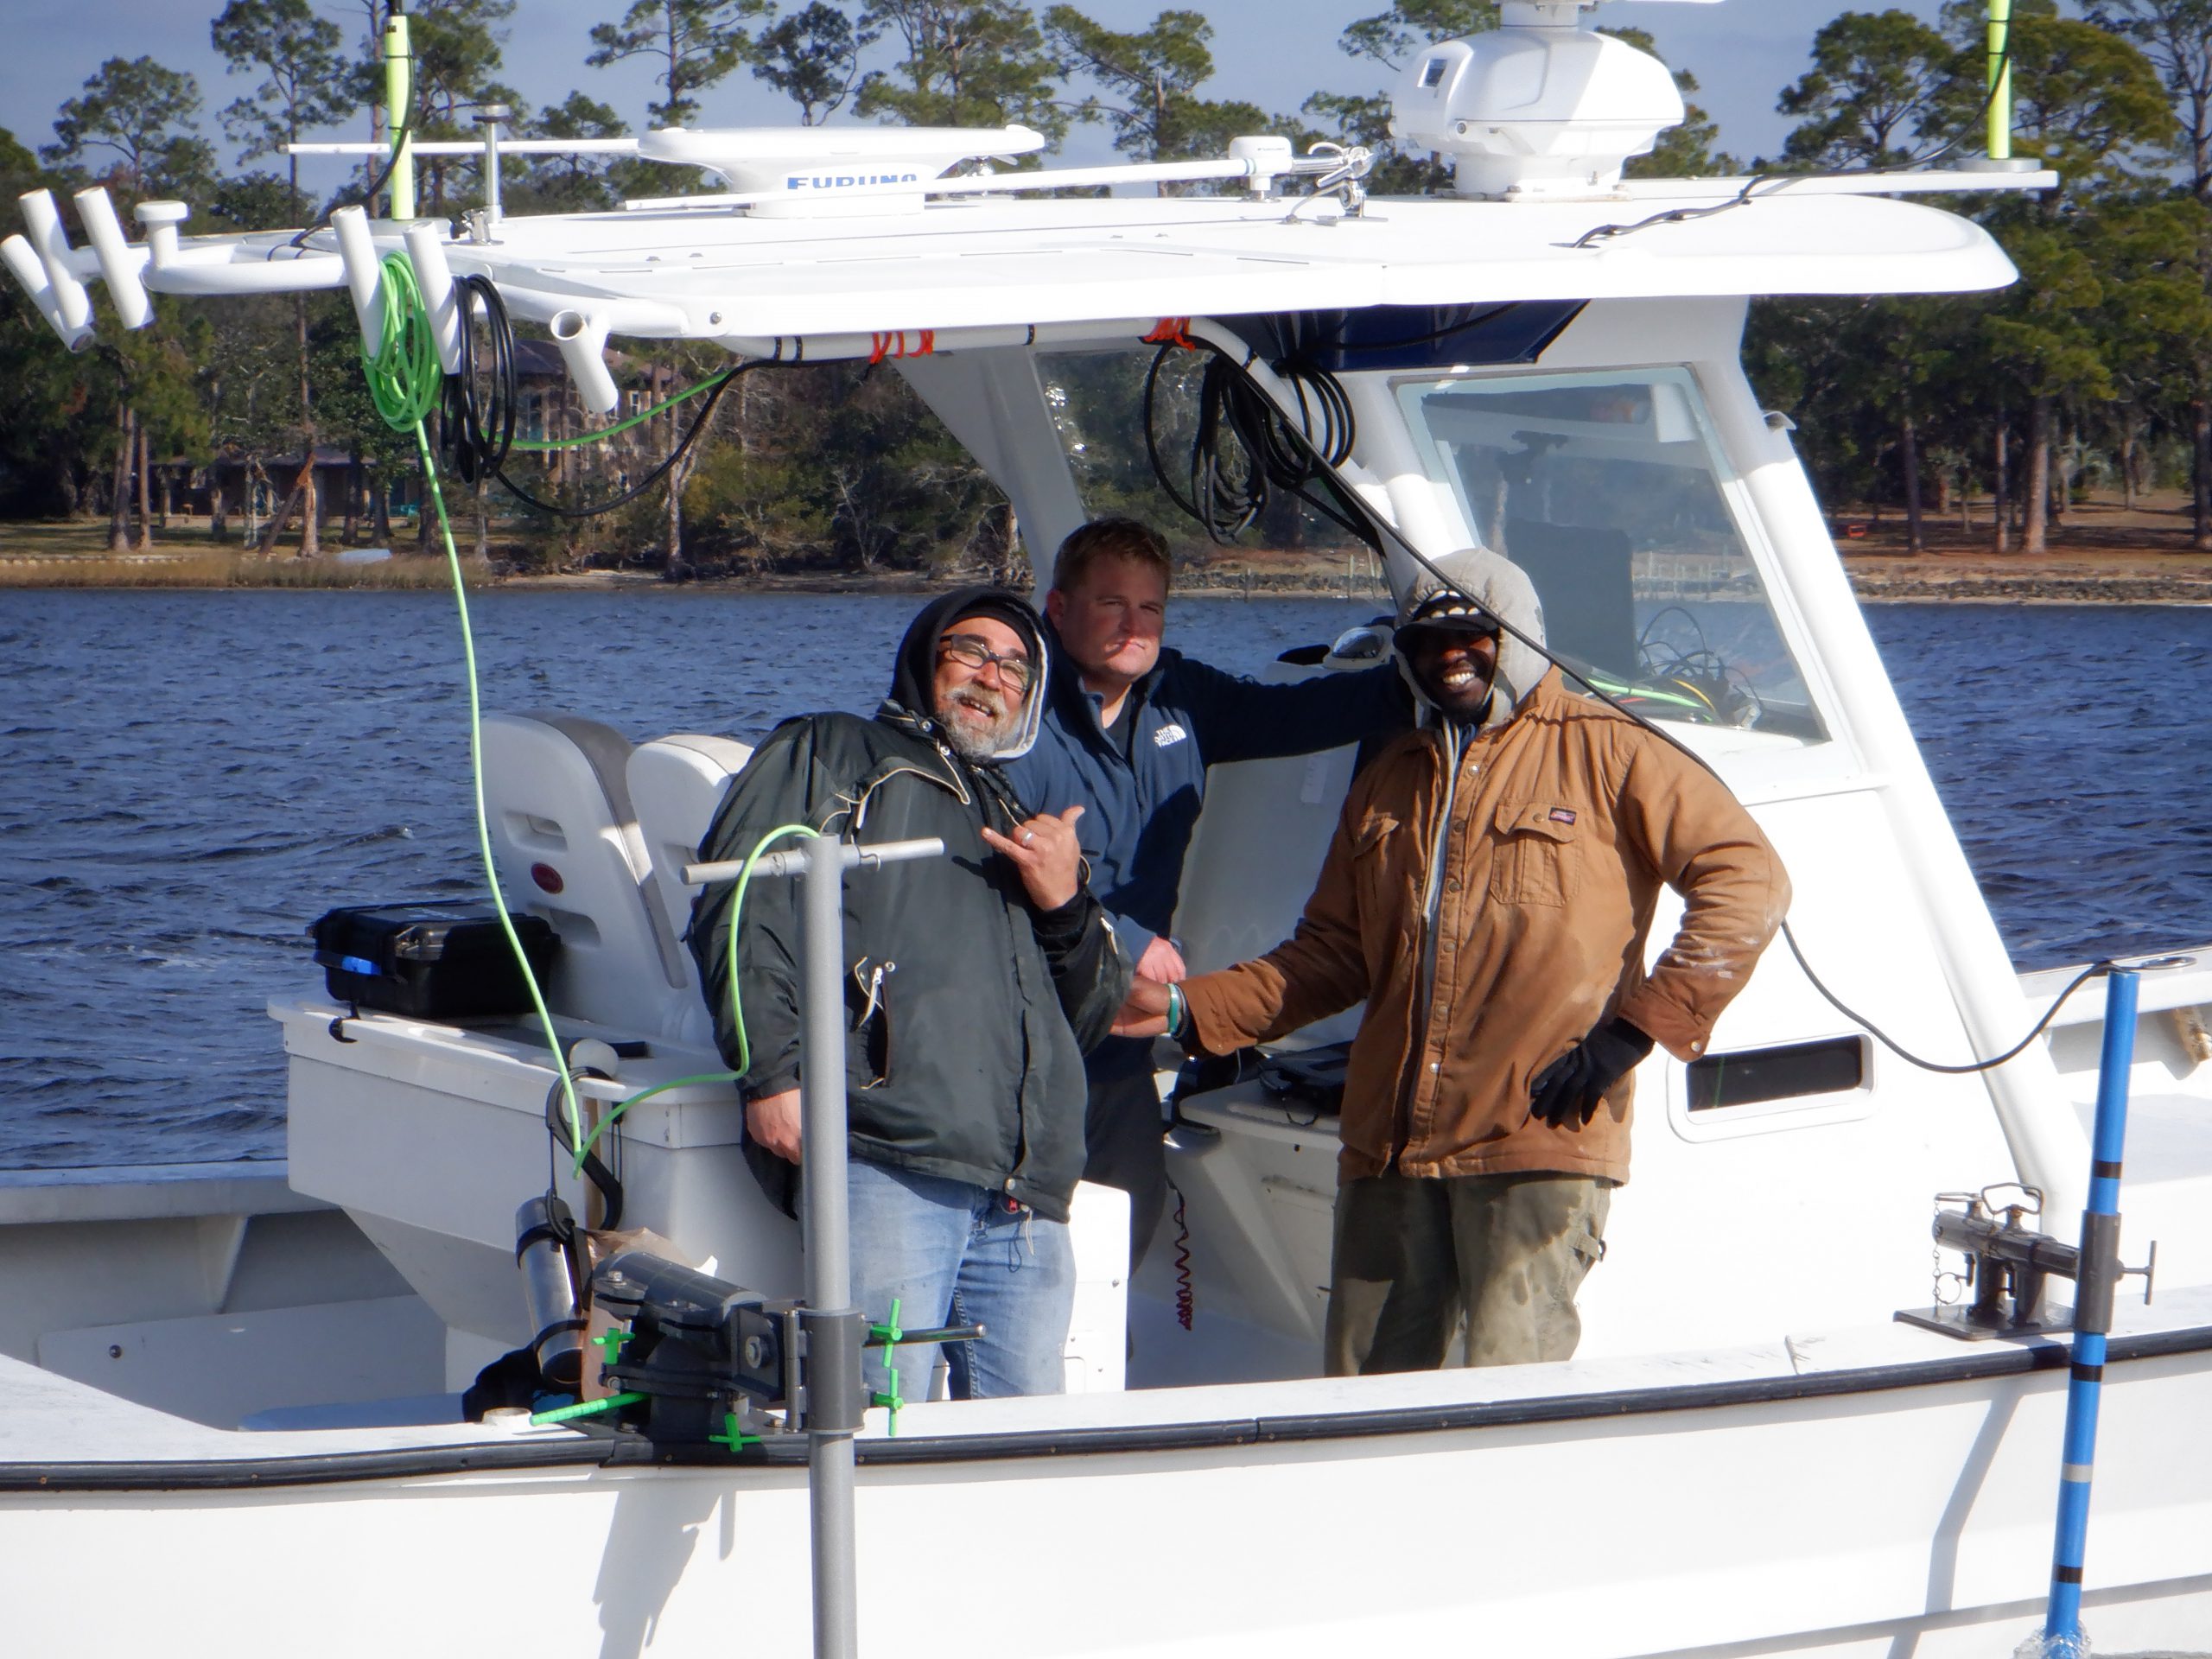
From left to right: Dale, Gabe and Reese of MREC Environmental. Phot credit: Chris Verlinde
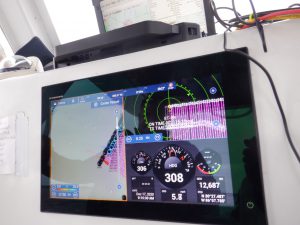
Side scan sonar and echosounder along the side of the boat. Photo Credit: Chris Verlinde
Gabe and his crew are using one Side Scan Sonar, an Edgetech 4125i to map images of the bottom. The other instrument they are using is a Singlebeam Hydrographic Echosounder (Teledyne Odom Echotrac CV100). The echosounder is used to collect water depth data and contours of the water bottom. The echosounder is connected to a transducer. The side scan sonar and the transducer from the ecosounder are placed along the side of the boat and submerged while the boat travels over the transects to collect the underwater images and parameters.
The pink lines are the transect lines of grid #25. Photo credit: Chris Verlinde
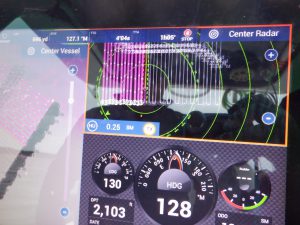
About two thirds of grid #25 are completed. Photo credit: Chris Verlinde
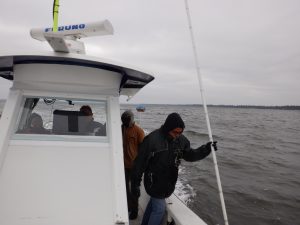
Dale dropping the pole to assess bottom characteristics. Photo credit: Chris Verlinde
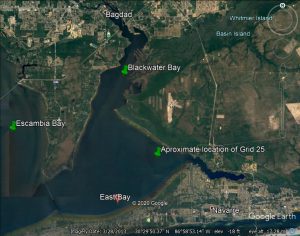
On a cold day in December 2020, Gabe and his crew covered 149.3 acres in grid #25, just west of the power lines in East Bay. Grid 25 included 32 parallel transect lines (2468 feet long), spaced 100 feet apart. This grid was completed in approximately three and a half hours by running the boat along each transect and recording data. In addition to the electronic data, one of the crew members used a fiberglass pole to assess bottom conditions. Approximately, every 10 feet or so, the pole guy would lower the pole and shout the condition of the bottom, either sand, mud, or shell. Gabe then recorded the point and code on his mapping software.
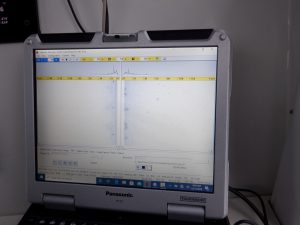
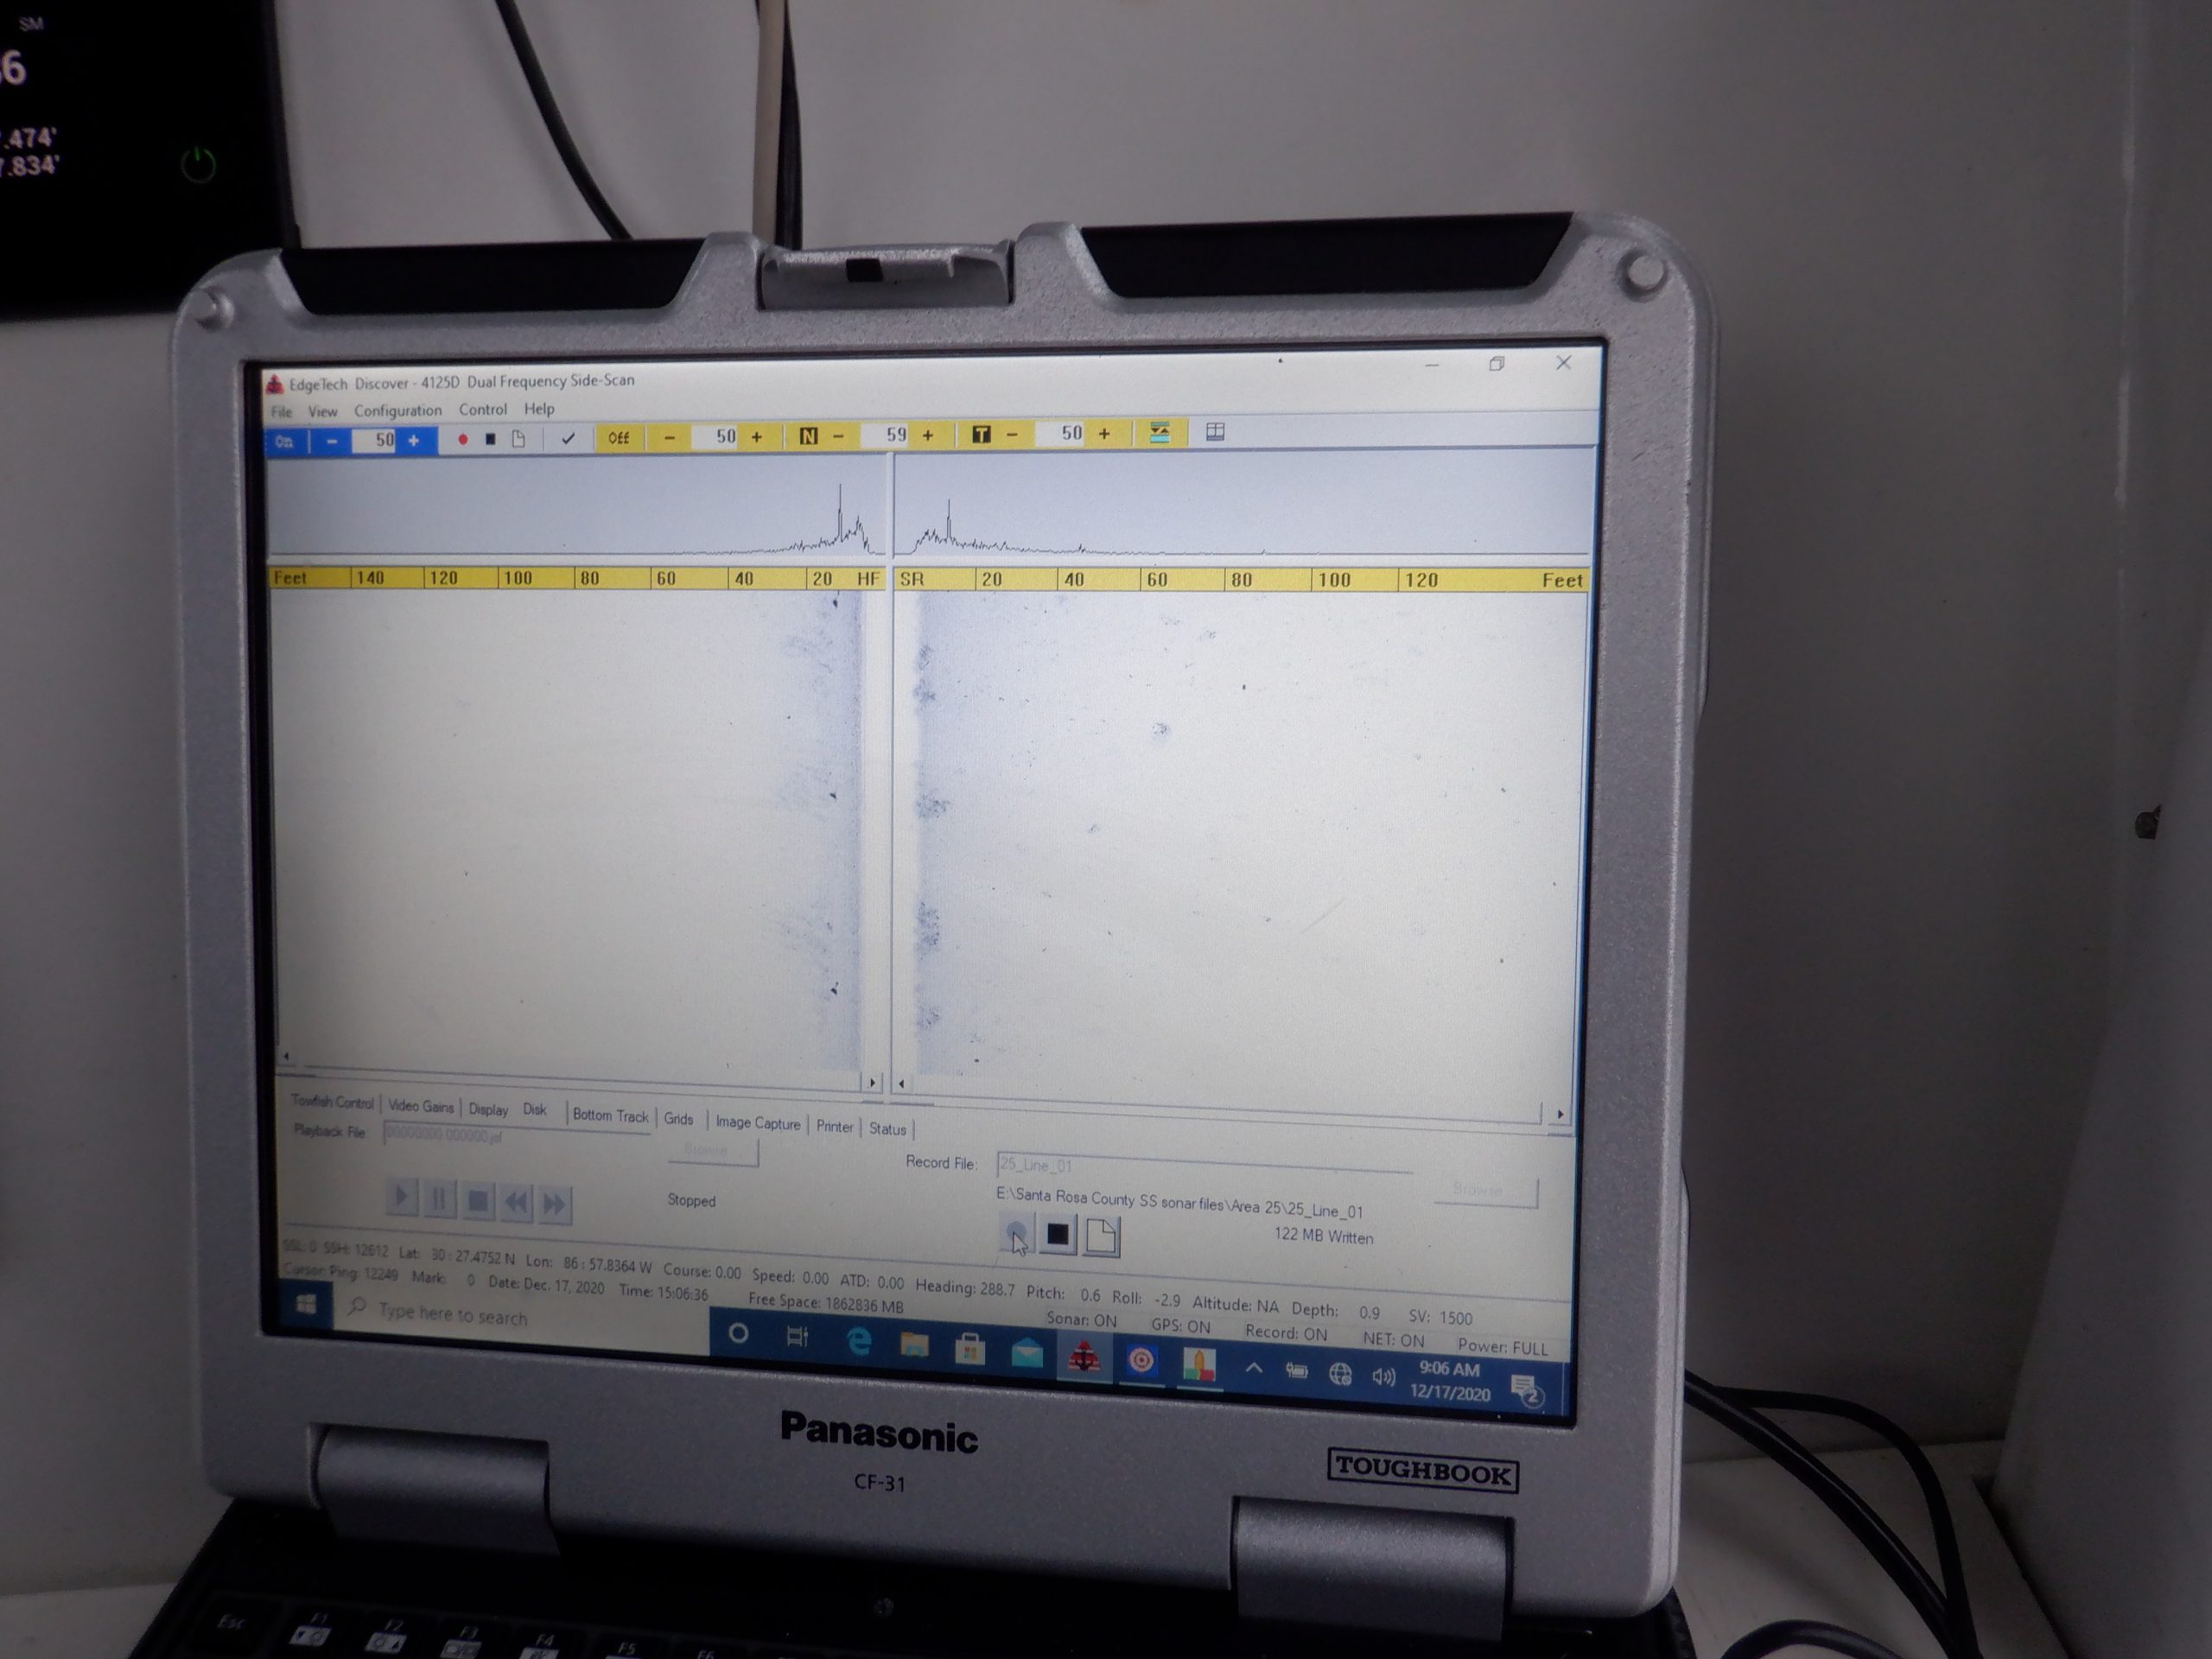
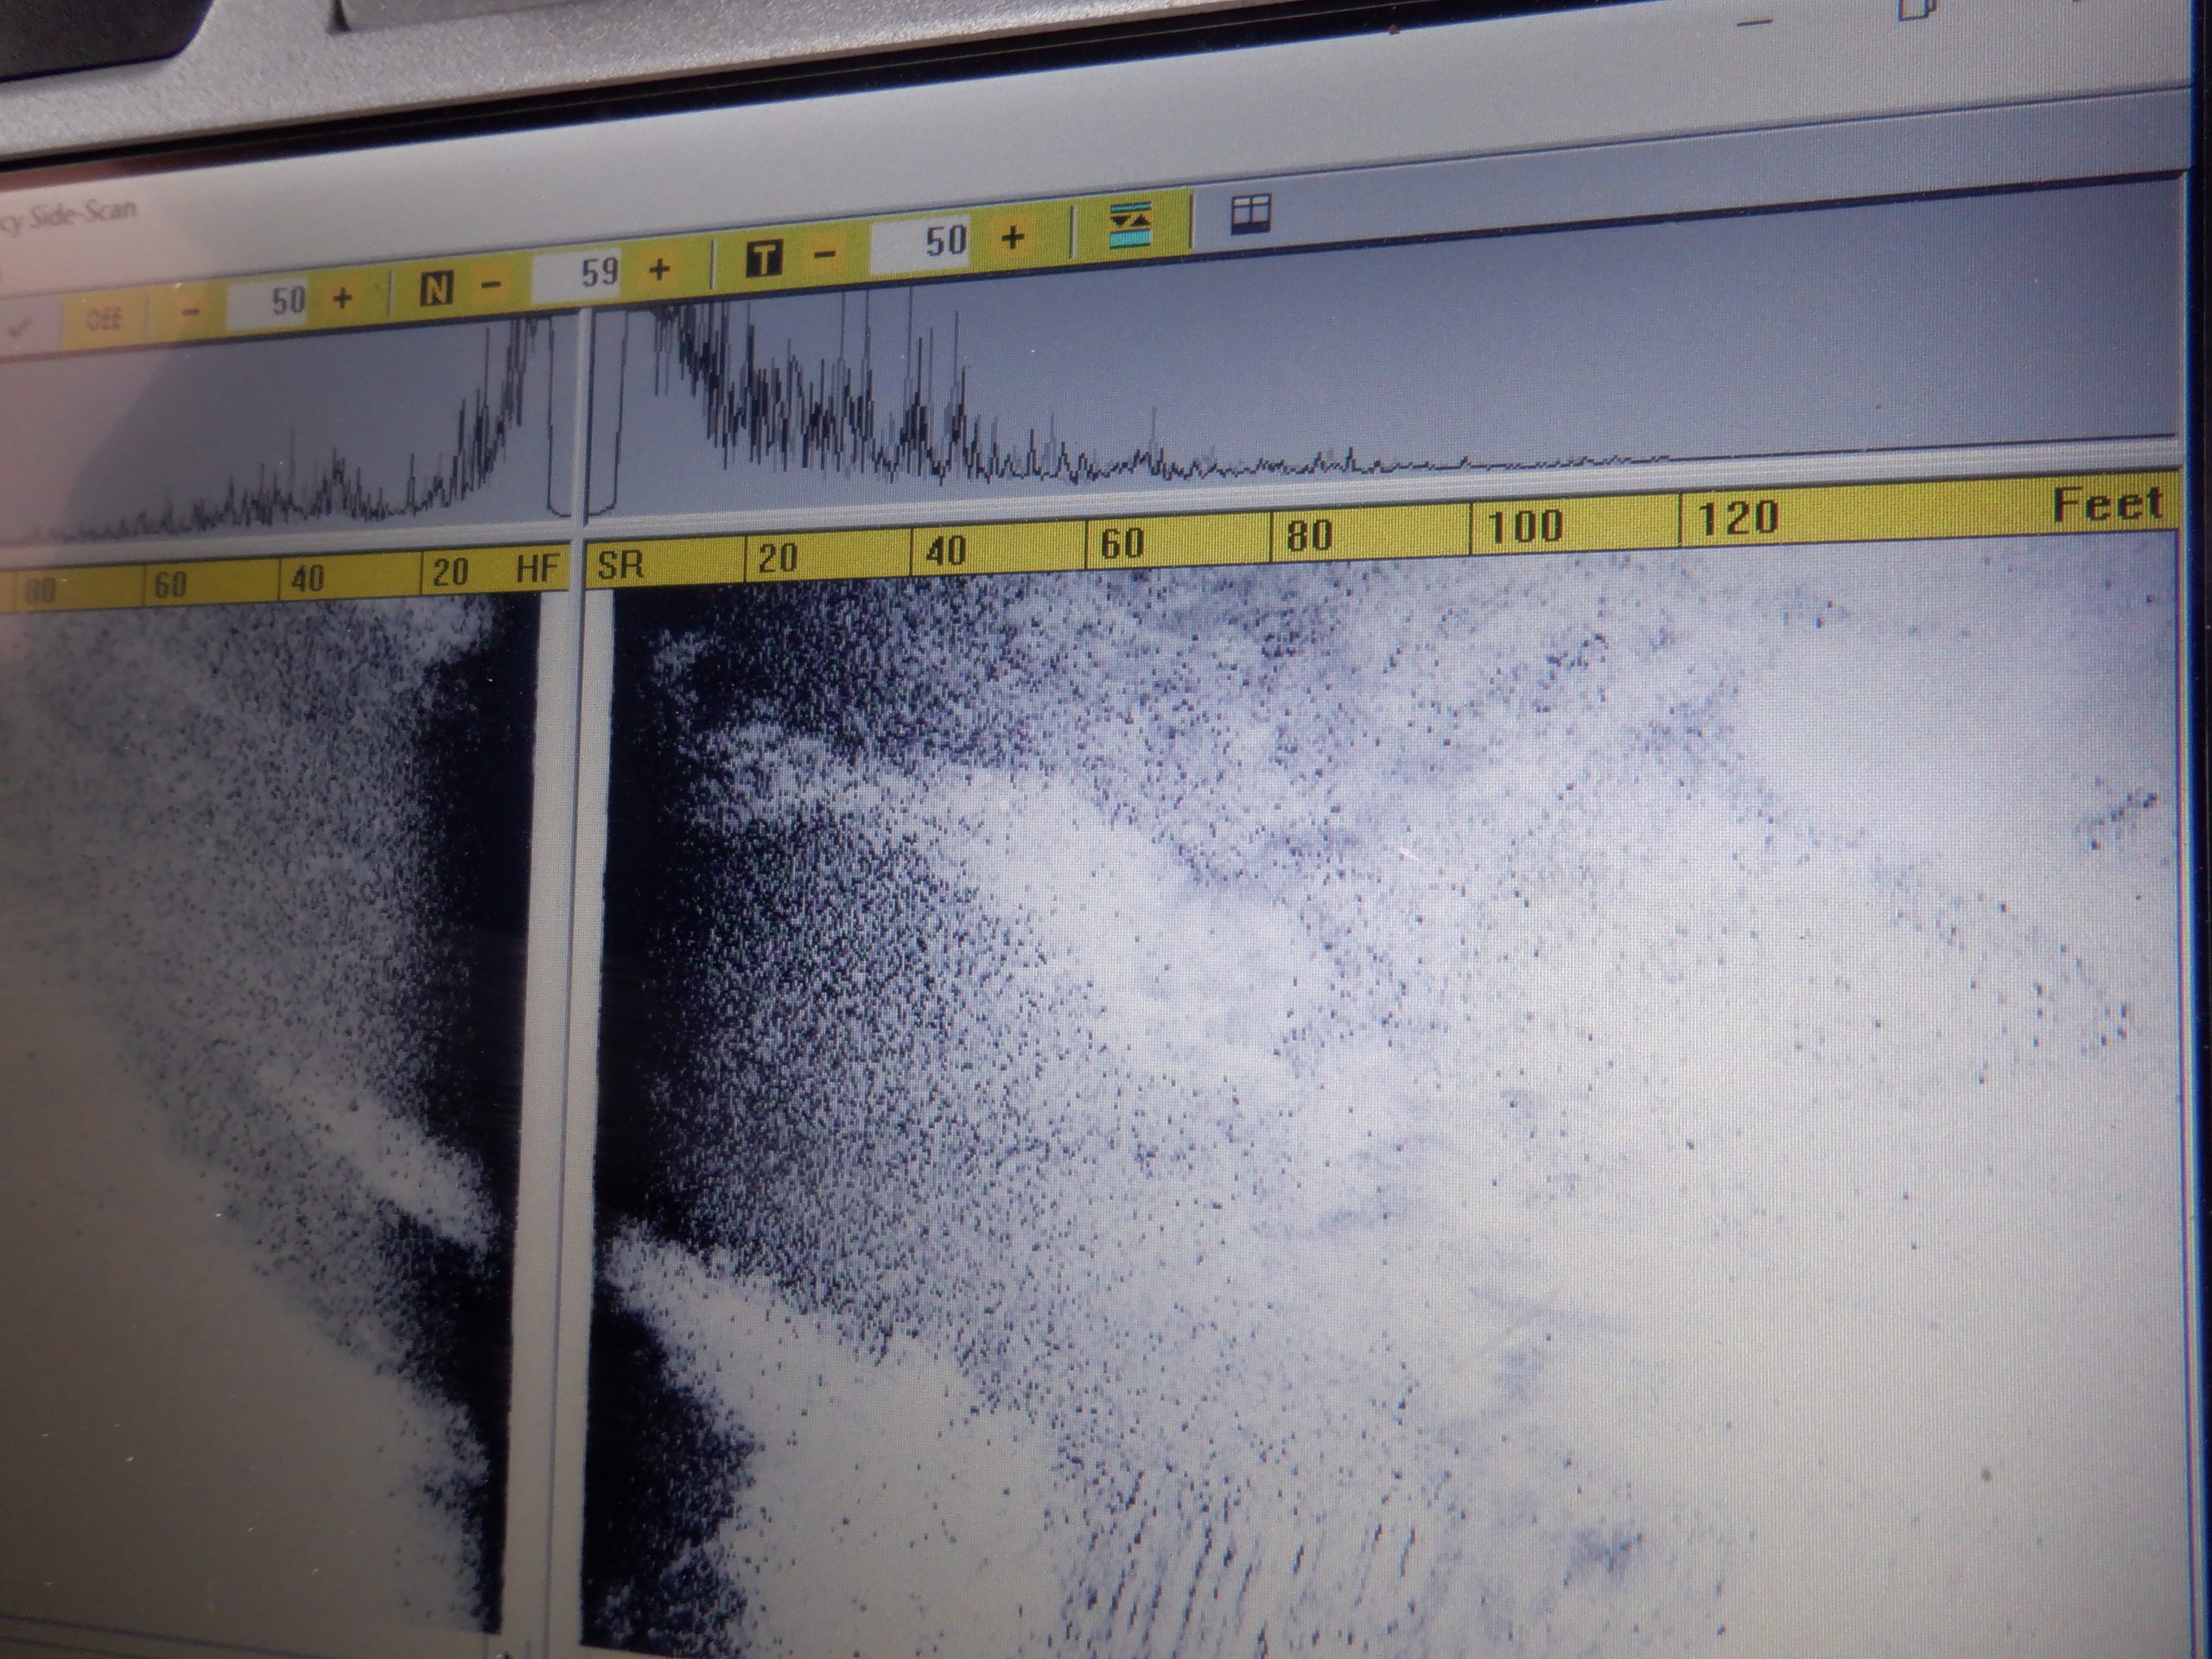
Image from the side scan sonar showing a sand bottom. Photo credit: Chris Verlinde
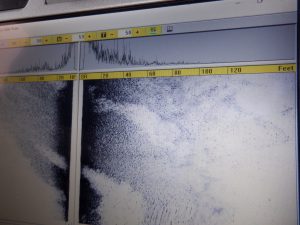
Side scan image of bottom with showing potential shell (the darker scatter area). Photo credit: Chris Verlinde
The raw data will be compiled into maps and a report that will be used to based future oyster fishery and habitat enhancement restoration efforts in East, West and parts of Escambia Bay.


