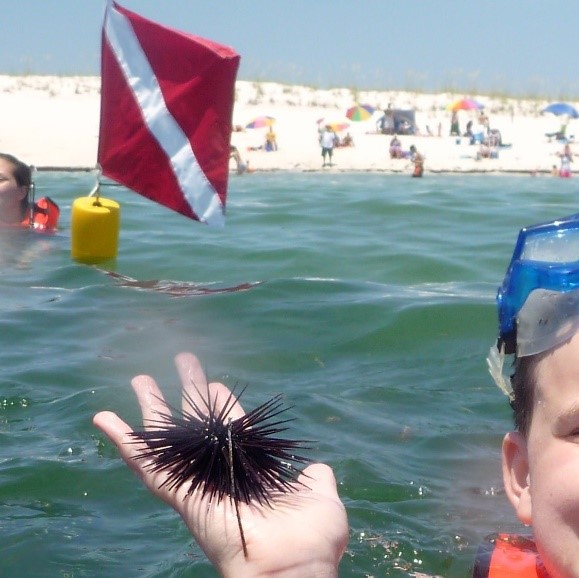
Sea urchins are one of the more commonly encountered creatures when snorkeling in our seagrass beds. At times these little pin cushions can be found in great numbers. In some locations there have been too many and community events have been developed to remove some. In the western panhandle they have all but disappeared. But for many parts of the panhandle, they are a noticeable member of the seagrass community.
According to the Florida Department of Health, most sea urchin species are not toxic but some Florida species like the Long Spined Sea Urchin have sharp spines can cause puncture injuries and have venom that can cause some stinging. Swim and step carefully when snorkeling as they usually are attached to rocks, both on the bottom and along jetty ledges. Photo by L Scott Jackson
Sea urchins belong to the phylum Echinodermata. The term echinoderm means “spiny skin” and is a good name for this creature. This group also includes the sand dollars, sea cucumbers, and the most famous member, the sea stars. Echinoderms are considered advanced and primitive at the same time. Advanced in the sense of organ development, sensory perception, and food gathering. Primitive in the sense that they have radial symmetry, like many of the more primitive invertebrate groups; bilateral symmetry is considered more advanced. The entire phylum is marine, they have no freshwater, nor terrestrial members, and they do like the water salty – at least 20 parts per thousand, and some need it higher than that.
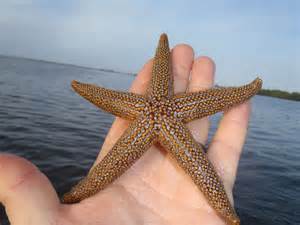
As mentioned, the sea stars are the “star” of the group. They usually have five arms that radiate from a central disk region. On top there are usually small knobs or bumps which are the remnants of their “spiny skin”. Some species, though none in our area, have elongated spines. Beneath the arms is a radial canal which houses a series of gelatinous suckers called tube feet. The sea star can fill these with water using a unique system called the water vascular system. The tips of the tube feet or concave and, when full of water, can create a suction cup that is used for pulling themselves along the bottom and for grabbing food. These canals all meet within the central disk in what is called a ring canal and the water that fills them is sucked in by the sea star through a screen-like structure on the top of the central disk called a madreporite (“screen sieve”). The central disk is where the mouth is located, and it is located on the bottom. Food is worked into the mouth, digested, and excreted through an anus on the top of the central disk. Most species have some form of eye at the end of each arm and have a good sense of smell and taste.
Sea stars are predators, collecting small organisms they are fast enough to catch (which is not many really). But they can also take on larger slow prey, like shellfish. When they approach an oyster, which is sessile and cannot run away, they will grab each of the valves (shells) of the oyster with one of their arms. They will draw water into their water vascular system creating suction on the tube feet and “stick” onto the shells. They will then force the oyster open. Once open they will invert their digestive tract out of their body in a process called evisceration, consume the oyster, then retract the digestive tract leaving two empty shells on the seagrass bed floor. These empty shells are often found by snorkelers – though there are other predators of bivalves.
The Florida Orange Sea Star.
Photo: Florida Sea Grant
Sea urchins differ from their sea star cousins in the way their body is laid out. Imagine you had a five-armed sea star laying on the ocean floor. Imagine taking each of the five arms and rolling them upwards so that the tips of each touch above the central disk. Can you imagine this looking like a ball? A sphere? Now cover the now exposed underside of the arms with long spines (quills) and the tube feet extend between the quills. You have a sea urchin.
Another difference would be the mouth. At the terminus of each arm near the mouth is a single tooth. With five arms, there would be five teeth. Scientists call this set of five teeth Aristotle’s lantern and the urchin uses this to scrap algae from rocks, shells, and grass blades. They are herbivores, moving along feeding on a variety of seaweed and seagrasses in the system.
There is concern with many snorkelers that the quills (spines) of the sea urchin are venomous. That is the case with some species around the world, but not in our area. That said, they are sharp, and the purple urchin (more common in our rock jetties and artificial reefs) hurts. Their quills are sharp and often break off in the skin causing discomfort, much like a splinter. You do not want to handle them, but if you do – handle them with care.
Sand dollars are close cousins of the sea urchin and are in the same class (Echinoidea). If you can imagine taking a round sea urchin and squashing it flat like a pancake, you have a sand dollar. There are also echinoderms in this group that are not as round as sea urchins, but not as flat as sand dollars and are called heart urchins, or sea biscuits. These can be found in grassbeds at the eastern end of the panhandle, but are more common in south Florida.
The sea cucumber is an echinoderm more often found in rocky or coral reef communities, but there are some found in the seagrass beds. To see the relationship between them and their cousins, imagine taking a round sea urchin, lie it on its side, and extended the body so that it is no longer a round ball but an elongated worm-looking creature… sea cucumber. These are primarily scavengers and deposit feeders within the community.
Sea Cucumber
Photo by: Amy Leath
Being a resident of the western panhandle, we have noticed a mass decline of echinoderms in our grassbeds. As a kid in the 60s and 70s we never saw large numbers, as they do in the eastern panhandle, but we did see them. Now they are gone. One suggestion as to why has been salinity. Our bay system over here has more river discharge than those further east and the lower salinity may not support larger populations. The increased development of the years, and the methods of dealing with stormwater, may have created a system that echinoderms do not like. Whatever the reason, finding sea stars and sea urchins in our grassbeds is rare.
The eastern panhandle still has them. And, at times, too many. In recent years there has been an increase in sea urchin populations in St. Joe Bay that has led to overgrazing of the turtle grass. This could lead to a decline in suitable habitat for bay scallops, which the community depends on economically. The state currently sponsors a “Sea Urchin Round Up” event using humans to help control the overabundance of sea urchins.
Echinoderms are a visible, and interesting, part of our seagrass community.
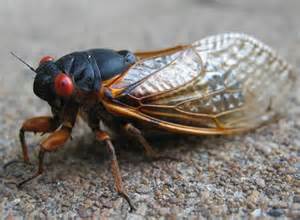
In terms of diversity and abundance, the Phylum Arthropoda is the most successful in the Animal Kingdom. Between them all, there are over one million species. They can be found in all habitats, from the deepest part of the ocean to the highest places in the mountains, from the polar region to the most extreme deserts. Most are insects, but there are also arachnids, centipedes, millipedes, and the ones most common to the marine environment – the crustaceans. With the numerous species within this group, and new ones being discovered all the time, the classification of arthropods is constantly changing. Currently Crustacea is considered a subphylum and there are about 30,000 species within.
Insects are one of the most abundant forms of life on the planet. Photo: Princeton University
There are several keys to the success of arthropods. Number one, their shell. It was seen with the mollusk that having a hardshell to protect your soft body was a winner. However, mollusk make their shells from heavy calcium carbonate. Though this provides excellent protection against most predators, it did slow them down considerably making it much easier for predators to catch them. It is understood that in the world of defense, speed is important. The arthropods make their shells from a strong, but much lighter material called chitin. This material is strong but serves as the creatures’ exoskeleton and must be shed periodically as the animal grows.
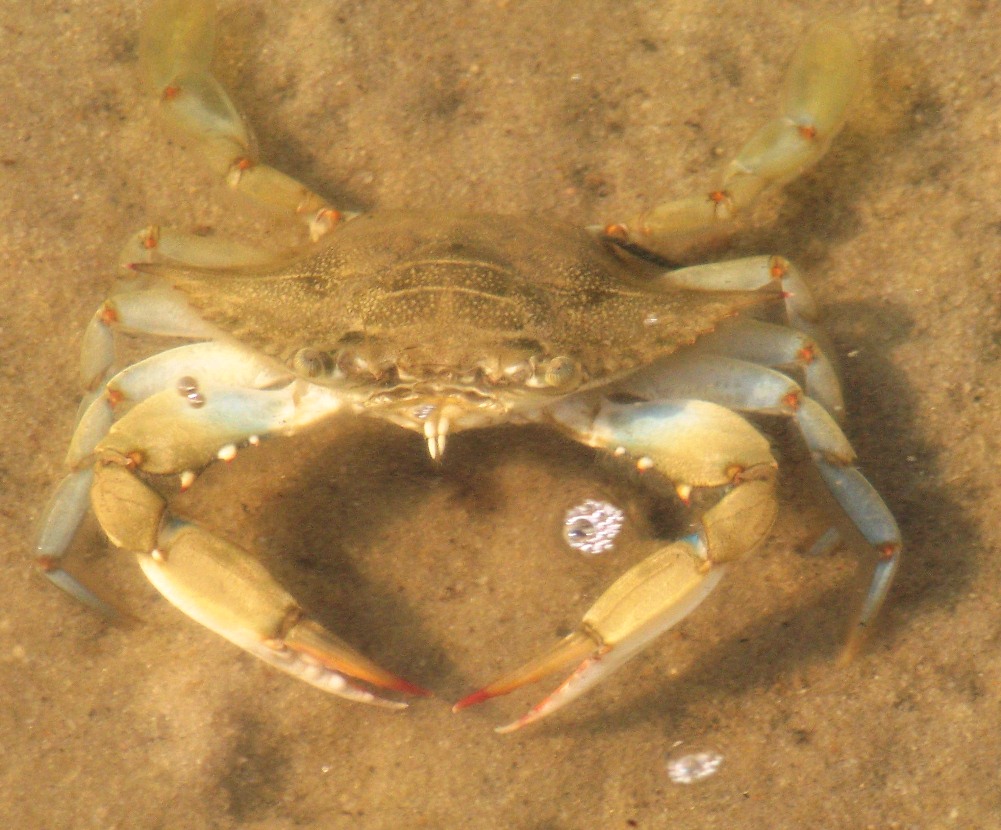
Number two, their legs. The name “arthropod” means jointed foot and one glance at the legs of any of these, you will see why scientists call them this. To increase speed animals, need to break contact with the surface of the ground. Birds are the best, lifting off and flying – the fastest form of location there is. The slug-like mollusks have their entire bodies in contact with the sediment, as the “slug” along the bottom of the sea. Many creatures have developed legs and walk, this is the case of the arthropods. Some hop great distances, like the flea. Others can actually swim, like blue crabs. And many of the insects have wings and can fly. But these jointed legs, along with a lighter shell, have been very effective defense for these creatures.
Number three, their sense organs and brain. Though not as intelligent as octopus and squid, arthropods are very aware of their environment and very quick to respond to trouble or a food source. Drop a piece of cheese during a picnic and see just how fast the ants find it. Heck don’t drop the piece of cheese and see how quickly they find it! These animals have a series of hairs, bristles, and setae connected to their shell that can detect movement and pressure changes in the environment. There are canals, slits, pits, or other openings in the shell that can detect odors. And then they have their compound eyes. Compound in the sense there are more than one lens. Each lens does provide an image of the target (in other words, they do not see 100 images of you) but rather each provides a level of light intensity sort of like individual pixels in a computer image, or the image we see when the camera displays “squares” of light so that you cannot read someone’s license plate, or the logo on their t-shirt – we see this on TV news and shows often. Compound eyes do not produce as clear an image as our eyes, but they are MUCH better at detecting motion, and there is an advantage to this. Try stomping on a cockroach, or swatting a fly, and you will see what I mean.
And number four, a high reproductive rate. You see this in many of the “prey” type species. Most arthropods are dioecious (males and females) and can produce millions of offspring at rates that you could never consume them all. So, they survive and can quickly support gene flow and adaptation. These are well designed animals.
Blue crabs are one of the few crabs with swimming appendages.
Photo: Molly O’Connor
In the crustacean world we find several groups. They differ from their arthropod cousins in that they have 10 jointed legs, and two sets of antenna (one set long, the other short). They include at least 30,000 species including the shrimplike cephalocarids, the shrimplike branchipods, the shrimplike ostracods (common in the deep sea), the roachlike copepod (part of the plankton we spoke about in another article in this series), the mystacocards, branchiurans, the familiar barnacles, krill, the roachlike isopods, flea like amphipods, and the most familiar of the group – the decapods – which includes the crabs, shrimps, and lobsters. It is this last group we will focus on.
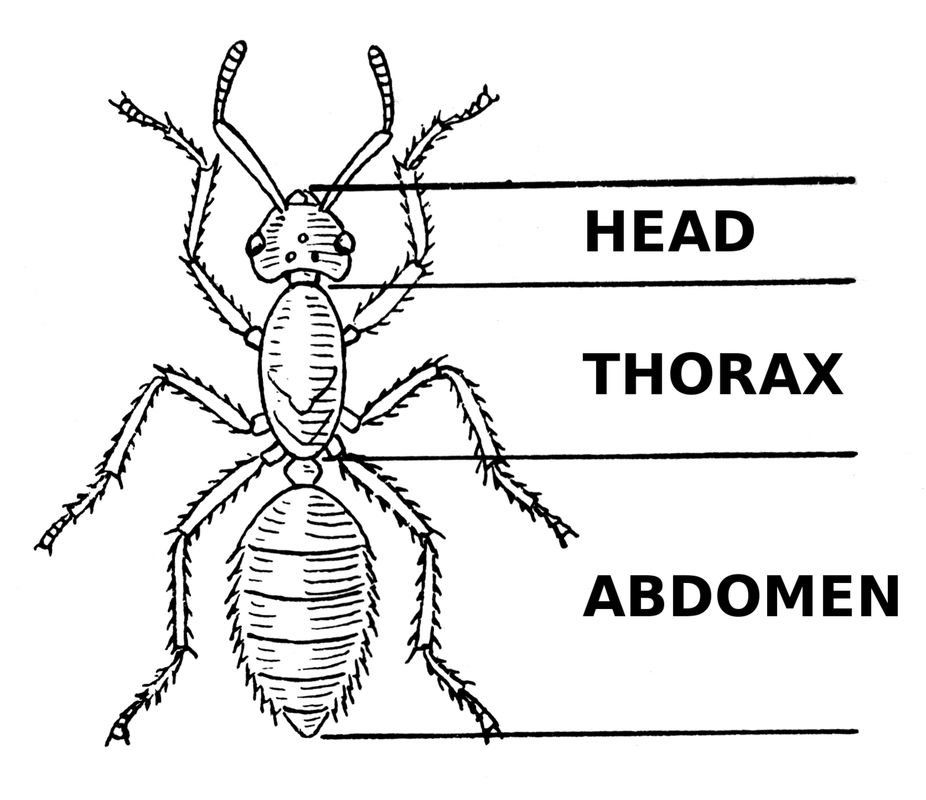
There are three basic body parts to an arthropod. The head, thorax, and abdomen. In crustaceans the head and thorax are fused into one segment called the cephalothorax (the head of a shrimp or crawfish). The abdomen is what most call the shrimp and crawfish tail (the part we usually eat).
Insect body parts.
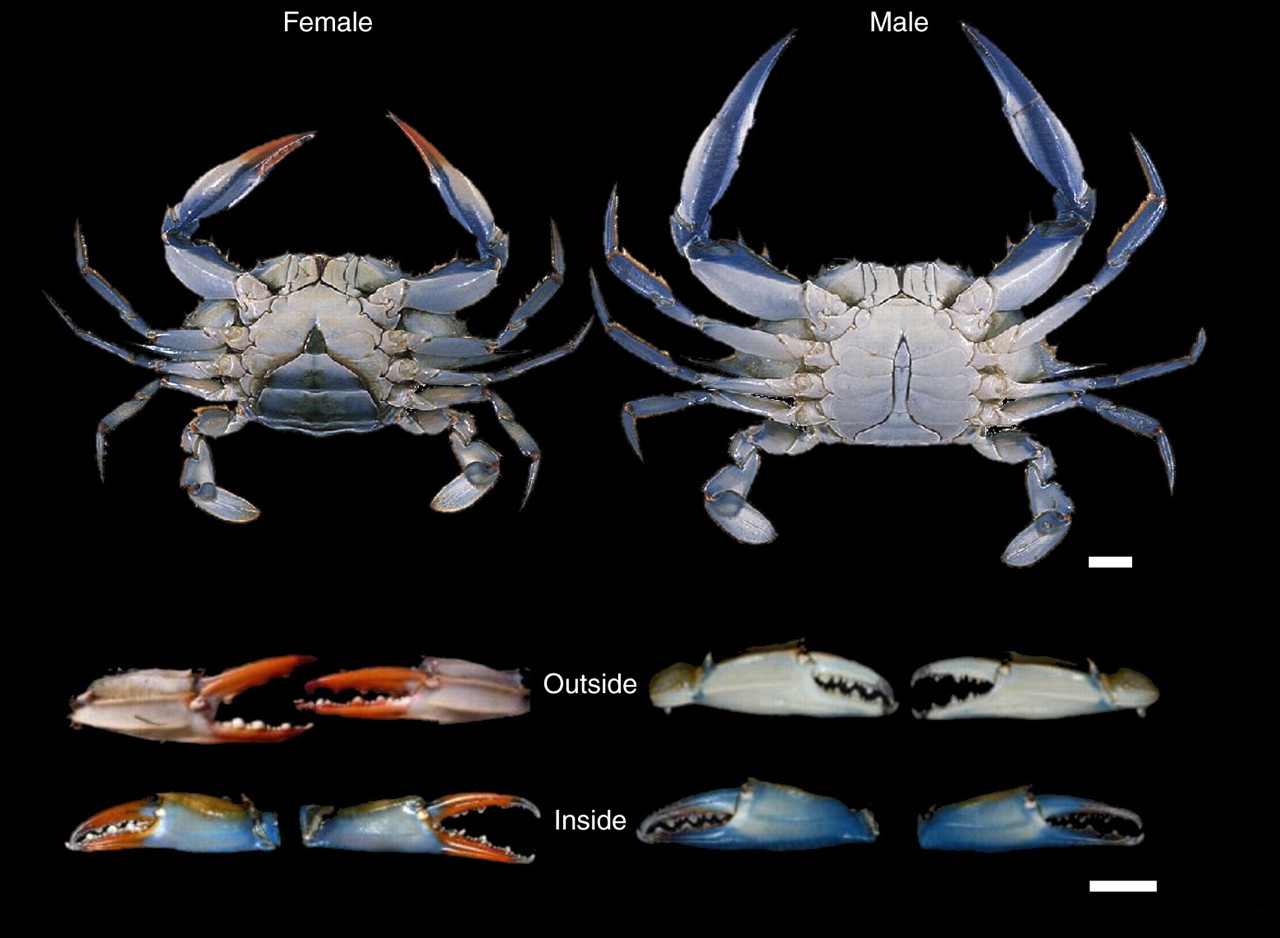
Crabs are the ones we most often encounter when exploring the seagrass beds. Not that the others are not abundant, they are, they are just not seen. They differ in that their abdomen is curled beneath their cephalothorax. The most commonly encountered is the famous blue crab (Callinectes sapidus). Most crabs have modified two of their 10 legs into chelipeds (claws) and most folks seeking crabs for dinner are aware of these claws. The blue crab belongs to a group called the protunid crabs which have modified two additional legs into swimming paddles – they can swim. They are often found crawling around the edges, and within, the seagrass searching for food. When detected over sand, they quickly bury themselves and sometimes people step on them not knowing they are there. When spooked they often will emerge with chelipeds extended and when the time is right, will scurry off running sideways with one cheliped pointed at you. They can get quite large and are a popular fishing target for both recreational and commercial fishermen. The males (the ones with the long then telson on their curled tailed) are more common in the upper estuaries. The females (the ones with the more round telson) frequent the lower bay. During breeding season, the males will move to the lower estuary to find a female. Once found he will crawl on her back and “ride” for a couple of days in what commercial fishermen call “doublers”. At some point the male will provide a tube filled with sperm called a spermatophore to the female. He then moves on. The female will store the spermatophore until she feels it is time to fertilize the eggs, then does so. The eggs begin to develop beneath her abdomen in a spongy looking mass. Early in development the mass is an orange color. Closure to hatching it is brown. Females carrying this spongy mass are called gravid and are illegal to harvest in Florida. The larva will be released in the millions as tiny plankton and go through several life stages before becoming young crabs and starting the whole story again. These popular crabs live for about five years.
Male and female blue crabs.
Photo:
Another crab found in the grassbeds is the spider crab (Libinia dubia). This crab does resemble a spider, is slow moving, and very hard to see. It has small chelipeds and feeds on debris and organic material collected by the grasses. They too can get quite large and resemble the king crabs harvested in Alaska.
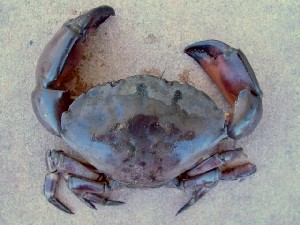
Stone crabs (Menippe mercenaria) are more often associated with rocky bottoms, or artificial reefs, but they have been found in burrows and crevices within grassbeds. The have wide-stocky chelipeds, which is a favorite with some seafood lovers. Those in the grassbeds do not get as large as those found around the reefs of south Florida, where they support a large commercial and recreational fishery.
The stone crab has been a popular seafood target in Florida for decades.
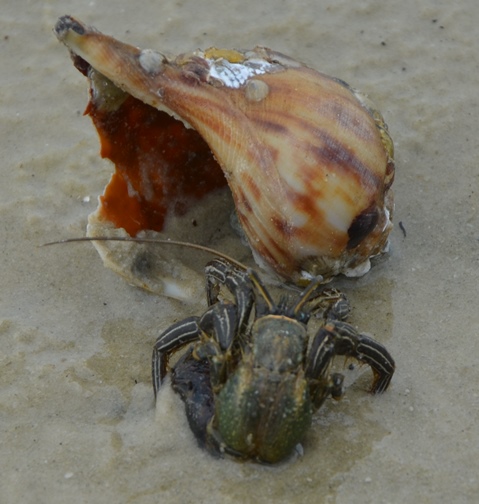
The hermit crab is a common resident of grassbeds. The most frequently encountered is the striped hermit (Clibanarius vittatus). Like all hermit crabs, they lack an external shell covering their abdomen and must cover their tail with an empty mollusk shell. Their curled abdomen can grab and wrap around the columella within the mollusk shell and carry around their new home. These hermits have been found in a variety of mollusk shells and are found roaming the beaches at low tide feeding on organic debris and cleaning the grassbeds.
A room with a view: a stripped hermit crab sizes up a potential residence
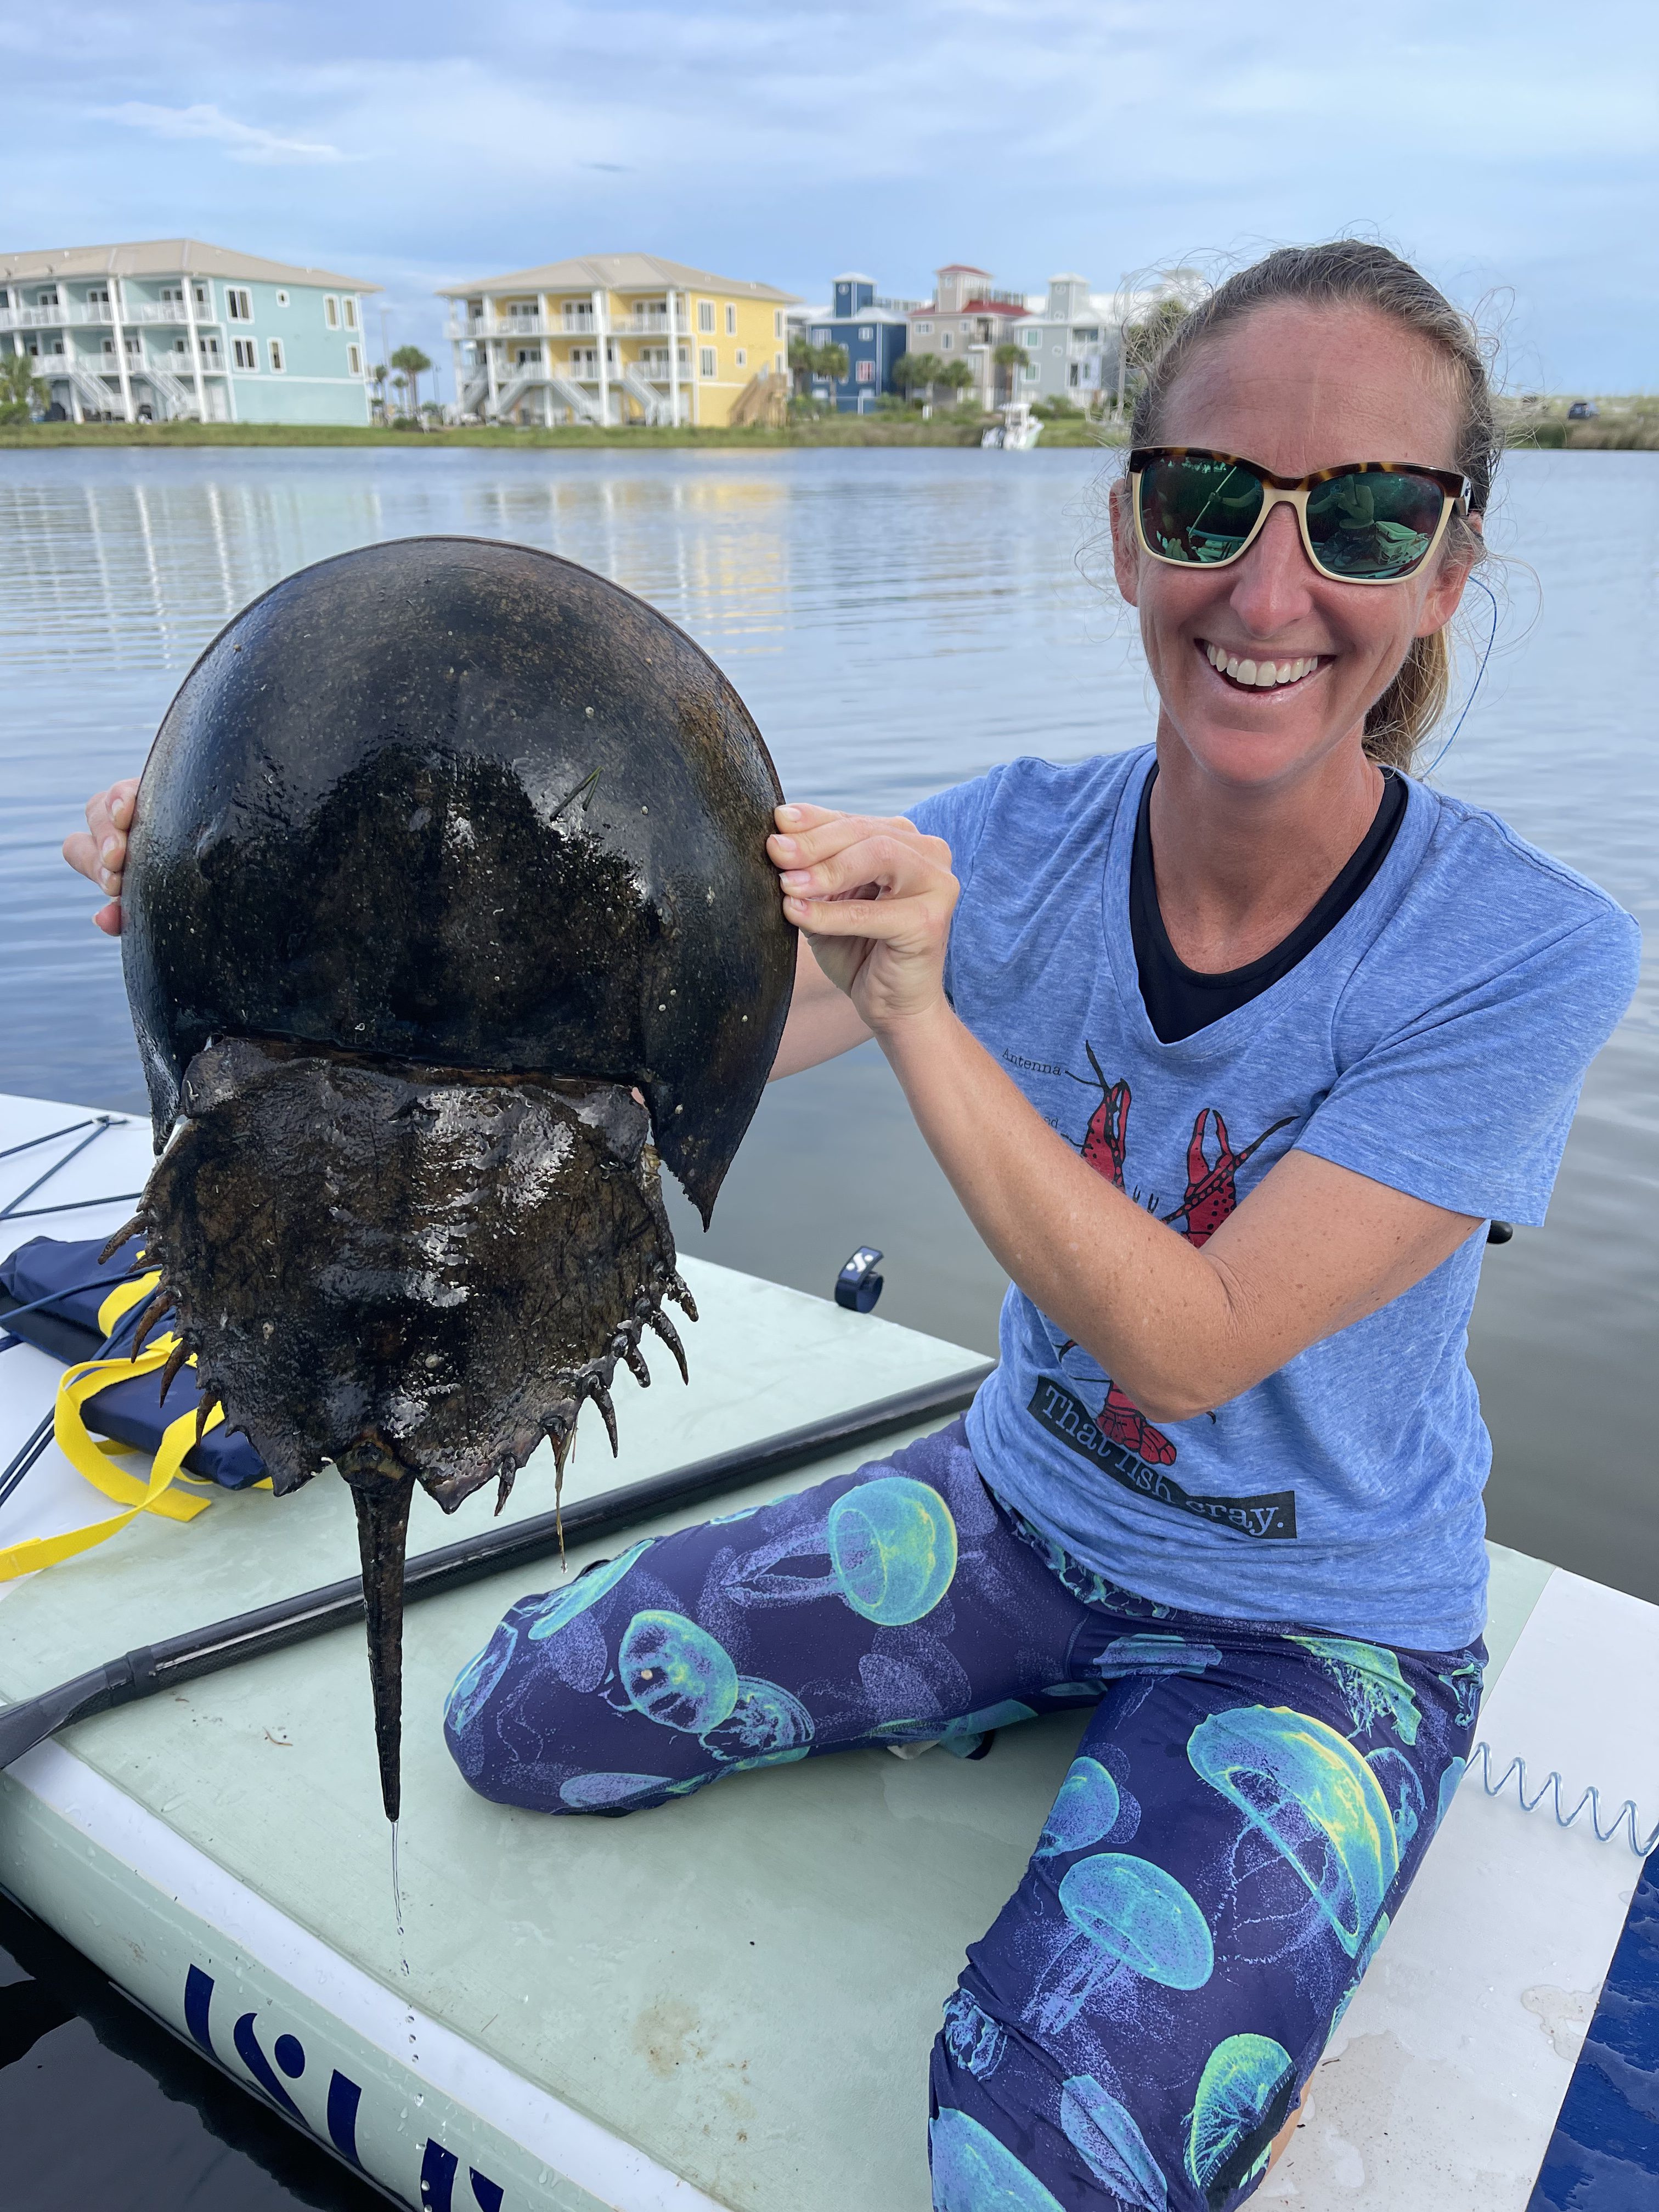
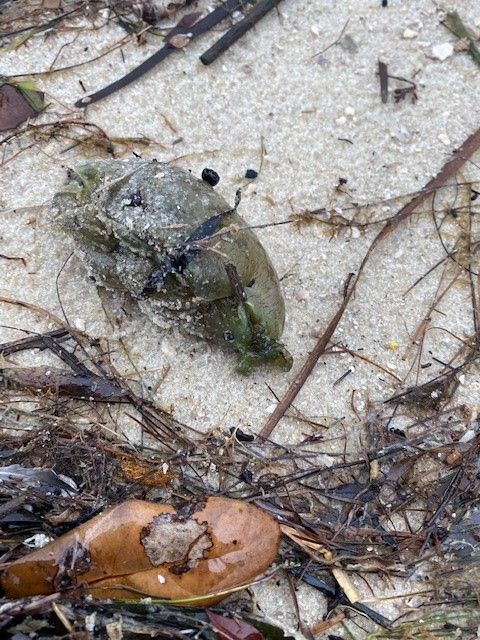
One crab that is often associated with seagrasses is not actually a crab at all. The horseshoe crab (Limulus polyphemus) lacks antenna and is more closely related to the arachnids. This ancient mariner has been plowing the bottoms of estuaries for over 400 million years. They resemble stingrays with their elongated telson and feed on a variety of small invertebrates both in the grassbeds, and in other estuarine habitats. They are quite common in the eastern panhandle and seem to be making a recovery in the western end.
A large horseshoe crab found in Little Sabine.
Photo: Amanda Mattair
Though rarely seen, shrimp are very prolific in our seagrass beds. Pulling a seine or dip net through the grass will expose their presence, usually in high numbers. The most commonly collected species are those known as grass shrimp (Palaemonetes sp.). There are a few species, and all are small and mostly translucent, though one is a brilliant green. Feeding on organic debris within the grassbed these little guys are an important food source for the larger members of the community.
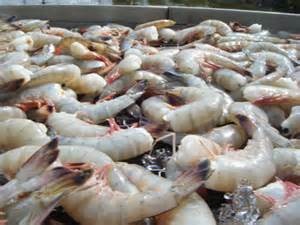
The more famous of the shrimp group are the brown and white shrimp. These are the species we find on our dinner plates and are one of the most popular commercial species in the country. Brown shrimp (Farfantepenaeus aztectus) are also known as bay shrimp and “brownie”. They are a darker brown than the white shrimp and their uropod (the fan on the tail of the shrimp) is lined in a red color. They do not get as large as the whites and are very popular for fried and steamed dishes. The white shrimp (Litopenaeus setiferus) is a larger shrimp, is lighter in color (“white”), and their uropod is lined with a neon green color. Both of these commercially important species spend their juvenile and young adult days in the grassbeds of our estuaries. Later in the fall the adults move into the nearshore waters of the Gulf where they spawn and die. The planktonic larva drift back into the estuary with the incoming tide, finding the grassbeds and the cycle begins again.
The famous Gulf Coast shrimp.
Photo: Mississippi State University
The large diversity of crustaceans within the grassbeds speaks to the importance of this habitat to all marine life. Many are commercially important to the local economy and depend on a healthy ecosystem to survive. All the more reason to protect our grassbeds.
Most of us in the Florida panhandle realize how important seagrasses are to the ecology of our estuaries. Not only do they provide habitat for commercially important finfish and shellfish, but they also help trap sediments, remove nitrogen from the system, and slow coastal erosion. But seagrasses throughout Florida have suffered over the last 50-60 years from environmental stressors created by humans. There has been a large effort by local municipalities to reduce these stressors, and surveys indicate that these have been successful in many locations, but there is more to do – and there are things you can do to help.
Reduce Stormwater Run-off
Stormwater run-off may be the number one problem our seagrass beds are facing. With the increased development along the panhandle, there is a need to move stormwater off properties and roads to reduce flooding of such. Older communities may still have historic drain systems where rainwater is directed into gutters, which lead to drainpipes that discharge directly into the estuary. This rainwater is freshwater and can lower the salinity in seagrass beds near the discharge to levels the seagrasses cannot tolerate, thus killing them. This stormwater also includes sediments from the neighborhood and businesses that can bury grass near the discharge site and cloud the water over much of the system to levels where needed sunlight cannot reach the grasses. Again, killing the grass.
Most would say that this is an issue for the county or city to address. They should be redesigning their stormwater drainage to reduce this problem. And many municipalities have, but there are things the private homeowner or business can do as well.
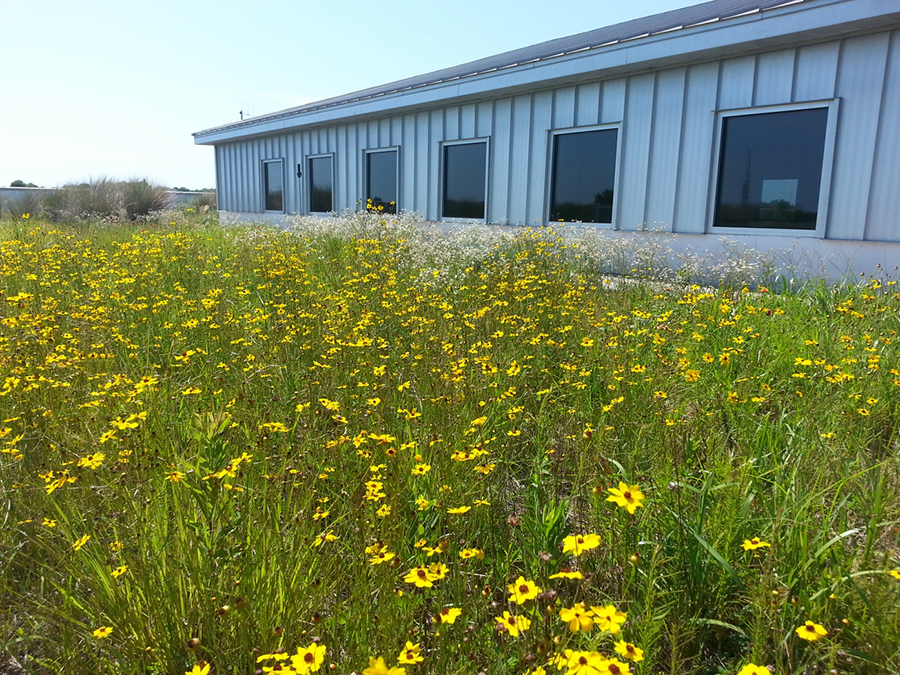
One thing is to modify your property so that the majority of the rainwater falling on it remains there and does not run off. Much of the rainwater falling on your property falls on impervious surfaces and “stands” creating flooding issues. You can choose to use pervious surfaces instead. For larger businesses, you might consider a green roof. These are roofs that literally grow plants and the rainwater will irrigate these systems with less running into the street. There is a green roof at the Escambia County Central Office Complex building in Pensacola. To learn more about this project, or visit it, contact Carrie Stevenson at the Escambia County Extension Office.
The green roof on top of the Escambia County Central Office Complex in Pensacola.
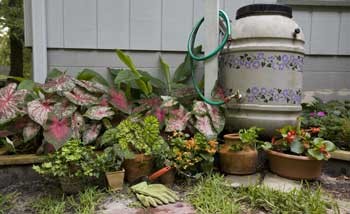
For those buildings that cannot support a green roof, you can install gutters and a rain barrel system. This moves rainwater into a barrel (or series of barrels) which can then lead to an irrigation system for your lawn or garden. All of which reduces the amount entering the streets.
rain barrels can be used to capture rainwater and avoid run-off.
Finally, you can use pervious materials for your sidewalks, driveways, and patios. There are a number of different products that provide strength for your use but allow much of the rainwater to percolate into the groundwater, thus recharging the groundwater (our source of drinking water) and reducing what reaches the street.
Plant Living Shorelines
Coastal erosion is an issue for many who live along our waterfronts. The historic method of dealing with it is to build a seawall, or some other hardened structure. These structures enhance the wave energy near the shoreline by refracting waves back towards open water where they meet incoming waves increasing the net energy of the system. Something seagrasses do not like. There are many studies showing that when seawalls are built, the nearby seagrass begins to retreat. This increased energy also begins to undermine the wall, which eventually begins to lean seaward and collapse. Placement and maintenance of these hardened structures can be expensive.
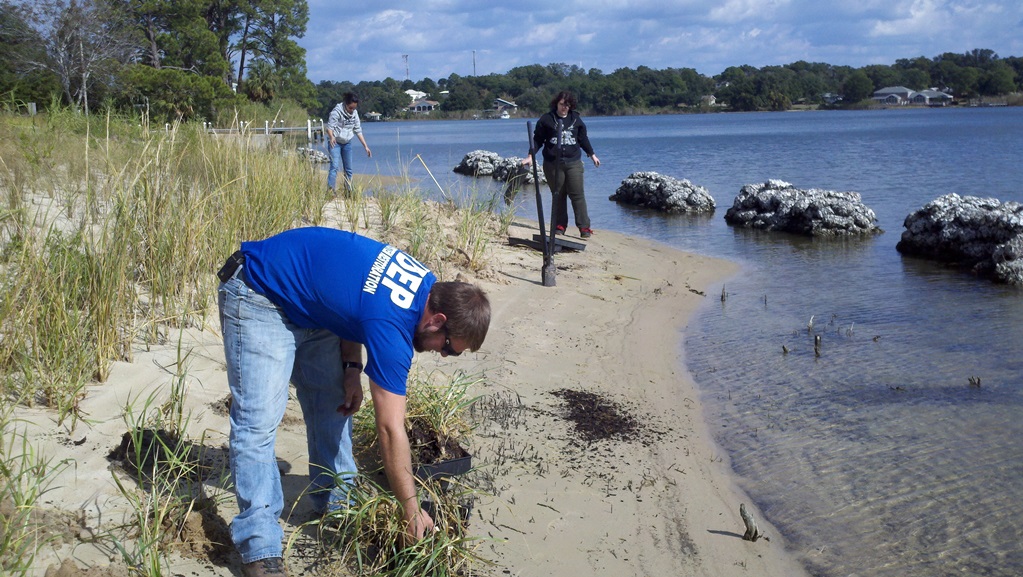
FDEP planting a living shoreline on Bayou Texar in Pensacola.
Photo: FDEP
Another option is a softer structure – plants. The shorelines of many of our estuaries once held large areas of salt marsh which provide habitat for fish and wildlife, reduce erosion, and actually remove sediments (and now pollutants) from upland run-off. But when humans moved to the shorelines, these were replaced by turf lawns and, eventually, seawalls. Returning these to living shorelines can help reduce erosion and the negative impacts of seawalls on seagrasses. Actually, several living shoreline projects enhanced seagrasses in the areas near the projects. Not all shorelines along our estuaries historically supported salt marshes, and your location may not either. It is recommended that you have your shoreline assessed by a consultant, or a county extension agent, to determine whether a living shoreline will work for you. But if it works, we encourage you to consider planting one. In some cases, they can be planted in front of existing seawalls as well.
Avoid Prop Scarring While Boating
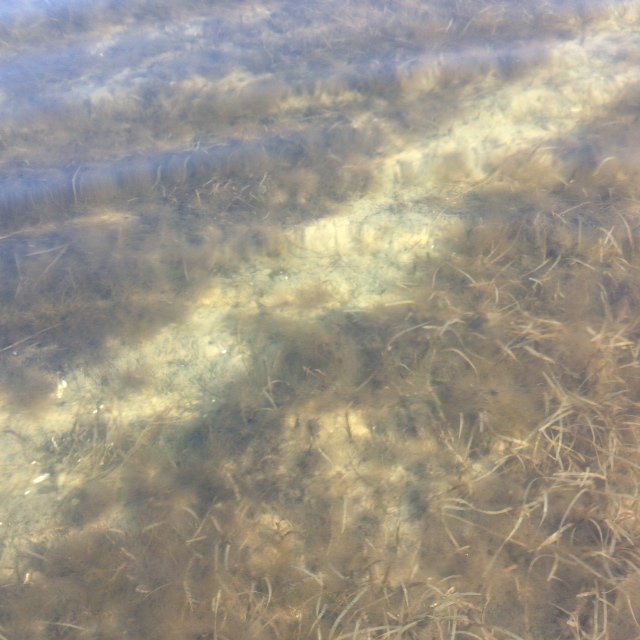
Seagrasses are true grasses and posses the same things our lawn grasses have – roots, stems, leaves, and even small flowers – but they exist underwater. Like many forms of lawn grass, the roots and stems are below ground forming what we call “runners” extending horizontally across the landscape. If a boat propeller cuts through them form a trench it causes a real problem. The stems and roots only grow horizontally and, if there is a trench, they cannot grow across – not until the trench fills in with sediment, which could be a decade in some cases. Thus “prop scars” can be detrimental to seagrass meadows creating fragmentation and reducing the area in which the grasses exist. Aerial photos show that the prop scarring issue is a real problem in many parts of Florida, including the panhandle.
The scarring of seagrass but a propeller. These can remain “open wounds” for years.
Photo: Rick O’Connor.
The answer…
When heading towards shore and shallow water, raise your motor. If you need to reach the beach you can drift, pole, or paddle to do so. This not only protects the grass, it protects your propeller – and new ones can be quite expensive.
If Florida residents (and boating visitors) adopt some of these management practices, we can help protect the seagrasses we have and maybe, increase the area of coverage naturally. All will be good.
If you have any questions concerning local seagrasses, contact your local Extension Office.
In Part 5 of this series, we looked at a group of invertebrates that few people see, and no one is looking for – worms. But in this article, we will be looking at a group that seagrass explorers see frequently and some, like the bay scallop, we are actually looking for – these are the mollusks.
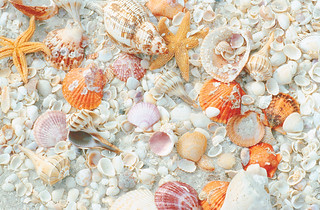
With over 80,000 species, mollusk are one of the more successful groups of animals on the planet. Most fall into the group we call “seashells” and shell collection has been popular for centuries. There is an amazing diversity of shapes, sizes, and colors with the snail and clam shells found in coastal areas worldwide. As snorkelers explore the seagrass beds it is hard to miss the many varieties that exist there.
Seashells have been collected by humans for centuries.
Photo: Florida Sea Grant
One group are the snails. These typically have a single shell that is coiled either to the right or left around a columella. Some are long and thin with a extended shell covering their siphon (a tube used by the animal to draw water into the body for breathing). Others are more round and ball-shaped. Each has an opening known as the aperture where the animal can extend its large fleshy foot and crawl across the bottom of the bay. They can also extend their head which has an active brain and eyes. Snails lack teeth as we know them, but many do have a single tooth-like structure called a radula embedded in their tongue. They can use this radula to scrape algae off of rocks, shells, and even grass blades. Others will use it as a drill and literally drill into other mollusk shells to feed on the soft flesh beneath.
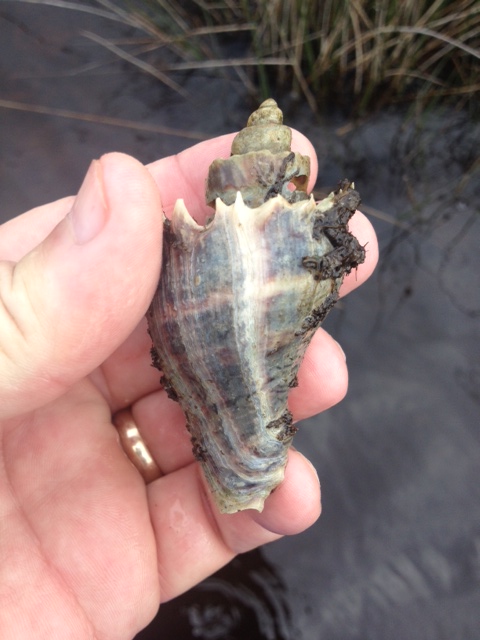
In the Pensacola area, the crown conch (XXX) is one of the more common snails found in the grasses. This is a predator moving throughout the meadow seeking prey they can capture and consume. Lighting whelks, tulip shells, and horse conchs are other large snails that can be found here. You can often find their egg cases wrapped around grass blades. These look like long chains, or clusters, of disks, or tubes, that feel like plastic but are filled with hundreds of developing offspring.
The white spines along the whorl give this snail its common name – crown conch.
Photo: Rick O’Connor
A close cousin of the snail are the sea slugs and there is one that frequent our grassed called the “sea hare”. This large (6-7 inch) blob colored a mottled green/gray color, moves throughout the grass seeking vegetation to feed on. When approached, or handled, by a snorkeler, they will release a purple dye as a “smoke screen” to avoid detection. Snails secrete a calcium carbonate shell from a thin piece of tissue covering their skin called a mantle. The genetics of the species determines what this shell will look like, but they are serve as a very effective against most predators. Most… some fish and others have developed ways to get past this defense. But the slugs lack this shell and have had to develop other means of defense – such as toxins and ink.
This green blob is actually a sea slug known as a sea hare. It was returned to the water.
Photo: Rick O’Connor
A separate class of mollusk are the bivalves. These do not move as well as their snail cousins but there are NO access points to the soft body when the shell is completely closed – other than drilling through. One creature who is good at opening them are starfish. Seabirds are known to drop these on roads and buildings trying to crack them open. But for the most part, it is a pretty good defense.
Bivalves possess two siphons, one drawing water in, the other expelling it, and use this not only for breathing but for collecting food – all bivalves are filter feeders. They will, at times, inhale sand particles that they cannot expel. The tend to secrete nacre (mother of pearl – shell material) over these sand grains forming pearls. Most of these are not round and are of little value to humans. But occasionally…
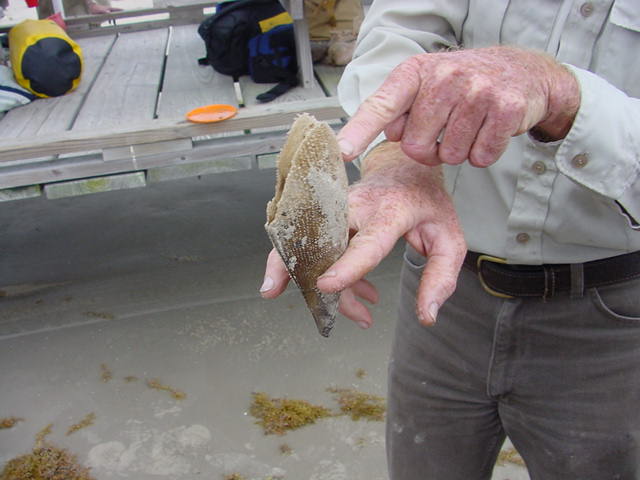
The pen clam is a common bivalve found in grassbeds.
Photo: Victoria College.
Oysters may be one of the more famous of the bivalves, but they are not as common in seagrass beds as other species. Most of our seagrass species require higher salinities which support both oyster predators and disease, thus we do not see as many in the grasses. Clams are different. They do quite well here, though we do not see them often because they bury within the substrate. We more often see the remaining shells after they have been consumed, or otherwise died. The southern quahog, pen shell, and razor clam are clams common to our grassbeds.
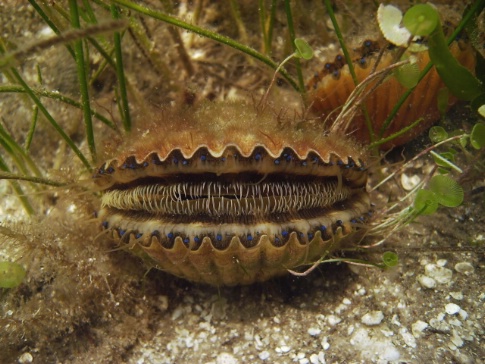
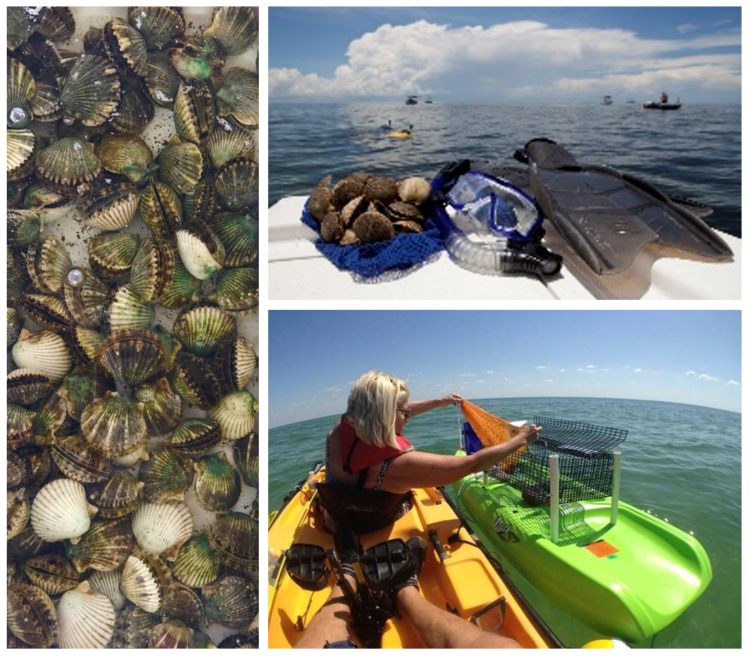
The one group sought after are the bay scallops. Scallops differ from their bivalve cousins in that they have small blue eyes at the end of each ridge on the shell that can detect predators and have the ability to swim to get away. They usually sit on top of the grasses and require them for their young (spat) to settle out. They are a very popular recreational fishery in the Big Bend area where thousands come very year to get their quota of this sweet tasting seafood product.
Bay Scallop.
Photo: FWC
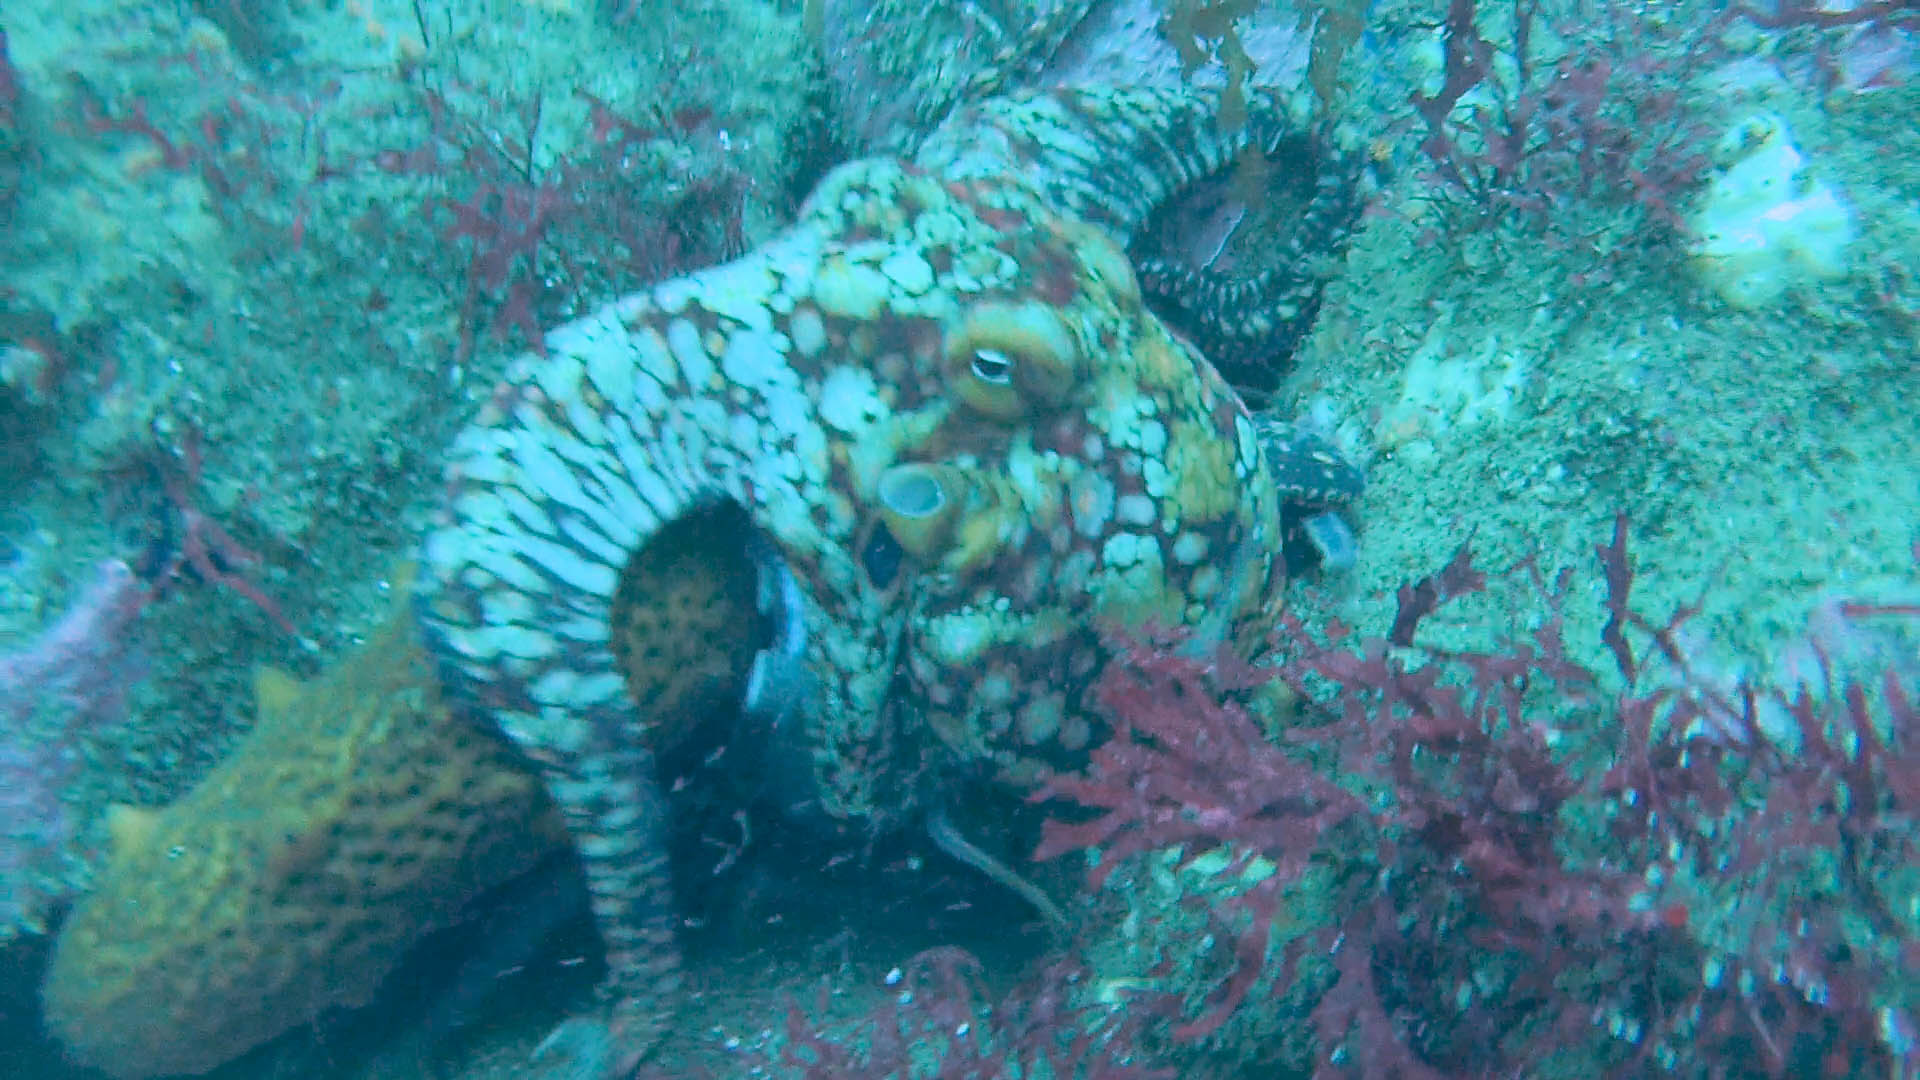
There is another group of mollusk that are – at times – encountered in the seagrass beds… the cephalopods. These are mollusk that have lost their external calcium carbonate shells and use other means to defend themselves. This includes speed (they are very fast), color change (they have cells called chromatophores that allow them to do this), literally changing the texture of their skin to look and feel like the environment they are in at the moment, and expelling ink like some of the slugs. This includes the octopus and squid. Both are more active at night but have been seen during daylight hours.
The chromatophores allow the cephalopods to change colors and patterns to blend in.
Photo: California Sea Grant
As mentioned, shell collecting is very popular and finding mollusk shells in the grassbeds is something many explorers get excited about. You should understand that taking a shell with a living organism still within is not good. Some areas, including state parks, do not allow the removal of empty ones either. You should check before removing.
When most hear the word worm unpleasant things come to mind. “Gross”, “dirty”, “decaying”, “disease”, “rotten”, are a few. And then there is the whole parasite thing. But then there are those who like them. Gardeners, kids, and fishermen find earthworms in particular pretty cool. They are not the typical creature we look for on a hike, or search for on a TV documentary, and they are certain not at the top of creatures you would be looking for while exploring a seagrass bed – but they are there.
According to the 4th Edition of Robert Barnes’s Invertebrate Zoology (1980) there are at least 11 phyla of worms, and he mentions no fewer than six classes. It is an extremely diverse group of creatures, and many are the bridge between the simple animals and the more complex. In this article we will focus on four phyla of the more common worms, or least the ones most commonly known.
These phyla are divided by body shape and internal complexity. The simplest are the flatworms (flukes and tapeworms), the more complex are the annelids (earthworms and leeches). The vast majority of these animals are very small (less than one centimeter) and not seen by the casual snorkeler. Some of the nemerteans (a phyla of flatworm) and the segmented polychaetes (related to earthworms) are quitter large and are easily seen by us.
The polychaetes may be the most familiar to us. These are segmented worms in the phylum Annelida. They are segmented like their cousins the earthworm but differ in that (a) each segment has a small leg-like structure (parapodia) and (b) they like marine conditions.
Neredia are one of the more common polychaete worms.
Photo: University of California Berkley
They resemble centipedes crawling in and amongst the seagrass blades and are often found within seashells we pick up and explore. They are basically harmless, and many species are the “garbage feeders” doing an excellent job keeping the system clean. We often see their “volcano” like burrows in the sandy areas within a seagrass meadows and many species produce glob-like gelatinous egg sacs that seagrass explorers confuse with jellyfish. There are also those that produce tubes. Some of these tubes are paper-like with bits of shell and other debris embedded in them. They produce these using mucous from their bodies to cement them together, place the tube within the sediment in a vertical position, and then live in them. Other tubeworms will produce their tubes out of shell material (calcium carbonate) forming snake-like structures on the surface of shells and discarded beer cans. And then there are a few called bristle worms. These are large and crawl across the surface of the substrate but have thin spines that extend off their bodies like cactus. Many of these do have venom and can be quite painful.
Polychaetes are the most advanced of the marine worms in the seagrass beds. Possessing a brain that is connected to sensory organs that can detect light and chemicals in the water, they can both find prey, and avoid predators. Prey varies between species. Most polychaetes can invert their pharynx (rather quickly) to grab prey using tooth like jaws. The carnivorous ones feed on small invertebrates (including other polychaetes). Others will use these jaws to scrap algae from shells and grass blades and are scavengers. Most reproduce sexually where there are both males and females and they possess a complete digestive tract (including a mouth and an anus) – as you will see… not worms do. In 1980 there were about 5300 species of them worldwide.
Nemertean worms are another large marine worm, but one few people have seen. This is because they are more nocturnal by habit. They are not segmented but rather are flat and gelatinous. They possess a proboscis that can be “launched” by the worm, that has a stylet (spear) at the tip – like a pole-spear gun. They use this to hunt invertebrates and find them by using their sense of smell. They also reproduce sexually, and there are separate males and females, but many will fragment into smaller worms when irritated. There are two classes and four orders of these worms worldwide.
Most of the remaining worms are either so tiny you will not find them or are endoparasites living within some vertebrate or invertebrate host within the seagrass community. The more famous group are the flatworms. These include the parasitic flukes and tapeworms. However, there is a class of free-swimming flatworms that crawl (or swim) around the “seagrass forest”.
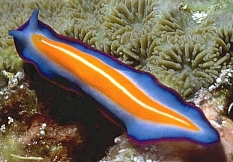
The swimming ones are known as tubellarians. Most are clear or opaque, but in the coral reef community some are very colorful. Flatworms are the more basic members of the worm group. They lack a complete digestive system and must both eat and expel waste through the same opening (the mouth). Some tubellarians feed on small invertebrates which they capture and engulf without using teeth. Others feed on dead and decaying creatures, again – cleaning the environment. There are some that live commensally with mollusk and crustaceans. There is one that is rather large and can be seen on the gills of horseshoe crabs. They do have a simple brain and sense the world by detecting light, a sense of touch, and smell. In 1980 they reported about 3000 species worldwide.
This colorful worm is a marine turbellarian.
Photo: University of Alberta
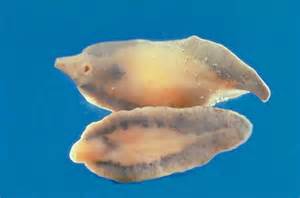
The parasitic flatworms include the famous flukes and tapeworms. These live within the bodies of their hosts feeding on mucous, cells, tissue, and blood (yep – here is the “gross” “disgusting” thoughts we mentioned at the beginning). They possess tough skin to protect them from the digestive enzymes of their host. Most reproduce sexually but are hermaphroditic (each worm being able to produce both sperm and egg). Most require secondary hosts to complete their life cycle. For example, they may live in the gut of a spotted seatrout but will need to complete their larval stage in the gut of a mollusk. So, the eggs are released with the feces of the trout, the larva find a mollusk and enter, develop, and then expelled again via feces to once again find a trout. It’s a wonder they can do this – but they do.
The human liver fluke. One of the trematode flatworms that are parasitic.
Photo: University of Pennsylvania
The tapeworms cycle differs in that their head is round and has a series of hooks they use to embed into the intestinal tract of their host. The rest of their body is flat and segmented (each segment called a proglottid). These proglottids are released into the environment to find another host.
You may now be afraid of becoming infested with parasitic worms if snorkeling in seagrass beds. Fear not… these animals are VERY specific about the host they can survive with – and you are not one of them. Most seagrass explorers do not think of worms when they visit this community, and probably will not see any, but they are there and play an important role in keeping the system healthy.
The Florida Fish & Wildlife Conservation Commission and UF/IFAS Extension – Florida Sea Grant have partnered to implement an innovative community-driven effort to restore scallop populations, and we need your help! “Scallop Sitter” volunteers are trained to assist in Bay, Gulf and Franklin Counties. The goal of the program is to increase scallop populations in our local bays. Scallop sitters help reintroduce scallops into suitable areas from which they have disappeared.
Volunteers manage predator exclusion cages of scallops, which are either placed in the bay or by a dock. The cages provide a safe environment for the scallops to live and reproduce, and in turn repopulate the bays. Volunteers make monthly visits from June until December to their assigned cages where they clean scallops (algal and barnacles can attach), check mortality rate and collect salinity data that helps us determine restoration goals and success in targeted areas.
1. Click on the “reserve a spot” to select the county you are participating in.*You must provide your name, contact information and date of birth to secure an FWC permit for your cage!
2. You will be sent a registration survey via email (closer to the scallops, cage & supply pickup date or you may fill out a survey onsite) , view the virtual training link: https://myfwc.com/research/saltwater/mollusc/bay-scallops/sign-up/
and you’ll receive an invite to our Panhandle Scallop Sitter Facebook Group.
DEADLINE for steps 1 & 2 are May 25th!
3. Pick up your scallops, cage & supplies!
Pickup Information (all times local)
St. George Sound Volunteers
Date: Thursday, June 1st
Time: 10:00 AM – 1:00 PM
Location: FSU Coastal & Marine Lab (across the canal – see road signage)
3618 US-98, St. Teresa, FL 32358
St. Joseph Bay Volunteers
Date: Thursday, June 8th
Time: 10:00 – 1:00 PM
Location: St. Joseph Bay State Buffer Preserve Lodge
3915 State Road 30-A, Port St. Joe, FL 32456
St. Andrew Bay Volunteers
Date: Thursday, June 16th
Time: 10:00 AM – 1:00 PM
*We know issues happen from time to time with scallop populations. It’s a bummer. If you loose a significant amount of scallops early in this year’s program, we will do our best to accommodate our volunteers with a “second wave” scallop stocking event in August. Also, looking for other ways to help our program? We plan to offer cage building workshops in the fall, stay tuned!