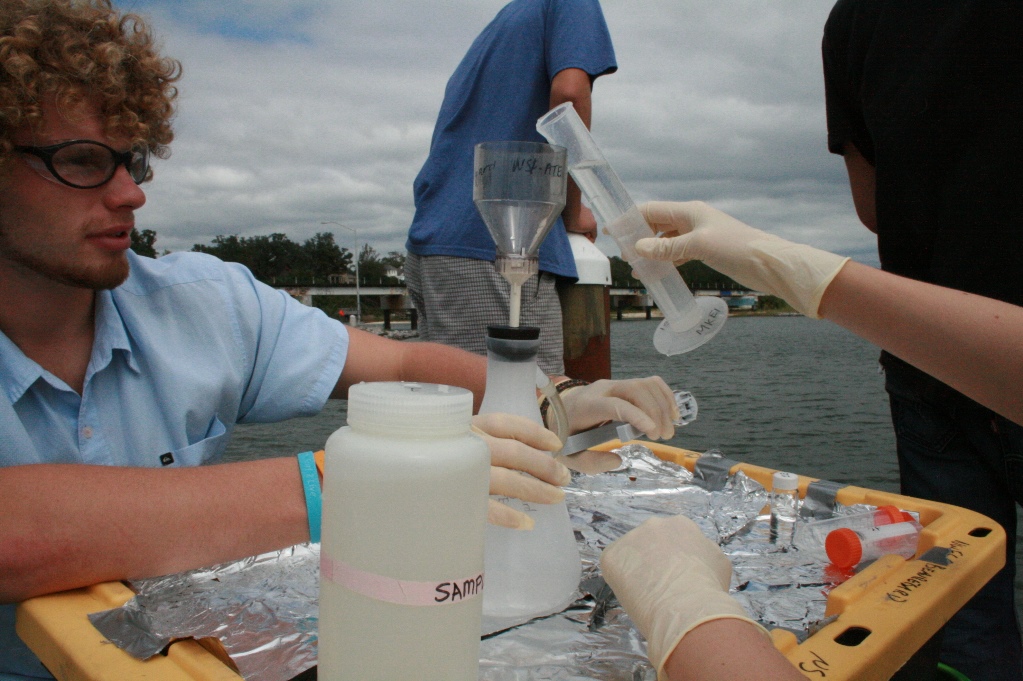
Part of the 2019 UF IFAS social media survey across Florida found that many Floridians understood how septic systems worked, but fewer understood how sewer systems functioned. This article is going to try and tell you the basics of how sewage treatment works.
As we just mentioned, many people have no idea where their sewage goes after they flush – nor do they care – as long as it does not stay here 😊. When we flush – it goes – and that is all we think about. This is one of the advantages of sewer over septic – you do not have to maintain anything. You just flush and go. However, we will see in Part 4 that there are some things that are still on us to help keep sanitary sewage from reaching our coastal waterways.
So – where does the sewage go when we are on a sewer system?
The raw sewage leaves our house through a pipe called the lateral. This line connects to the municipal sewage line under the street. From here it flows to the local sewage treatment facility. In some communities, this is downhill from the residential area, and the sewage flows via gravity. In others, it is uphill and must use a series of pumps, or lift stations, to get the raw sewage to the treatment plant.
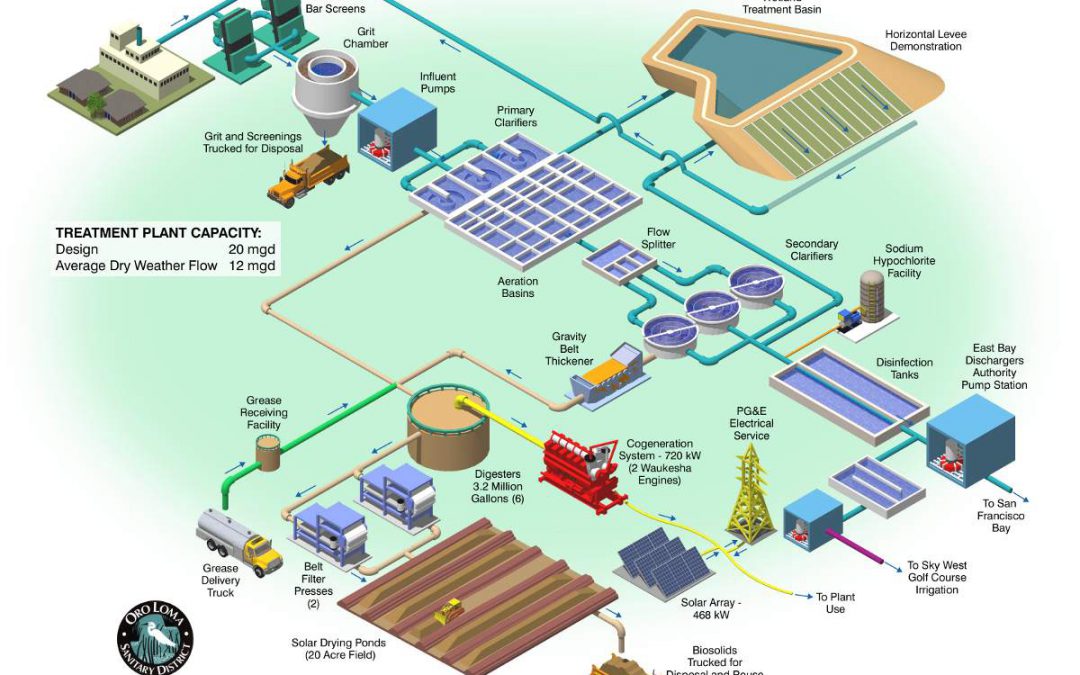
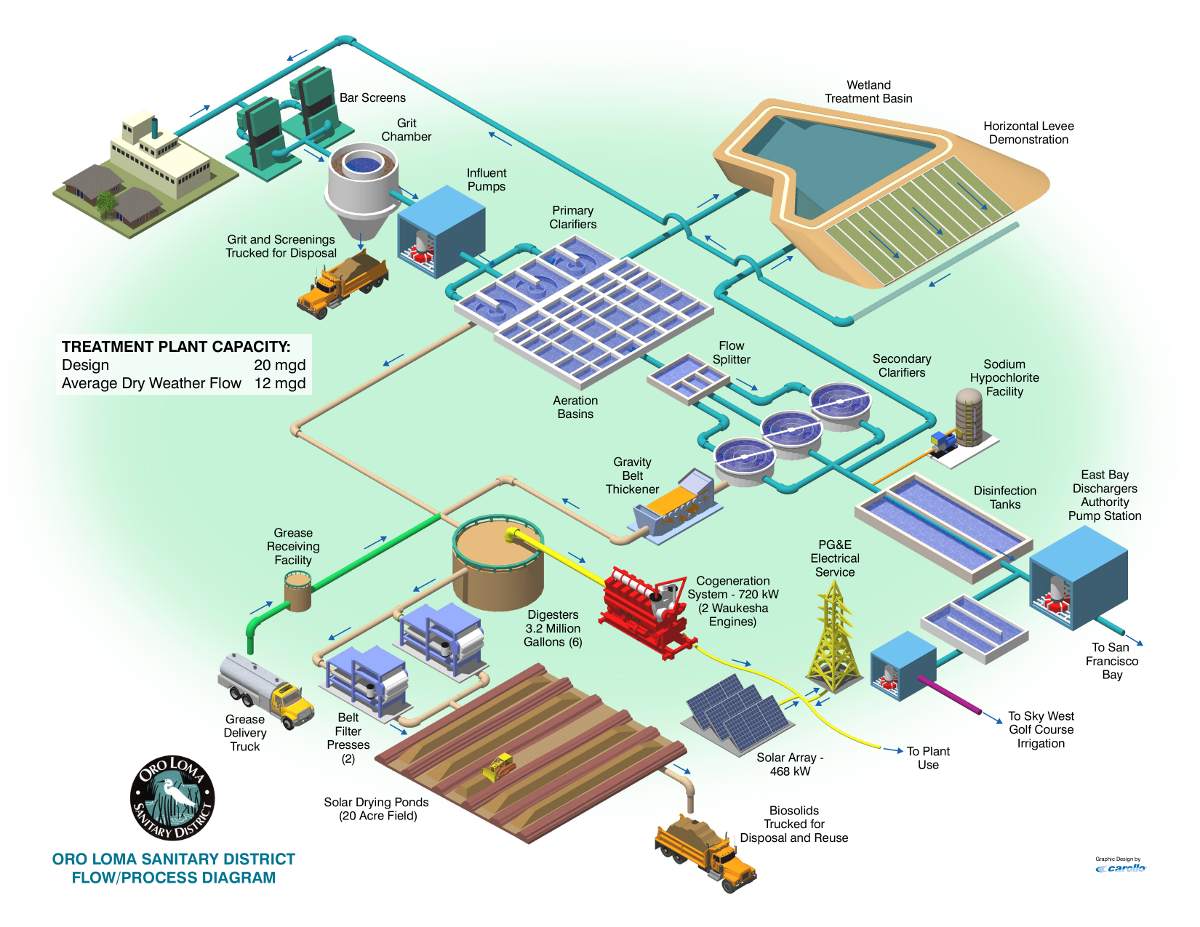
Sewage treatment facility.
Image: Oro Loma Sanitary District.
Once it reaches the plant the sewage undergoes PRIMARY TREATMENT. This is a series of methods that physically treats the waste. Often, stop #1 is a screen that removes large objects. You would be surprised what ends up in the sewer lines heading to the treatment facility. Wood, boxes, and plastic bags. I heard one treatment plant found a small hog in their screen system.
Once past the screens the wastewater is run through a grit chamber. This continues the physical process of removing large objects from the wastewater as it trickles through. Material such as sand and rock settles to the bottom of the chamber. This settled material can be removed, treated, and disposed of.
The effluent (water) continues on to stop #3 – the settling tank. Here it is allowed to sit so that smaller fine solids can settle to the bottom of the tank – not that different if you placed muddy water into a clear 1-gallon jar and allowed it sit, the mud would slowly settle to the bottom making the water clearer. This settled material contains much of the solid waste from when we went to the restroom. Here it is called sludge. The sludge is drained off, treated, and usually dried in a pile that would resemble dirt. Some communities load this into trucks and take it to a designated area in the landfill. Some communities will use it as a fertilizer on crops. Some countries allow this but not for crops that will be used as food. I heard some locations around the world use the dried material to form bricks and building materials.
Studies show that primary treatment can remove as much as 60% of the suspended solids and 30-40% of the organic waste that is oxygen-demanding in an aquatic system.
But…
It does not remove pathogens that maybe be in the sewage, phosphates and nitrates that can cause eutrophication, salts which alter the salinity and living conditions for aquatic life, radioisotopes, nor pesticides. For this, we will need secondary treatment.
The clearer effluent remaining after settling moves to SECONDARYTREATMENT. Where primary treatment was a physical method of treating wastewater, secondary treatment is a biological method. Stop #1 is the aerationtank. Here the effluent is aerated using a sprinkler system that provides oxygen so that the microbes living in the tank can further break down any pathogens and other biological demanding waste. This treated water is then sent to a second settling tank where more sludge is allowed to settle. The settled sludge is then cycled back into the aeration tank – and the process continues. The clearer water at the surface of the second settling tank is then sent to a tank where is disinfected – often with chlorine. If balanced correctly, the amount of chlorine added is enough to kill much of the remaining bacteria but not high enough to be a threat to the environment. This water is then analyzed for contaminants, including fecal bacteria, and – if it passes the test – is discharged into a local waterway as treated sewage. Studies have found that a combination of primary and secondary treatment can remove 95-97% of the suspended solids and oxygen-demanding waste, 70% of most toxic metal compounds, 70% of the phosphorus, and 50% of the nitrogen.
For many communities this is good and is the end of the line. For others, they are willing to spend additional dollars and move to more advanced treatments before discharge – what is called TERTIARY TREATMENT. One method of tertiary treatment is using a series of filters that can reduce the levels of phosphates and nitrates remaining in the effluent. These compounds are the ones that trigger eutrophication and algal blooms and many communities feel the extra charge on their bill is worth it. These filters can actually remove some viruses. Some use chlorine for a second round, however studies have shown that increased amounts of chlorine can react with organic materials to form chlorinated hydrocarbons – which have been linked to cancers, miscarriages, and damage to human nervous, immune, and endocrine systems. For those going this route, many have opted for UV radiation or ozone treatment in lieu of more chlorine.
After either secondary or tertiary treatment, many municipalities run their treated effluent through a marsh or swamp before it reaches the open water systems. Studies have shown that these plants are very good at up taking nutrients, and some other contaminants, as the water flows through them.
Many feel this is a better method of treating human waste than a septic system. One point is that YOU do not have to manage your tank – the city does. Though this is true there is a monthly bill to pay for this service and some would rather not pay that. It is also important to understand that you are not quite off the hook yet. There is maintenance needed to the sewer system BY THE HOMEOWNER, and we will discuss this in Part 4.
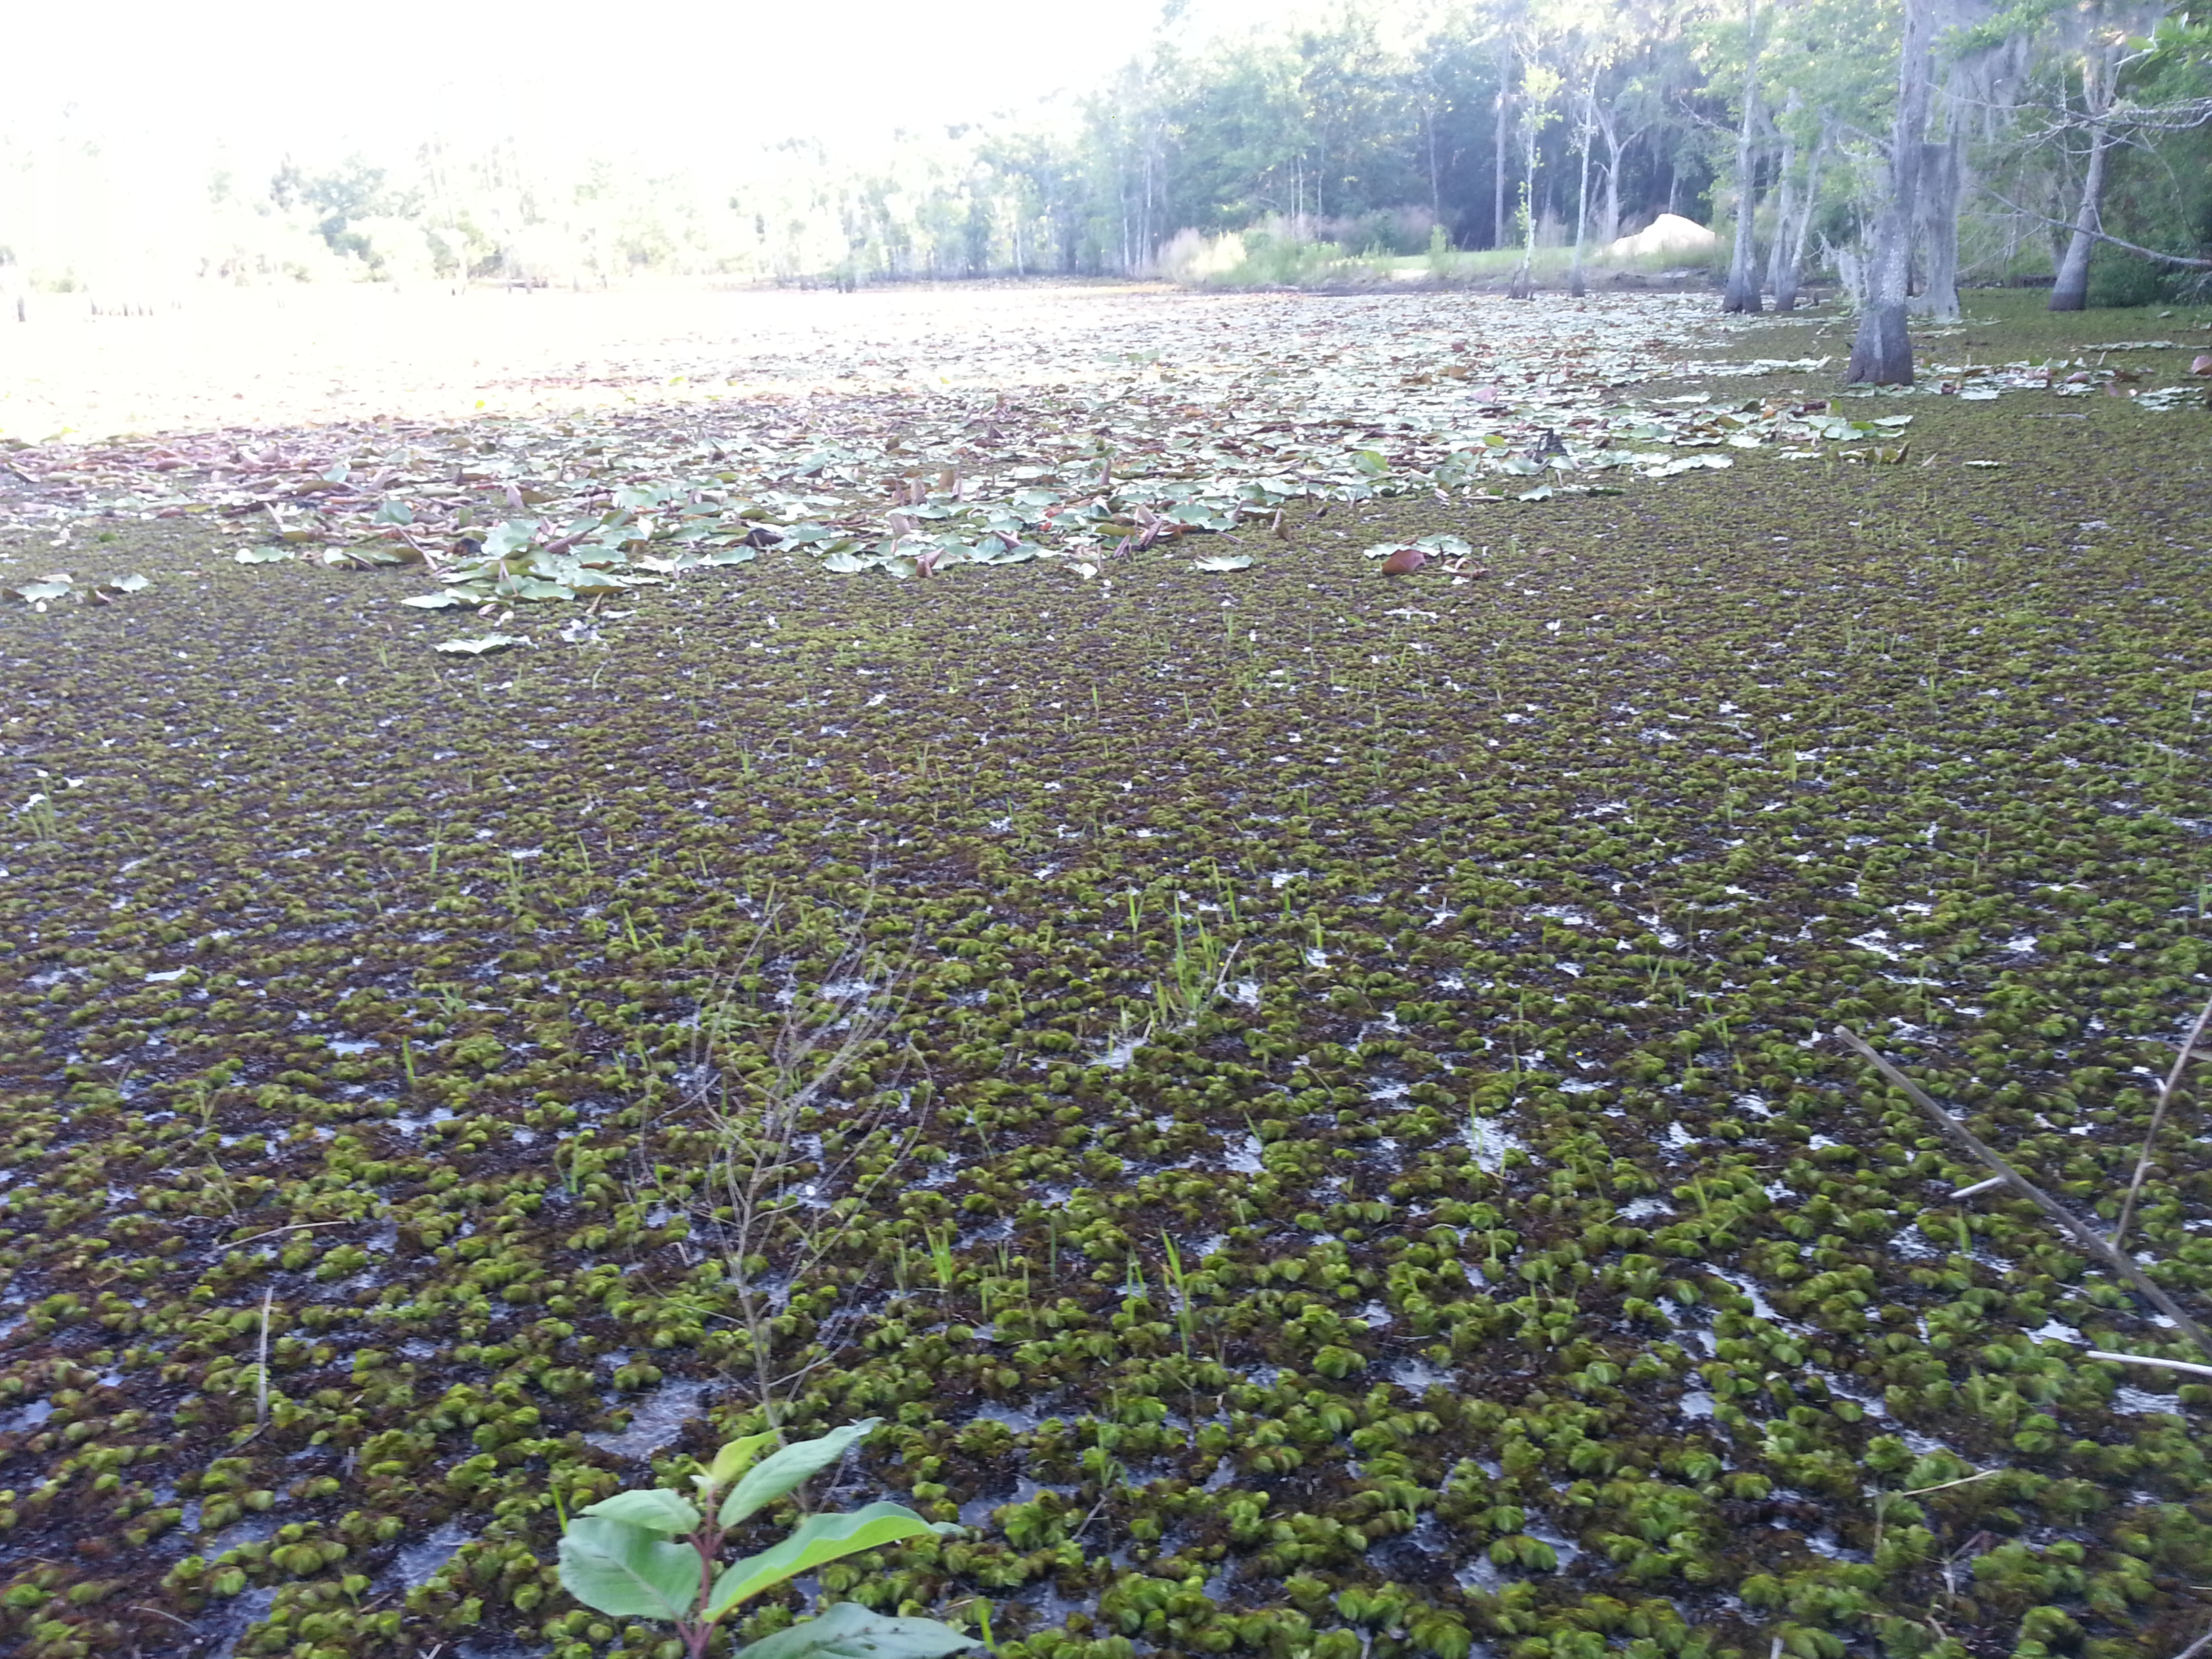
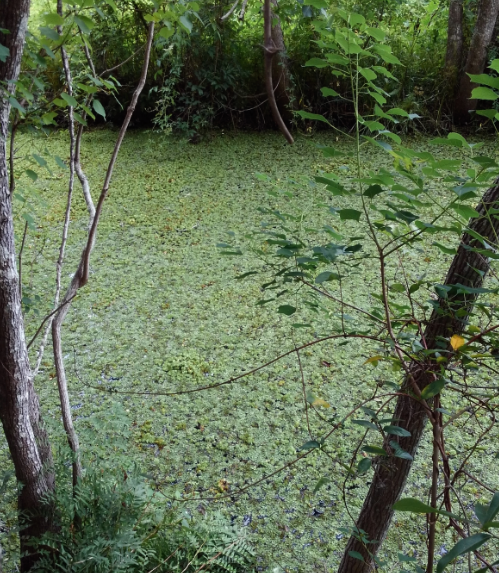
Despite its name, giant salvinia (Salvinia molesta) is actually pretty small. The floating plant starts out with a cluster of leaves no bigger than a dime. They don’t stay that way, though, and perhaps their outsized influence and spread gives the “giant” a little more credence.
Giant salvinia is an invasive aquatic plant that was introduced to the United States as an ornamental plant (for aquariums and backyard ponds) from South America. Once it managed to escape to the wild, however, salvinia really took off. More than 20 states report salvinia popping up in their waters, although Texas and Louisiana seem to have the biggest battles with it. The plant has choked up entire freshwater lakes and sections of rivers, requiring a major eradication effort just to regain access to the water. Even small craft like kayaks and canoes cannot make it through a water body clogged with this plant. It is often spread by small pieces lodging in boat motors and trailers, so if you boat frequently in an area of known salvinia, be sure to remove any fragments of the plant once you are back on land. Preventing the spread from one water body to another is crucial.
Our native birds, fish, and aquatic mammals don’t eat giant salvinia—it appears not to have much nutritional value—and therefore its growth goes unchecked. The thick mats of plant growth block sunlight into the water column, preventing other aquatic plants from growing. Die-offs of large numbers of salvinia can eat up oxygen levels in the water, causing fish kills.
Giant salvinia overgrowth in a backwater section of Bayou Chico in Escambia County. Photo credit: Escambia County Natural Resource Management
There are several approaches to managing the plant. Mechanical or hand removal can take out significant amounts of salvinia, but is ineffective in the long run. Any small piece of chopped up plant left behind in the process will regrow into new spreading plants, so leaving any fragments in the water ends up increasing the population. More effective methods include applying herbicides or using a biocontrol insect called the salvinia weevil. This South American beetle (Cyrtobagous salviniae) is very small (only 2 mm as an adult) but feeds exclusively on salvinia plants, stunting their growth and causing them to sink underwater. A well-established salvinia weevil population can effectively manage large infestations of the plant, dropping coverage by 90%.
One natural check to unfettered growth in our area is that salvinia tends to thrive only in freshwater or very low salinity water bodies. We have identified populations of salvinia in the upper reaches of local bayous in Escambia County, but as salinity levels increase closer to the bay, the plant seems unable to establish itself.
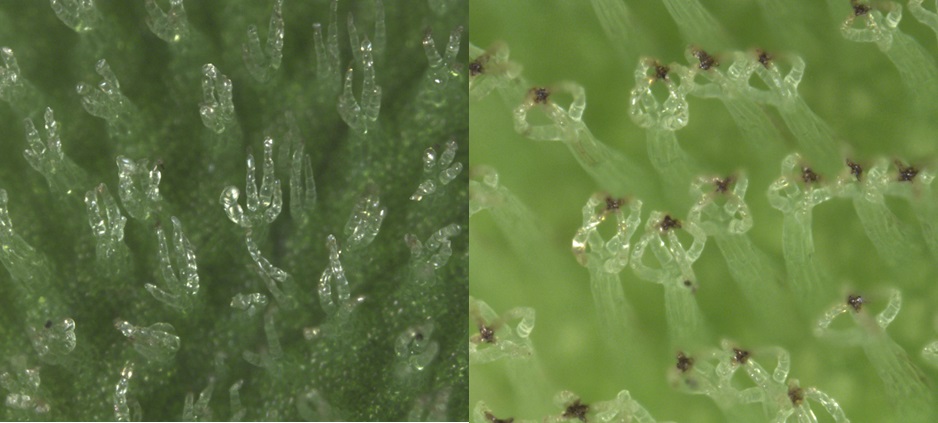
Identification of giant salvinia is rather fascinating, as you need a hand lens to definitively distinguish it from a very similar nonnative species called water spangles or water fern (Salvinia minima). Both species have small clear-white, upright hairs covering the leaves. When examined closely, the observer will note that in giant salvinia that double pairs of hairs form a structure very similar to an egg beater, whereas in water spangles the leaf hairs do not connect.
Giant salvinia can be distinguished from its cousin, common salvinia (Salvinia minima) by the shape of its trichomes, or leaf-hairs. Giant salvinia’s leaf hairs (right) are closed at the tip, forming an “egg-beater” shape, whereas common salvinia’s leaf hairs (left) are branched at the tip. Giant salvinia is a larger plant that forms thicker, denser mats. Common salvinia can cover large areas but typically forms thinner mats and does not pose as much risk to boating traffic. Photos and caption courtesy LSU AgCenter
If you think you see giant salvinia in a local water body, we would love to know. It is an aggressive invasive plant that is relatively new to the area, and we have a chance to keep this from spreading with your help. What can you do?
Contact the Escambia County Division of Water Quality and Land Management – (850) 595-3496
Contact the Escambia County Extension Office – (850) 475-5230 ext. 1111
Report in the EDDMapS national database – https://www.eddmaps.org – select “report sightings”
If you find just a small amount, remove it and allow to dry out on your property. Once dried you can double bag and dispose of it.
In Part 1 of Reducing Health Advisories, we discussed how owners of septic systems could develop a management plan to reduce such health advisories. In Part 2 we look at another option for septic system owners – converting to the local sewer system.
You might begin by asking – “why would I want to do that?”. It’s a fair question. If my septic system is working properly, do I need to convert to sewer? But is it? Some septic systems were not placed in a good location, and the general maintenance you would follow could still lead to leaking fecal bacteria. You may find that to move such a system to a better location would be more costly than tying in with the local sewer system. You may find that no where on your property is a suitable location for a septic system and conversion is needed. There is also the possibility that you septic system needs major repairs due to misuse or age, and that a sewer conversion is a cheaper option. There are several reasons why it might be time to convert.
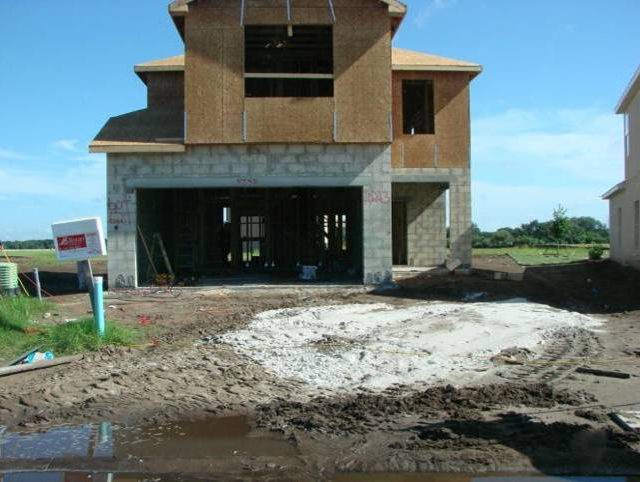
With increase housing development in the panhandle comes an opportunity to convert from septic to sewer systems.
Photo: UF IFAS
Yet, across the state there has been some resistance to converting. In 2020, a University of Florida research team conducted a social survey across the state to determine why many septic system owners were resistant to converting to a sewer system. The survey was sent to 1,604 Florida residents in September of 2020 hoping to get 500 responses – usable responses were obtained from 517 people (32%). The key findings were broken down into categories – explained below.
Knowledge. The average score on the knowledge assessment was 54.7% – suggesting that they had some understanding of septic to sewer conversion topics. 64.8% could identify a graphic of a septic system, but only 57.1% could do the same for a sewer system. 82.8% could state who was responsible for maintaining a septic system, but only 48% could state who was responsible for the sewer. Only 33.1% could correctly state how often a septic system needed to be pumped out. They only slightly agreed that they understood the steps (or the costs) of converting from septic to sewer.
Attitude. Respondents had only a slightly positive attitude towards septic to sewer conversion. Most saw it as more useful and doable, but were not sure whether it was easy or not, and most felt it was too expensive.
Benefits and Barriers. Most agreed that converting reduced the maintenance responsibility on the homeowner and freed property for other uses. They agreed less that it made them a better neighbor. The major barriers to converting were (a) availability to hook up, (b) upfront costs, (c) and having to pay a monthly sewer bill. There was also a lack of interest in doing so. Suggested barriers they do not see as a major problem included (a) the fear of large scale sewer spills, (b) and having time to think about doing the conversion.
Diffusion and Innovations. Most agreed that sewer systems were more advantageous than septic systems – that they cause less trouble for the homeowner. They also believed that converting to sewer was within their needs, values, and beliefs. They believed that all communities should convert to sewer and that it was the responsible thing to do. 1
The results of the above study suggest that most Floridians believe that IF conversion is available, it is the right thing to do. The primary reasons why they do not would include costs and having a monthly bill. Many also felt there was no interest in doing so. An interesting note here… in my community, there is a cost share program available for specific communities within the city limits. Despite assistance with costs, no one has responded asking to participate. This suggested that the monthly sewer bill and disinterest in the issue are still large barriers. Another thought is that even with cost sharing, their portion of the bill is still outside of their price range. In 2022 we attempted to have a focus group meeting with these communities to see which of the assumptions were correct – but there was little interest in participating in such a discussion group – so, we are not 100% sure why they do not participate.
All that said, conversion to a sewer system is an option for those on a septic system and there are benefits in doing so. As mentioned in the study, it takes much of the maintenance issues and concerns off of the property owner. Though properly maintained septic systems do a good job of treating fecal bacteria, sewer systems usually have three levels of treatment (sometimes more) decreasing the chance of health advisories. But they are not without their problems.
The survey suggested that Floridians are less aware of how their sewers work than a septic systems. In Part 3 we will look at how the sewer process operates. If you are a property owner with a septic system and interested in converting to sewer, contact your county health department to see how the process is done locally, and whether there is a cost share program.
1 Rampold, S. D., Krimsky, L., Telg, R. W., & Warner, L. (2021). Florida homeowners’ knowledge, perceptions, and informational needs regarding septic to sewer conversion. PIE2020/21-05. Gainesville, FL: University of Florida/IFAS Center for Public Issues Education.
Health advisories are issued by state and local health departments when levels of fecal bacteria become too high for the public to safely enter the water. Sewage can be a source of these fecal bacteria. They can harbor pathogenic organisms that can cause of a variety of health problems. State and local health departments routinely monitor local waterways, particularly where people recreate, to assure the level of fecal bacteria is not unsafe. It is understood that the presence of fecal bacteria in waterways is normal, animals do go the bathroom, but excessive levels can be unsafe.
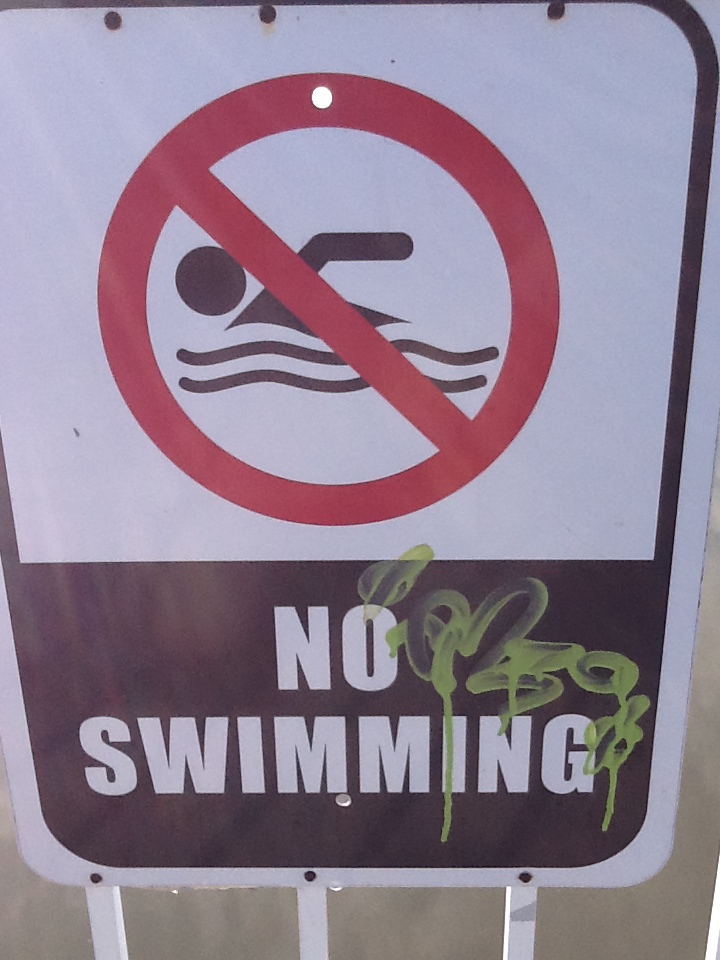
Closed due to bacteria.
Photo: Rick O’Connor
In the Pensacola Bay area, most of the human recreation areas near the barrier islands rarely have health advisories issued. Once every few years there is an issue at the sewage treatment facility on Pensacola Beach and an advisory is issued, or a sewage line is broken either near Santa Rosa Sound or Big Lagoon with the same results. But is very rare.
However, our local bayous are different. The neighborhoods are densely populated with old or outdated infrastructure, and how we manage these systems can cause problems as well. We are going to do a three-part series on what property owners can do to help reduce the number of health advisories issued in waterways where they are more common. In Part 1 we will look at how to maintain your septic system.
Septic systems were commonly used decades ago when city limits, and treatment facilities, were smaller. Many communities within our counties are on a septic system, and it falls on the property owner to properly maintain them.
Most understand how the system works, but for those who are not familiar – here are the basics.
When you flush your commode, take a shower, or wash your clothes, the wastewater leaves your house through a series of pipes and empties into a septic tank buried in your yard. These tanks are usually made of concrete and there are different sizes. A typical tank will be about 8 feet long x 4 feet wide x 6 feet deep and hold around 1000 gallons (again, sizes vary). The solid material settles to the bottom where it is broken down by living microbes. The oils and fats float to the surface forming a scum layer. The remaining wastewater settles in the middle of the tank and drains into a drain field through a series of perforated pipes.
The drain field should be made of less compacted soils to allow percolation into the surrounding environment. There is some physical, chemical, and biological treatment of the wastewater as it percolates, but only if the drain field is properly designed and located. For obvious reasons you should not (and most communities will not allow) have your drain field next to an open or public water system. In Florida it is required that the loose uncompacted soils must be no less than 24 inches above the wet/water table.
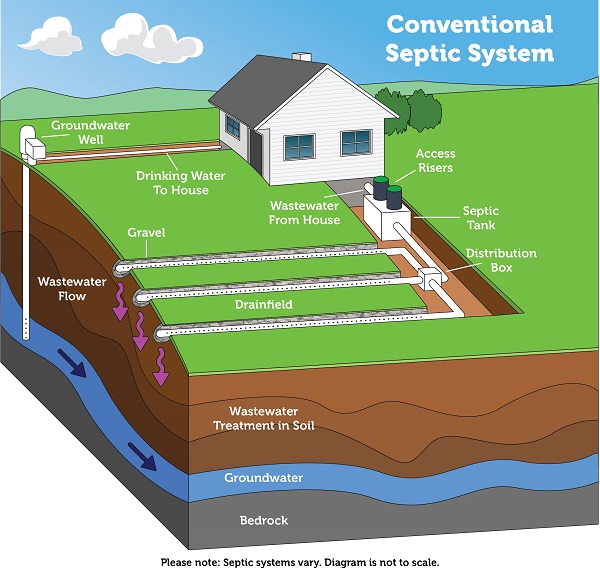
A conventional septic system is composed of a septic tank and a drainfield, where most of the wastewater treatment takes place. Image: US EPA
It has been found that if the septic system is placed in the correct location and maintained properly, it does a good job of removing pathogens from the wastewater. However, it was not designed to remove nutrients, which can still leach into waterways and cause algal blooms. And the presence of pharmaceuticals and household chemicals are not always removed, which can cause problems for aquatic wildlife. But to reduce health advisories they can work.
So…
How do we maintain our septic system so that it functions properly?
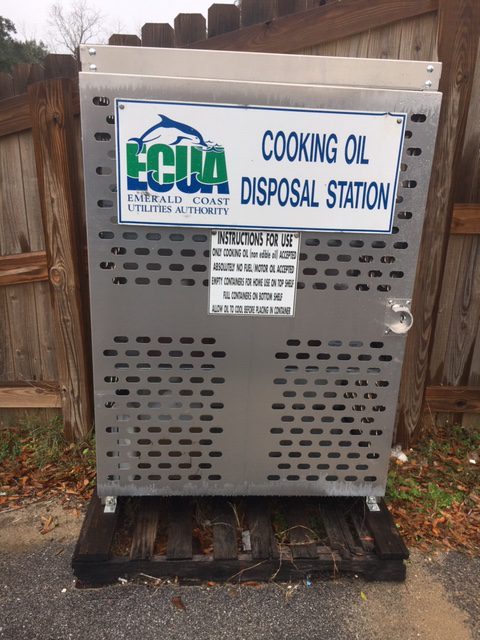
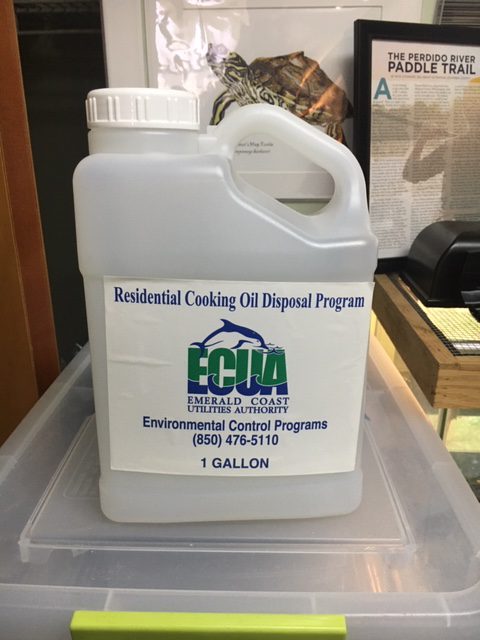
Watch what you pour down your drain. As mentioned above, many household chemicals and pharmaceuticals are not removed and become environmental problems when they leach from the drain fields into the local environment. Fats, oils, and grease (and even milk) can solidify and form the scum layer at the top of the septic tank. These solids can clog the lines running to the septic tank, or the drain field lines themselves. They can create back flows and could cause untreated sewage to back flow into your home. Our local utility offers the FOGProgram. In this program you can visit a local dispensing site (these can be found at ECUA’s website and there is one at the Escambia County Extension Office) to obtain as free 1-gallon plastic jug. Pour your bacon grease, oils, etc. into these containers. When full, return them to the dispensing location and swap out for a clean empty one. The service is free.
Watch how much water you use. As mentioned, septic tanks come in different sizes and are designed for a certain amount of water. “Flooding” of the system can occur if you are using more water than your system is designed for and this could include flooding of semi, or untreated, sewage.
The scum and solid layers of the tank need to be pumped out. It is recommended the septic systems are pumped once every 3-5 years, depending on the size of the tank. A pump out may cost you several hundreds of dollars, but a tank replacement is going to be in thousands – it is a good investment and will help reduce health advisories in local waterways.
Do not drive over your septic system, or drain field, with heavy vehicles. This could crack the tank and/or compact the soils within the drain field.
The FOG gallon containers are found in these metal cabinets placed around the county.
Photo: Rick O’Connor 1-gallon container provided free to dispose of your oil and grease.
Photo: Rick O’Connor
Studies have shown that a properly designed, properly placed, and properly maintained septic system will work well in reducing the presence of pathogenic fecal bacteria in our local waterways for up to 50 years. Note: like all things, even a good septic tank does have a live span. If you do not know the history of your septic system, we recommend you contact a certified professional to come do an assessment.
As always, if you have additional questions, do not hesitate to contact your county extension office.
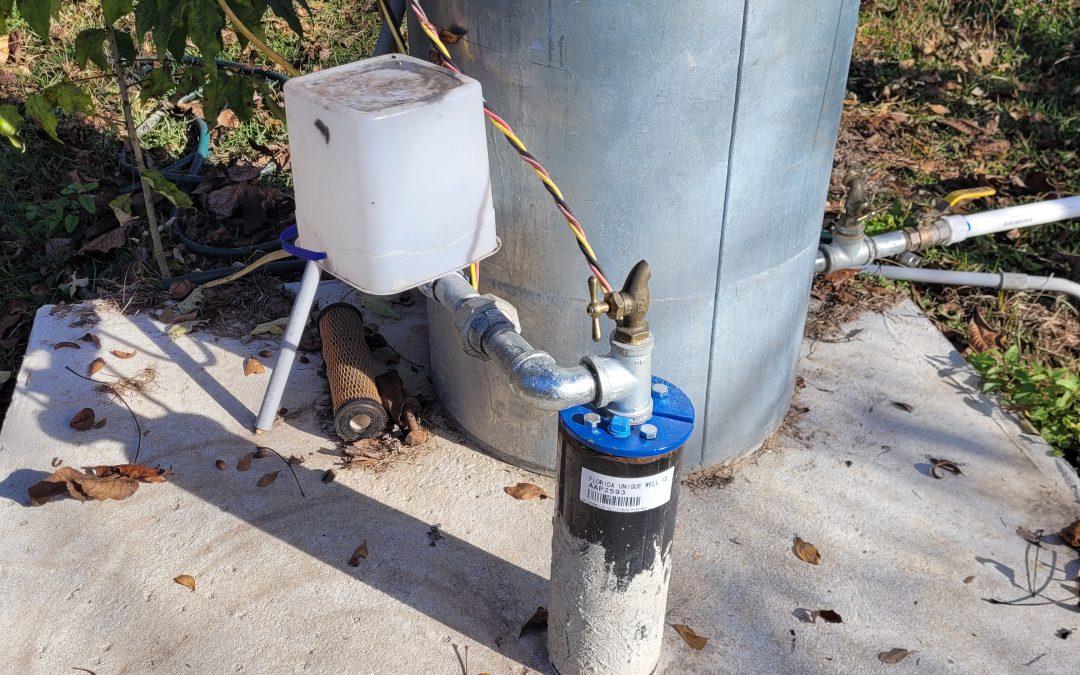
The sanitary well cap (blue metal plate on well casing) and concrete pad on top of a grout seal help protect well water from surface contaminants. The spigot on the well cap is solely for sampliing purposes and is a requirement in this specific area of NE Jackson County. Image: AJ Weiss, FDOH.
Many residents in the Florida Panhandle rely on groundwater from private wells for home consumption. While public water systems are regulated federally to ensure safe drinking water, private wells are not regulated. Well users are responsible for ensuring the safety of their water.
Recommended practices to protect your well water quality
Basic care at and around your well will reduce the risk of contaminating your well water.
Make sure that the well is properly sealed at the surface to keep pollutants from getting directly into your well and groundwater. A sanitary seal or sanitary well cap (which caps the surface end of the well casing) keeps surface water, pathogens, insects and other animals, chemicals, liquid fuels, and debris from getting directly into your well. Grout, which works as a sealant, is used to fill the space between the well casing and the edge of the borehole when a well is drilled. It prevents surface water from flowing down along the outside of the well casing directly to the groundwater being drawn by the well.
Keep the area around your well clean and accessible.
Make sure there is at least a 75 ft separation distance between your well and your septic system (this is required in Florida).
A well shouldn’t be close to (no less than 75 ft) or downhill from an animal enclosure.
Don’t store chemicals, fertilizers, or fuel near your well or in a well house.
Don’t use a well (residential or agricultural) as a chemical mixing station.
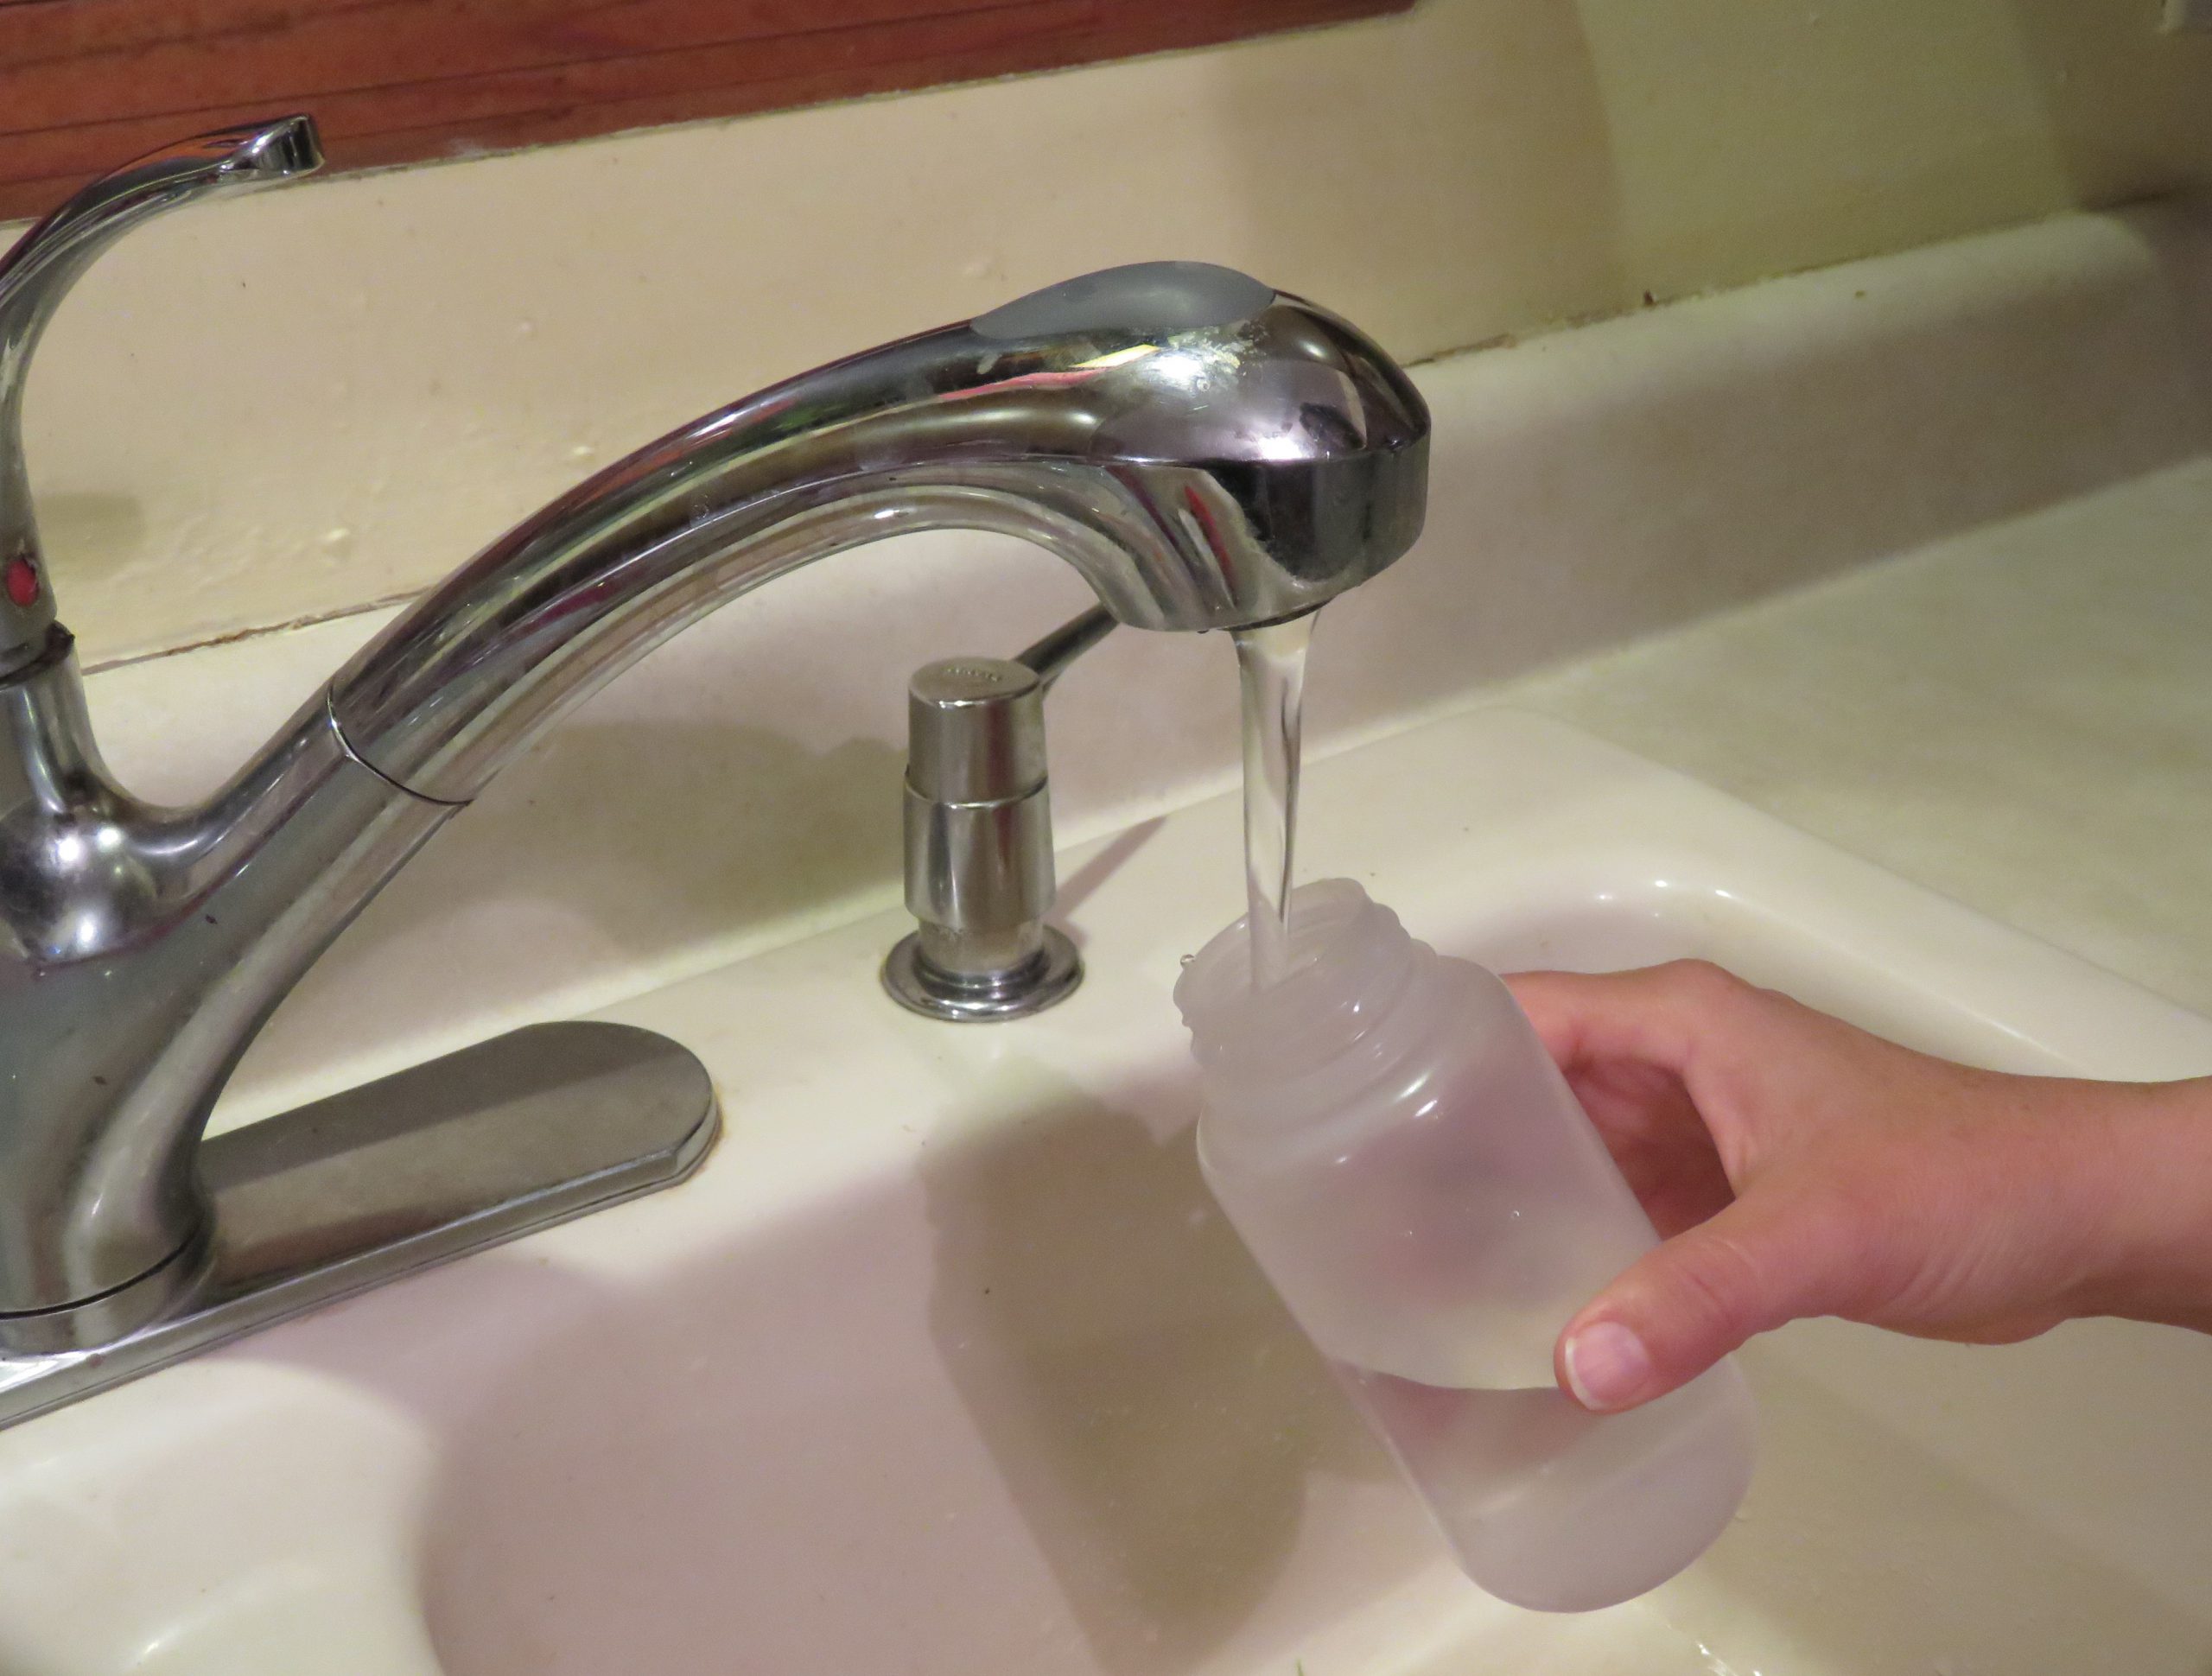
What should you test your well water for and where can you have it tested?
Contact you local county health department office for information on how to test your well water to ensure it is safe to drink. Image: F. Alvarado
At a minimum, the Florida Department of Health (FDOH) recommends testing drinking water annually for bacteria (total coliform bacteria and fecal coliforms, usually E. coli). Other contaminants that they recommend testing for include nitrate, lead, and pH.
Depending on where you live and current or past activities in your area, other contaminants may affect your well water quality. Call your local health department to see what they advise testing for. It’s also important to reach out to them for testing recommendations when:
There is a change in the taste, appearance, or odor of your water
There is recurring gastrointestinal illness or other unexplained illness in the household
Your well is flooded or damaged
You have a spill of oil, liquid fuels, solvents, or other chemicals into or near your well
Any time services or repairs are done and the sanitary seal on your well is opened
Many county health departments provide testing for bacterial contamination at a minimum. If they do not offer testing for a particular contaminant, they can help point you to commercial labs in the area for testing. The Florida Department of Environmental Protection (FDEP) also maintains a list of certified water testing labs, which you can search by county. Through good maintenance practices and annual testing, you can help maintain your well water quality.
We all know how important oxygen is to all life. It is an element with the atomic number of 8, meaning it has eight protons and eight electrons. It has an atomic mass of 16 indicating that it also has eight neutrons. Oxygen is a gas at room temperature indicating that 70°F is VERY hot for this element. It is a diatomic molecule, meaning that it likes to combine with other elements and will combine with itself if need be. Oxygen is not actually O, it is O2 in nature. There is a triatomic form of this element, O3, which is called ozone – but that is another story.
Again, we know oxygen is much needed by living organisms. Well… by most living organisms – there are some microbes that can survive with little or no oxygen, but for the majority of the creatures we are familiar with, it is a must.
I have asked students why oxygen was so important to life. I usually get the answer “that we will die without it”. I respond by asking again – “but WHY do we need it? What does it DO?” And the response usually does not change – “we must have it or we will die”. There is no doubt that it is important. Being in an atmosphere with little or no oxygen sends our bodies into a “stress mode” gasping – but what DOES the element actually do for us?
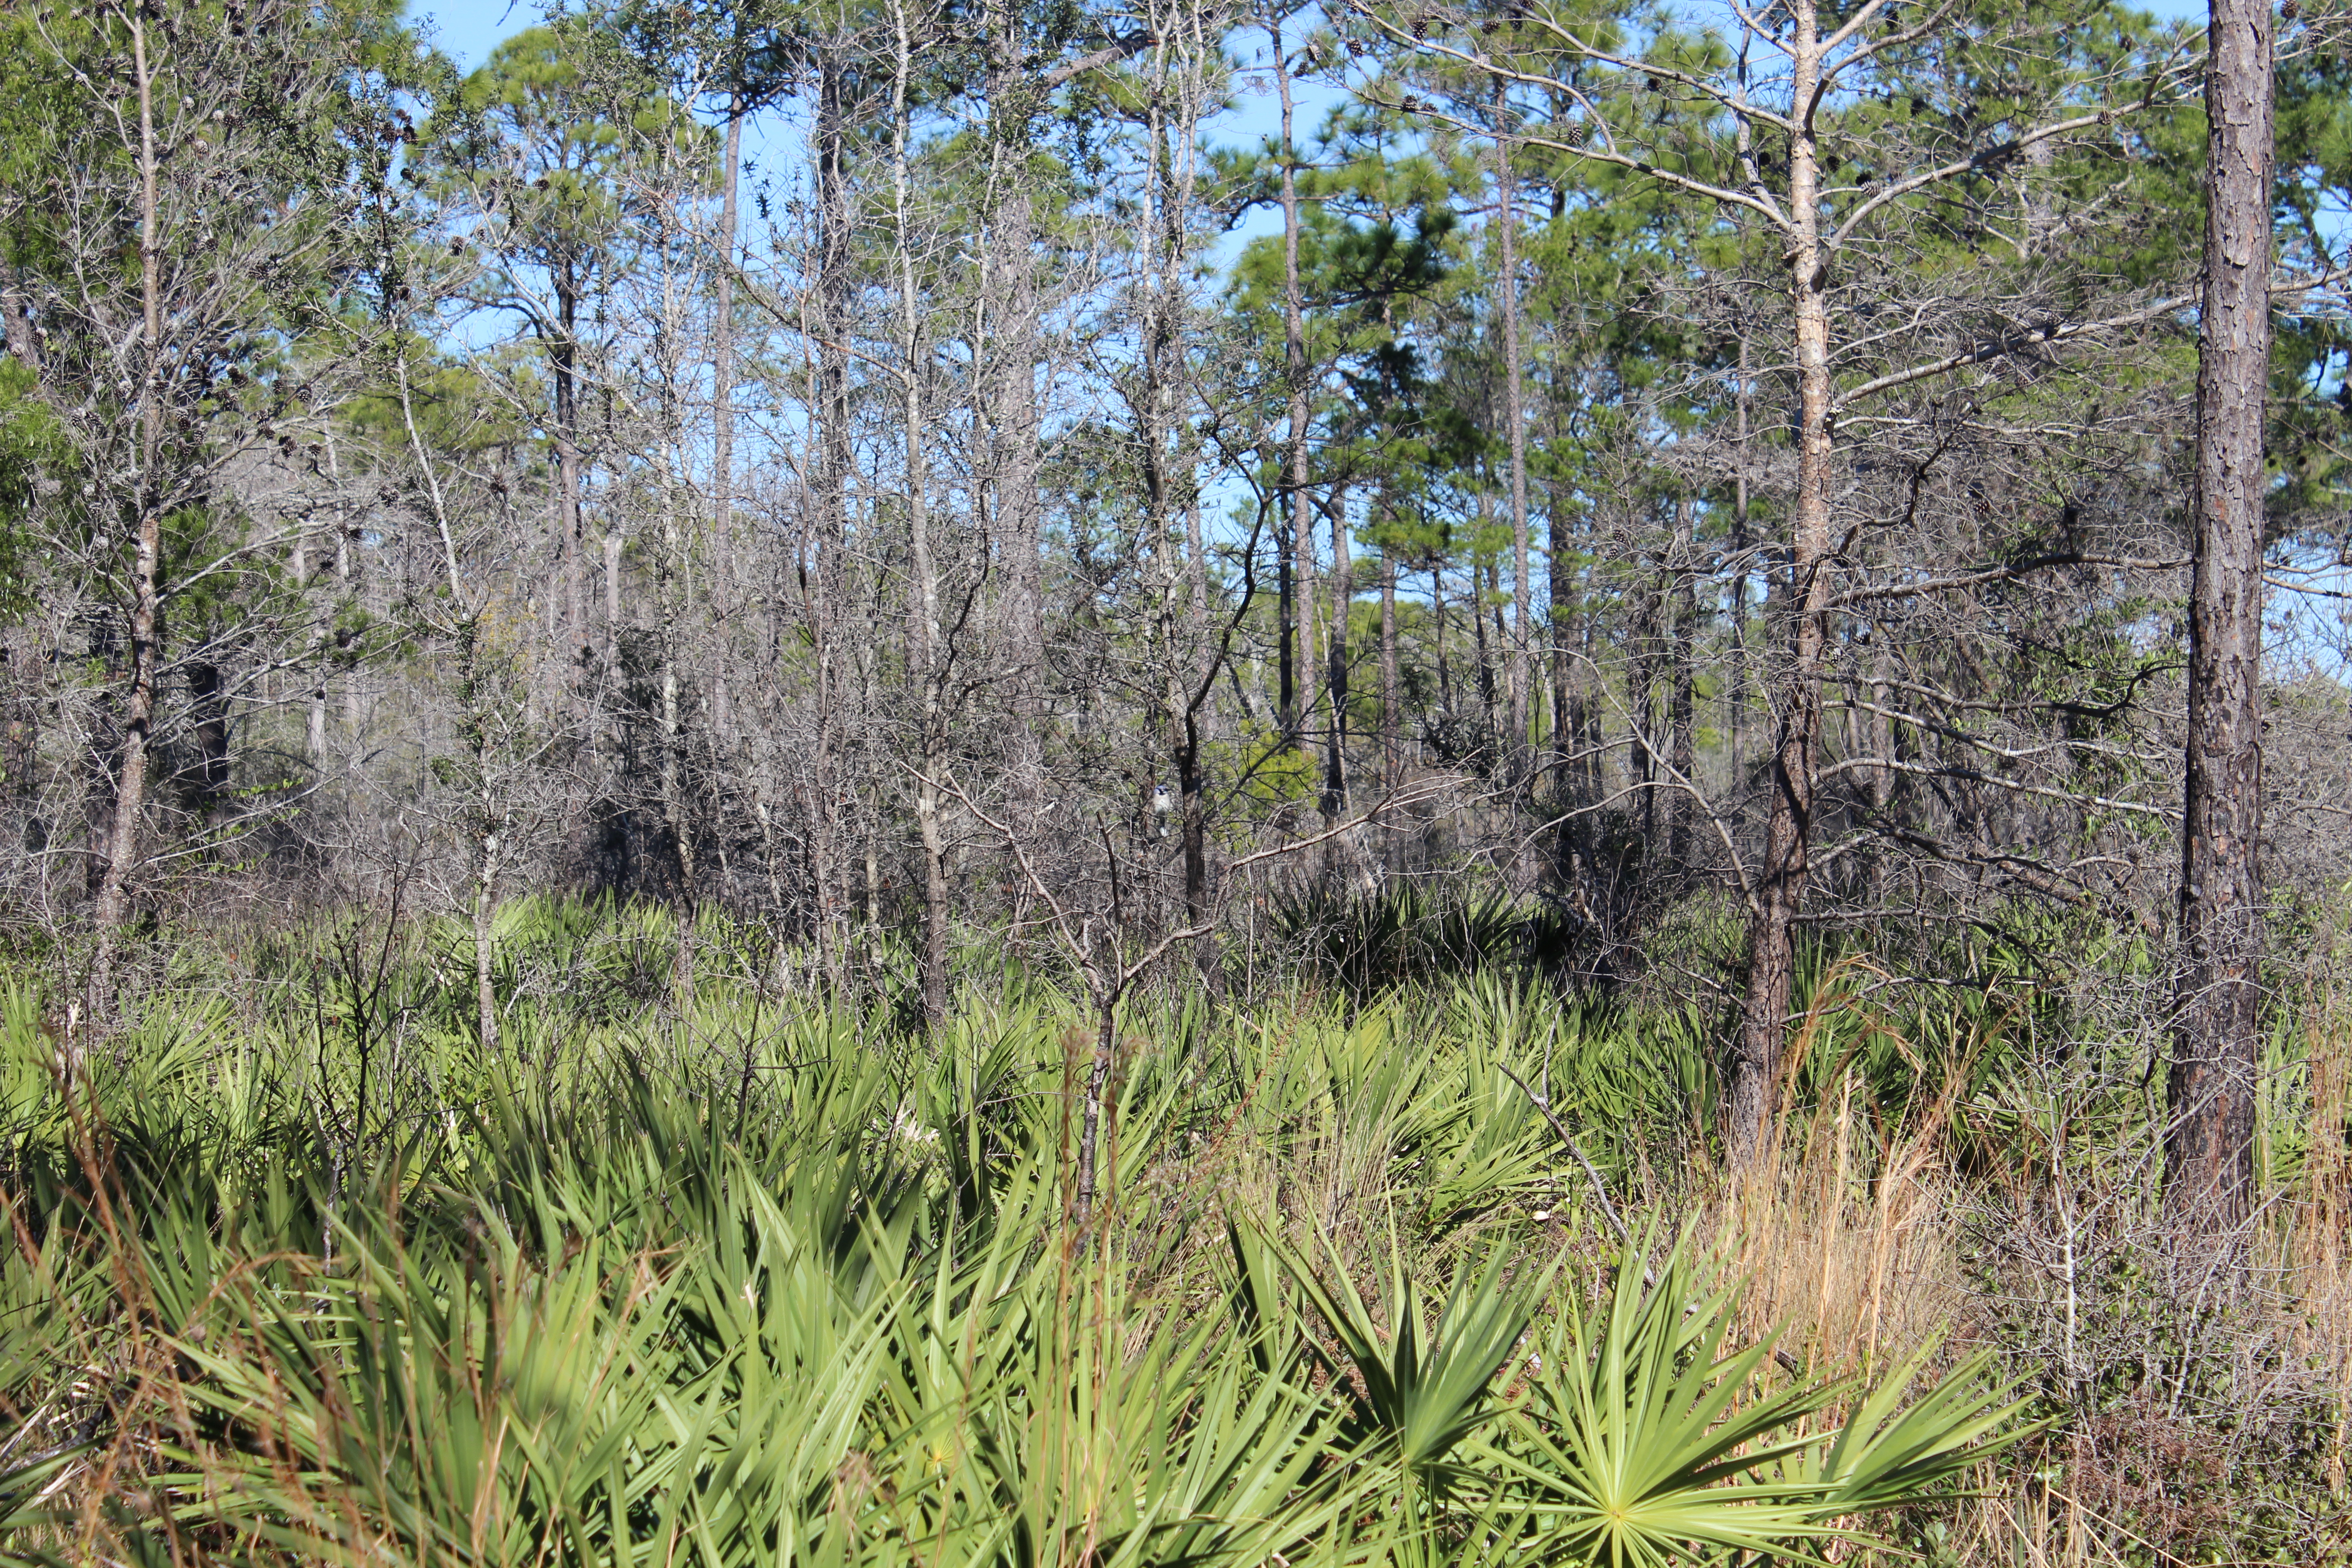
Life is abundant on this planet due to the presence of oxygen.
Photo: Rick O’Connor
Oxygen is needed to complete the reaction we call respiration. For most, the term respiration means “breathing” and this would be correct – but it is more than that. It is an oxygen demanding reaction we all need to remain alive. In this reaction the sugar molecule glucose (C6H12O6) is oxidized to produce Adenosine triphosphate (ATP – C10H13N5O13P3). ATP is the “energy” molecule needed for cells to function – our gasoline. It fuels all metabolic reactions needed to sustain life. ATP cannot be consumed in food, it must be made in the cell and, as the reaction below shows, it requires sugar (which we get from food) and oxygen (which we inhale from the atmosphere) to work.
C6H12O6 + O2 –> CO2 + H2O + ATP
This reaction will produce 36 of the much-needed molecules of ATP with each cycle. It is known that in anaerobic respiration (the break down of glucose without oxygen) it will also produce ATP but not as much – only 2 molecules of it instead of 36. So, for most creatures’ aerobic respiration (with oxygen) is preferred and needed.
The primary source of oxygen on our planet is plants. This suggest that before plants existed there may have been little, or no, oxygen on in our atmosphere and scientists believe this was the case. When you look at the fossil records it suggests that prior to plants existence there was life (anaerobic life) but after plants the diversity and abundance of life exploded. Aerobic respiration seems to be the way to go.
As most know, plants produce oxygen in the process known as photosynthesis. This chemical reaction is used by the plants to produce the other needed respiration molecule glucose. Plants produce their own glucose and so are called producers, while other creatures, including animals, are consumers – consuming glucose in their food. The reaction for photosynthesis is –
CO2 + H2O –> C6H12O6 + O2
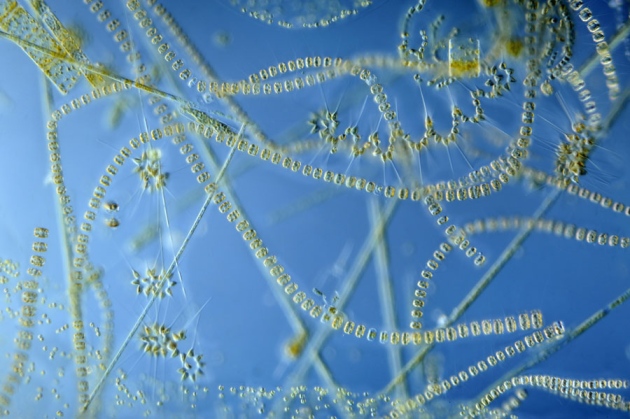
The excess oxygen produced in this reaction is released into the atmosphere by the plants. It makes up 20% of our atmosphere and this allows life as we know it to exist. Note… almost 50% of the oxygen in our atmosphere comes from single celled algae called phytoplankton that grow and exist at the surface of our oceans.
Single celled algae are the “grasses of the sea” and provide the base of most marine food chains.
Photo: University of New Hampshire
But what about aquatic creatures who do not breath the atmosphere you and I do? How do they obtain this much needed oxygen drifting in our atmosphere?
The answer is in dissolved oxygen. Oxygen, being a gas, is released into the atmosphere. Even the oxygen produced by submerged aquatic plants, like seagrasses and algae, release their oxygen as a bubble of gas which floats to the surface, pops, and is released to the atmosphere. To get that back to the creatures in the water who need it as much as we do, you have to “dissolve” it into the water.
To do this you must break the hydrogen bonds that connect water molecules to each other. Water is a polar molecule, and each molecule connects to each other like magnets using hydrogen bonds. These hydrogen bonds are weak and easy to break, but you must MOVE the water in order to do this.
The water molecule.
Image: Florida Atlantic University
Water movement, such as waves, currents, and tides, will do it. The more movement you have the more oxygen will dissolve into it. Waterways such as the rapids of mountain rivers and waterfalls will have high concentrations of dissolved oxygen – usually over 10 µg/L. For some creatures this could be too high – like an oxygen rush to the head – but for others, like brook trout, it is perfect. They do not do well in water with dissolved oxygen (DO) concentrations less than 10.
For most waterways the DO concentrations run between 4 and 10 µg/L. Most systems run between 5-7. Waterways with a DO concentration less that 4 µg/L are termed hypoxic – oxygen deprived – and many creatures cannot live at these levels. They are literally gasping for air. I have seen fish at the surface of our local waterways when the DOs are low gasping for much needed oxygen through the atmosphere. It is also the primary reason the great crab jubilees of Mobile Bay occurs. Low levels of DO in the bay will trigger many creatures to leave seeking higher DO in the open Gulf. But for some benthic creatures – like stingray, flounder, and blue crabs – they will literally run onto the beach gasping for oxygen. The fish known as menhaden are particularly sensitive to low DOs and are one of the first to die when concentrations begin to dip below 4. When you see the surface of a waterway littered with dead menhaden it typically means there is a DO problem.
Slick calm water diffuses/dissolves less oxygen.
Photo: Molly O’Connor
That said, some creatures, like catfish, can tolerate this and do not become stressed until the concentrations get below 2 µg/L. If they ever reach 0 µg/L (and I have seen this twice – once in Mobile Bay and once in Bayou Texar) the waterway is termed anoxic – NO oxygen. This is obviously not good. Some are familiar with the “Louisiana Dead Zone”. An area of the open Gulf of Mexico south of the Mississippi River where DO levels decline in the summer to levels where most benthic species, particularly shrimp, are hard to find. It seems “dead” – void of marine life. This is also a DO issue.
How – or why – do dissolved oxygen levels get that low?
There are three basic reasons to this answer.
The surface is still, and little atmosphere oxygen is being “dissolved”. We have all seen calm days when the water is as slick as glass. On days like these, less oxygen is being dissolved into the system and the DO concentrations begin to drop. But how low will they go?
The water is warm. Higher water temperatures hold less oxygen. As the water warms the oxygen “evaporates” and the DO concentrations begin to decline. If it is a warm calm day (like those during a high-pressure system in summer) you have both working against you and the DO may drop too low. Most fish kills due to DO concentrations occur during the hot calm summer days.
What is called biological oxygen demand. All creatures within the system demand oxygen and remove it from the water column. However, in most cases, atmospheric dissolved oxygen will replace for a net loss of zero (or close to it). But when creatures die and sink to the bottom the microbes that decompose their bodies also demand oxygen. If there is a lot of dead organic material on the bottom of the waterway that needs to be broken down, the oxygen demanding microbes can significantly decrease the DO concentrations. This dead organic material is not restricted to fish and crabs that die but would include plant material like leaves and grass clippings from our yards, organic waste like feces, food waste, the carcasses of cleaned fish, any organic material that can be broken down can trigger this process.
Now picture the perfect storm. A hot summer day with no wind and high humidity over a body of water that has heavy organic loads of leaves, dead fish carcasses, and waste. BAM – hypoxia… – low DO… fish kill… which would trigger more oxygen demanding decomposition and – more dead fish – a vicious cycle.
You have probably gathered that low dissolved oxygen concentrations can occur naturally – and this is true – but they can also be enhanced by our activity. Allowing organic material from our yards (grass clippings, leaves, and pet waste) to enter a body of water will certainly enhance the chance of a hypoxic condition and a possible fish kill – which would in turn fuel lower DO and poor water quality state for that body of water. The release of human waste (food and garbage, sewage, etc.) will also trigger this. And throwing fish carcasses after cleaning at the boat dock will too.
But there is another process that more people are becoming familiar with that has been a problem for some time. The process of eutrophication. Eutrophic indicates the waterway is nutrient rich. These nutrients are needed by the plants in order to grow – and they do. Particularly the single celled algae known as phytoplankton. These phytoplankton begin to grow in huge numbers. So, abundant that they can color the water – make it darker. As mentioned above, they produce a lot of oxygen, but at night they consume it, and with SO much phytoplankton in the water they can consume a large amount of DO. The DOs begin to drop as the evening wears on and before sunrise may reach concentrations low enough to trigger a fish kill. These phytoplankton will eventually die and with the large mass of organic matter sinking to the bottom, the oxygen demand to decompose them can trigger larger fish kills. These fish kills in turn demand more oxygen to decompose and the process of eutrophication can create a waterway with very poor water quality and a habitat unsuitable for many aquatic creatures. It is not good. This is the process that causes the Louisiana Dead Zone each summer. The nutrients are coming from the Mississippi River.
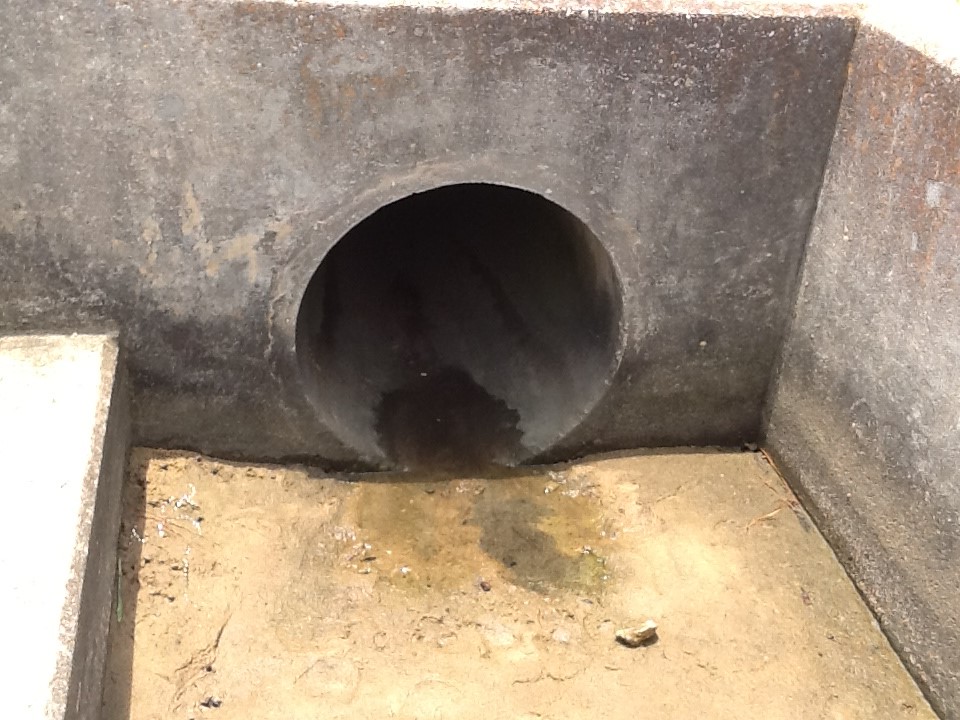
One of 39 stormwater drains into Bayou Texar that can introduce a variety of organic compounds that can fuel eutrophication.
Photo: Rick O’Connor
So, is there anything we can do to help reduce this from happening?
Well, remember some hypoxic conditions are natural and they will happen. But there are things we can do to not enhance them or trigger them in waterways that would otherwise not have them.
When raking your yard, place all leaves in paper bags for pick up. This keeps the leaves from washing into the street during rain events (and we are getting plenty of those) and eventually into a local waterway. The problem with using plastic bags is that the local utility who collects them can no longer compose this into mulch. You might consider using your leaves and grass clippings for landscaping yourself.
Watch fertilization of your yard. Many over fertilize their yards and the unused fertilizer is washed into the street and eventually into the local waterway. These fertilizers will do to phytoplankton what they were designed to do with your lawn – make them grow. Of course, not fertilizing your yard would be best, but if you must place only the amount, and type, your lawn needs. Your extension office can help you determine what that would be.
Pick up pet waste when you take your pets out to go to the bathroom.
If you have a septic tank – maintain it. You can also look into converting to a sewer system.
If you are on sewer – watch what you pour down the drain. Many products – such as fats, oils, and grease – can create clogs that cause sanitary sewage overflows when we have heavy rains (and we will have heavy rains). Our local utility in the Pensacola area offers the FOG program (Fats, Oils, and Grease). In this program you can pick up a clean 1-gallon plastic container to pour your fats, oils, and grease into. Once full, you bring it back and switch for a clean empty. To find where these containers bins are located near you visit the ECUA website – https://ecua.fl.gov/live-green/fats-oils-grease.
1-gallon container provided free to dispose of your oil and grease.
Photo: Rick O’Connor
Dissolved oxygen concentrations naturally go up and down, and sometimes low enough to trigger a natural fish kill but following some of the suggestions above can help reduce how frequently these happen and can help to make our estuary healthier.