by Andrea Albertin | Oct 2, 2020
If your private well was damaged or flooded due to hurricane or other heavy storm activity, your well water may not be safe to drink. Well water should not be used for drinking, cooking purposes, making ice, brushing teeth or bathing until it is tested by a certified laboratory for total coliform bacteria and E. coli.
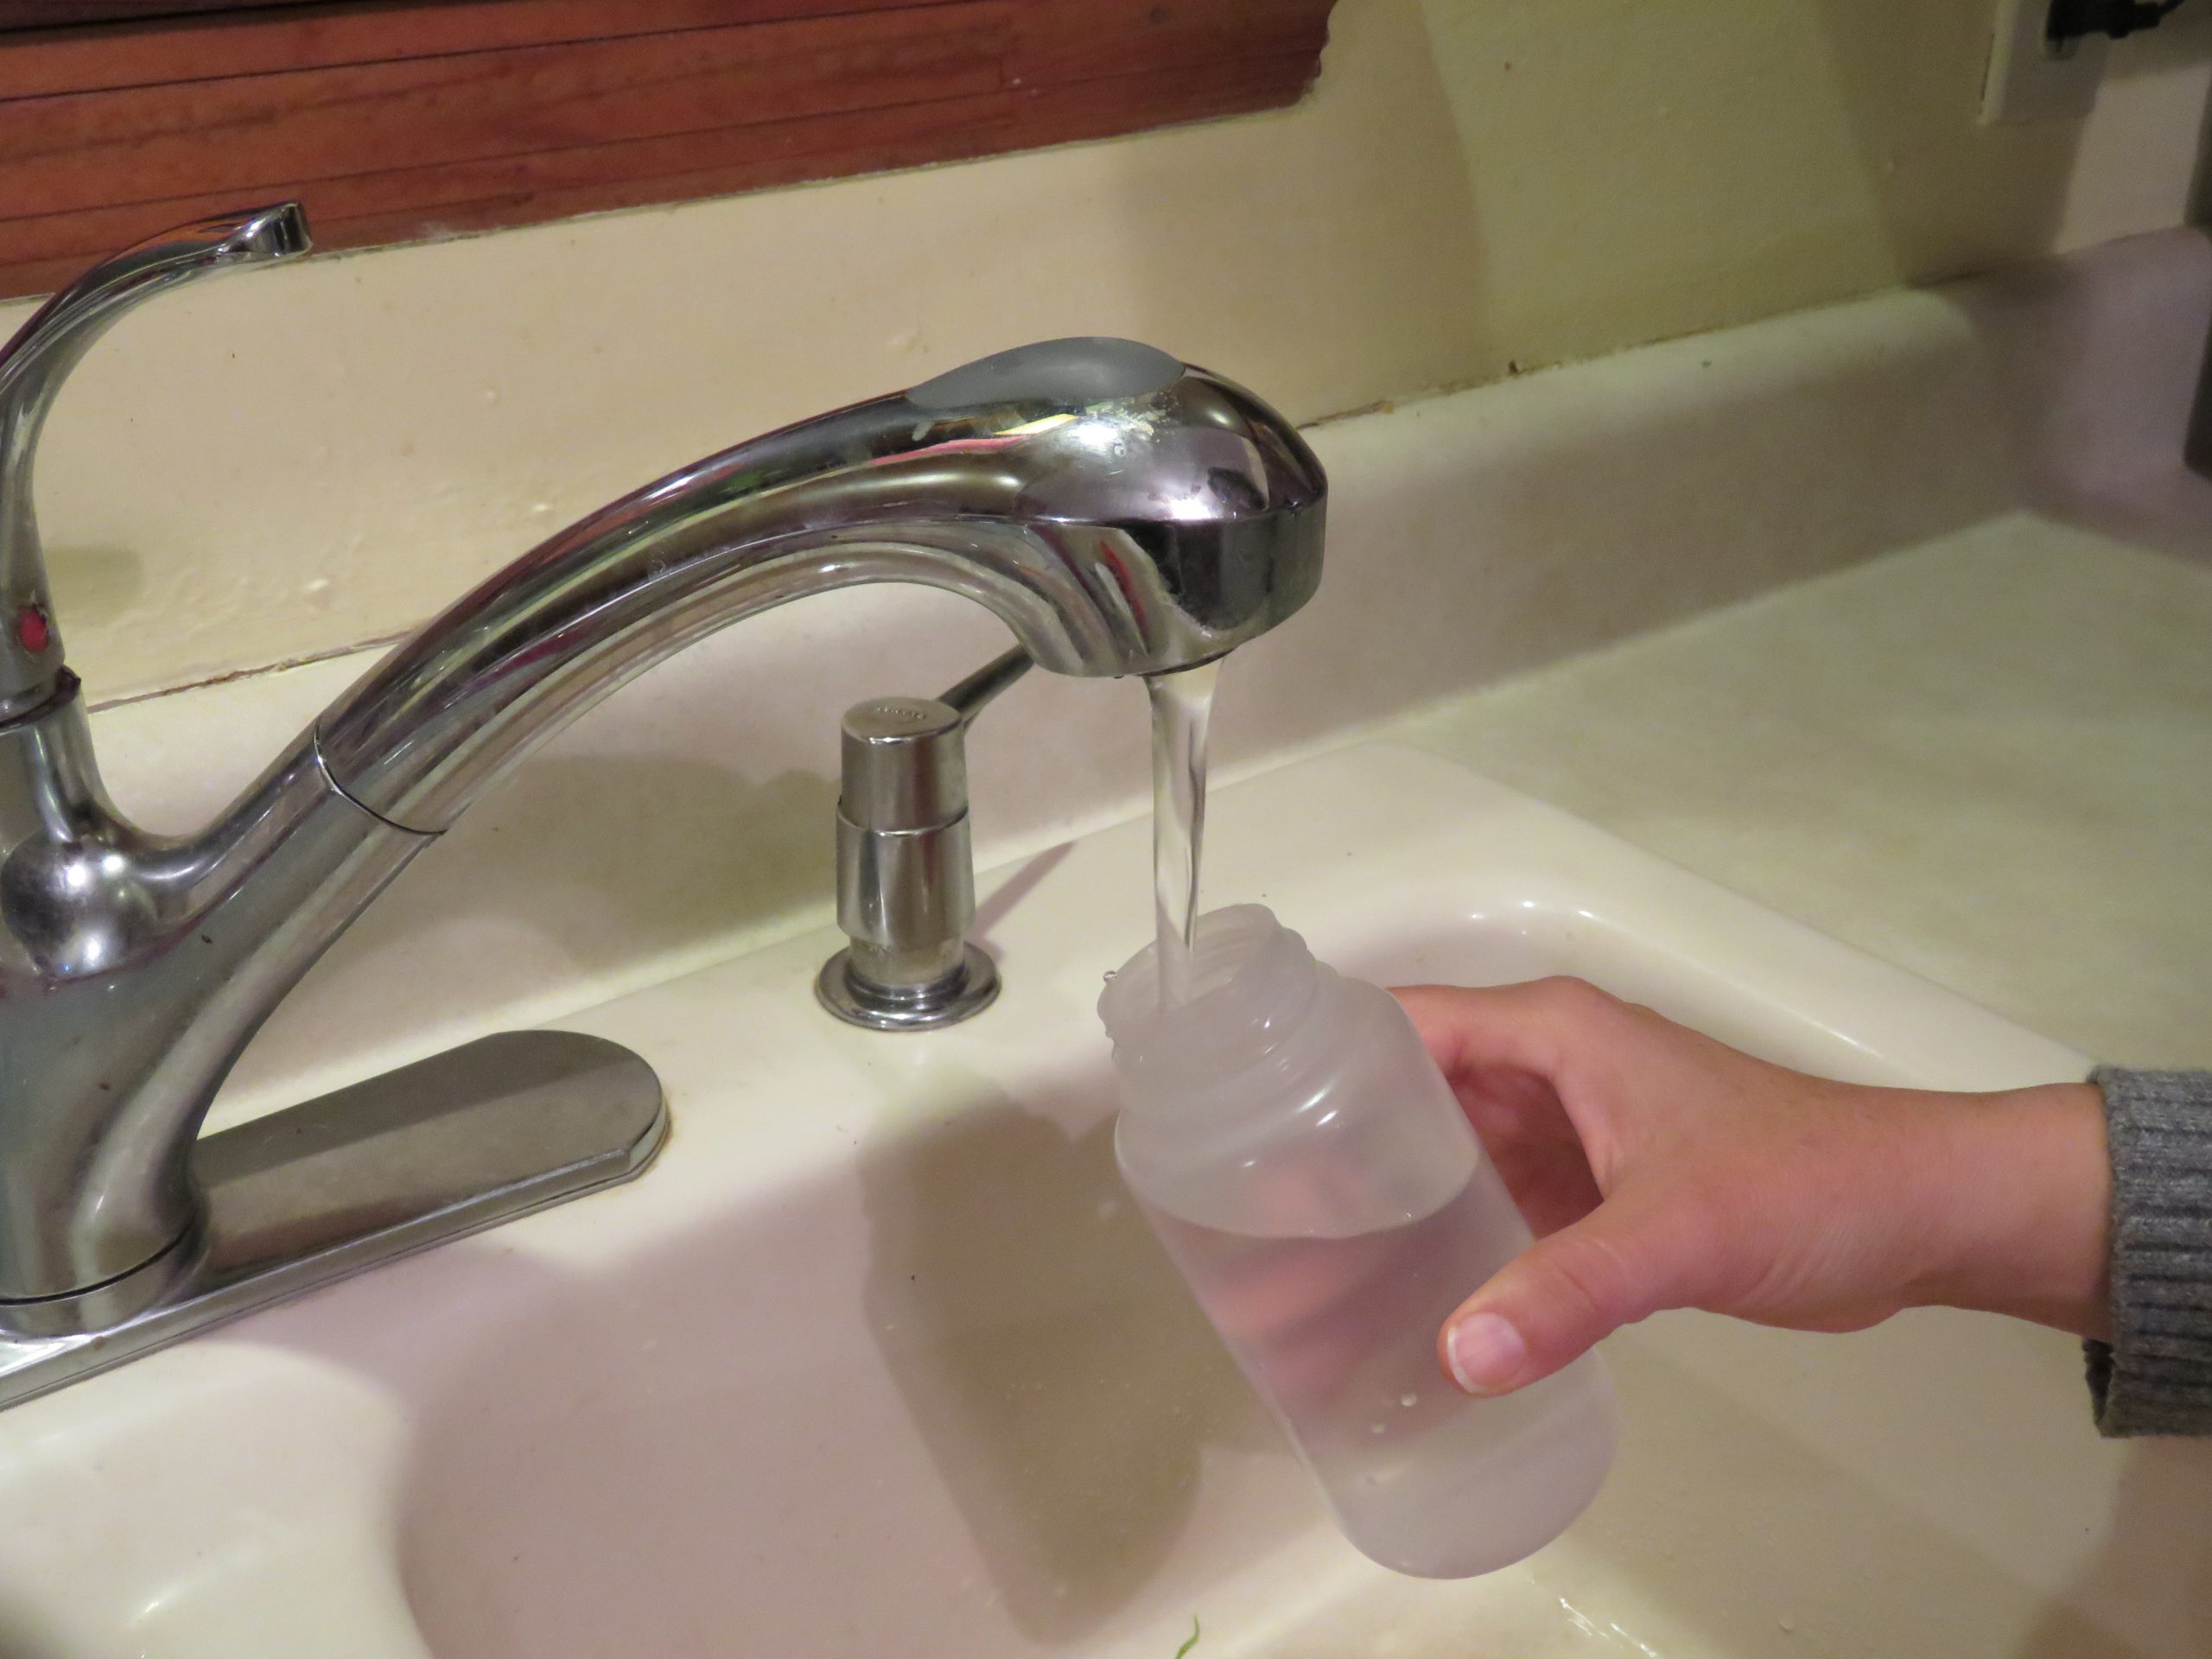
Residents should use bottled, boiled or treated water until their well water has been tested and deemed safe.
- Boiling: To make water safe for drinking, cooking or washing, bring it to a rolling boil for at least one minute to kill organisms and then allow it to cool.
- Disinfecting with bleach: If boiling isn’t possible, add 1/8 of a teaspoon or about 8 drops of fresh unscented household bleach (4 to 6% active ingredient) per gallon of water. Stir well and let stand for 30 minutes. If the water is cloudy after 30 minutes, repeat the procedure once.
- Keep treated or boiled water in a closed container to prevent contamination
Use bottled water for mixing infant formula.
Where can you have your well water tested?

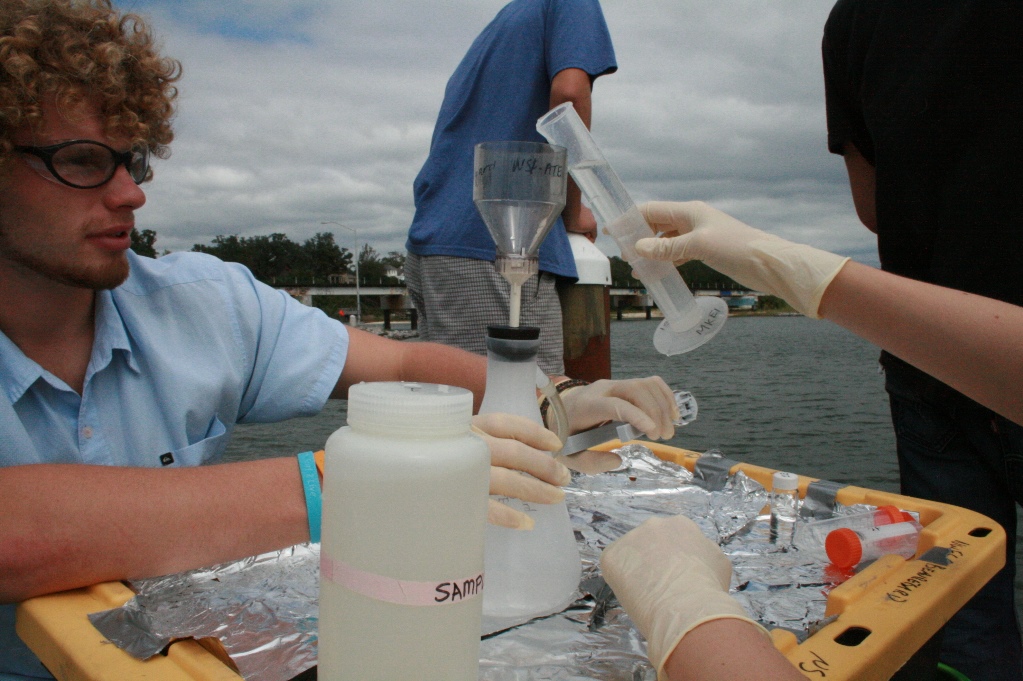
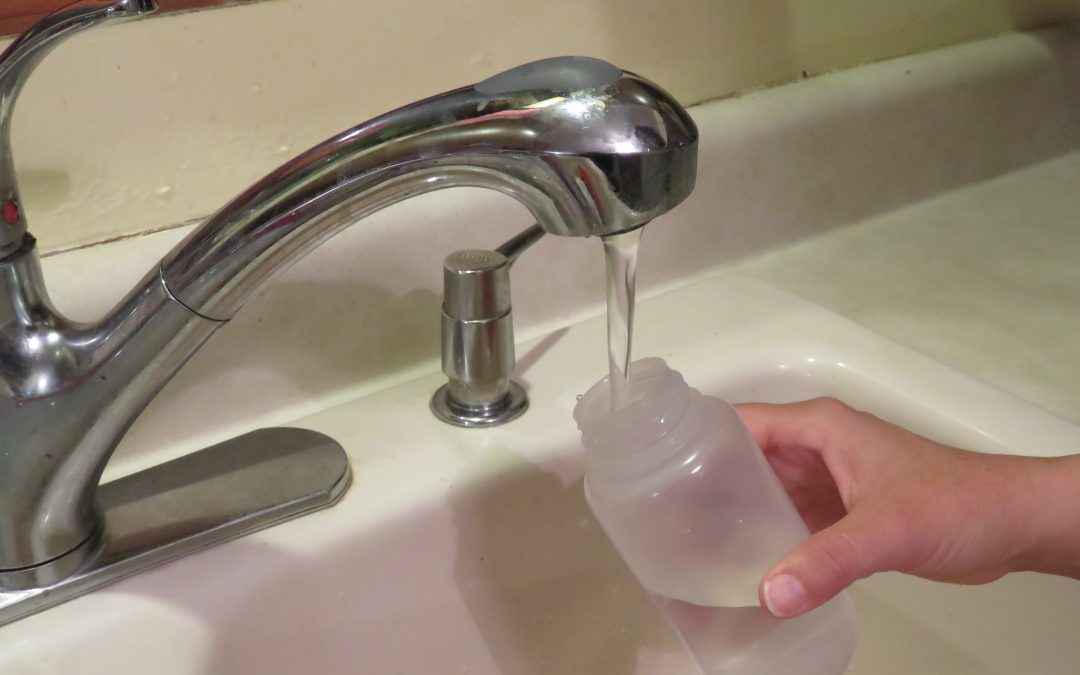
Contact your county health department for information on how to have your well water tested. Image: F. Alvarado Arce
Most county health departments accept water samples for testing. Contact your local department for information about what to have your water tested for (they may recommend more than just bacteria), and how to collect and submit the sample.
Contact information for Florida Health Departments can be found here: County Health Departments – Location Finder
You can also submit samples to a certified commercial lab near you. Contact information for commercial laboratories that are certified by the Florida Department of Health are found here: Laboratories certified by FDOH
This site includes county health department labs, commercial labs as well as university labs. You can search by county.
What should you do if your well water sample tests positive for bacteria?
The Florida Department of Health recommends well disinfection if water samples test positive for total coliform bacteria or for both total coliform and E. coli, a type of fecal coliform bacteria.
You can hire a local licensed well operator to disinfect your well, or if you feel comfortable, you can shock chlorinate the well yourself.
You can find information on how to shock chlorinate your well at:
After well disinfection, you need to have your well water re-tested to make sure it is safe to use. If it tests positive again for total coliform bacteria or both total coliform and E. coli call a licensed well operator to have the well inspected to get to the root of the problem.
Well pump and electrical system care
If the pump and/or electrical system have been underwater and are not designed to be used underwater, do not turn on the pump. There is a potential for electrical shock or damage to the well or pump. Stay away from the well pump while flooded to avoid electric shock.
Once the floodwaters have receded and the pump and electrical system have dried, a qualified electrician, well operator/driller or pump installer should check the wiring system and other well components.
Remember: You should have your well water tested at any time when:
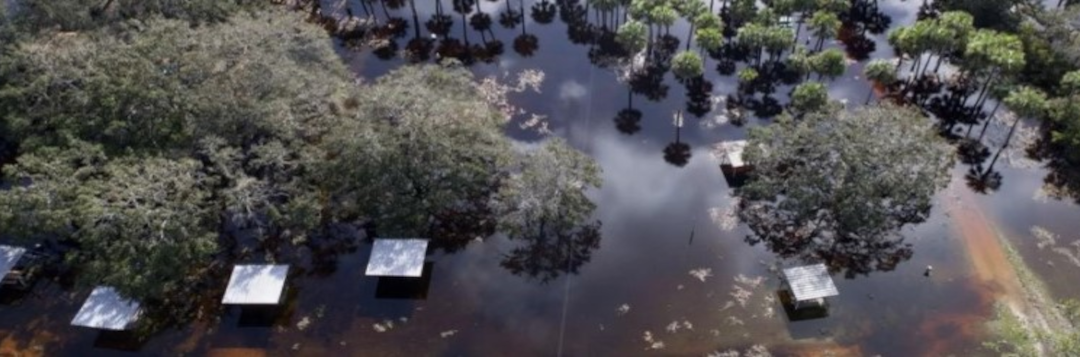
- A flood occurred and your well was affected
- The color, taste or odor of your well water changes or if you suspect that someone became sick after drinking your well water.
- A new well is drilled or if you have had maintenance done on your existing well
- There has been any type of chemical spill (pesticides, fuel, etc.) into or near your well
The Florida Department of Health maintains an excellent website with many resources for private well users: FDOH Private Well Testing and other Reosurces which includes information on potential contaminants and how to maintain your well to ensure the quality of your well water.
by Rick O'Connor | Jun 4, 2020
Recently there was a report of high fecal bacteria in a portion of Perdido Bay. I received a few concerned emails about the possible source. Follow up sampling from several agencies in both Florida and Alabama confirmed the bacteria was there, the levels were below both federal and state guidelines (so no advisory issued), and a small algal bloom was also found. It was thought the cause was excessive nutrients and lack of rain.
We hear this a lot.
Excessive nutrients and poor water quality.
What is the connection?
Many people understand the connection, others understand some of it, others still do not understand it. UF IFAS has a program called LAKEWATCH where citizen science volunteers monitor nutrients in some of lakes and estuaries within the state. Here in Escambia County, we have six such volunteers. Some of the six bodies of water have been monitored for many years, others are just starting now, but the data we have shows some interesting issues – many have problems with nitrogen. Let’s look closer.
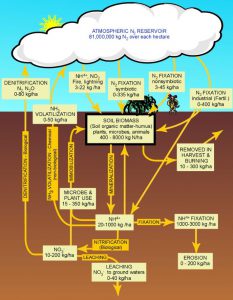
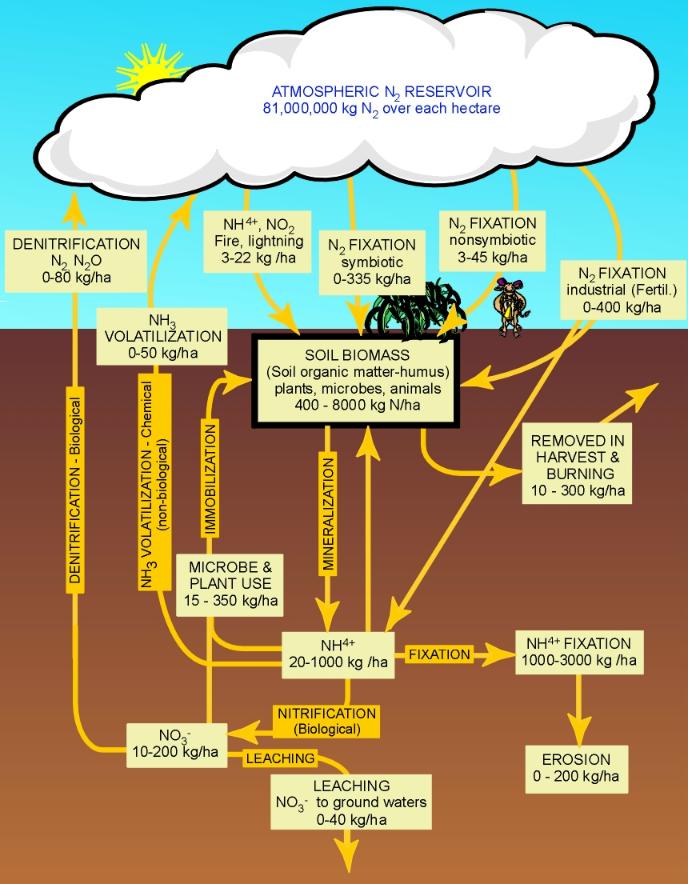
The nitrogen cycle.
Image: University of Florida IFAS
We have all heard of nitrogen. Many will remember from school that it makes up 78% of the air we breathe. In the atmosphere nitrogen is present as a gas (N2). It is very common element found in living creatures – as a matter of fact, we need it. Nitrogen is used to build amnio acids – which builds proteins – which is needed to produce tissue, bone, blood, and more. it is one of the elements found in our DNA and can be used to produce energy. However, it cannot do these in the atmospheric gas form (N2) – it needs to be “converted” or “fixed”.
One method of conversion is the weather. Nitrogen gas are two molecules of nitrogen held together by strong chemical bonds (N2). However, lightning provides enough energy to separate N2 and oxidize it with oxygen in the atmosphere forming nitrogen dioxide (NO2). This NO2 combines with water in the atmosphere to form nitric acid (HNO3). Which can form nitrates (NO3) with the release of the hydrogen and nitrate (NO3) is usable by plants as a fertilizer… a needed nutrient.
But much of the usable nitrates do not come from the atmospheric “fixing” of nitrogen via lightning. It comes from biological “fixing” from microbes. Atmospheric nitrogen can be “fixed” into ammonia (NH3) by bacteria. Another group of bacteria can convert ammonia into nitrite (NO2), and a third group can convert it from nitrite to the usable form we know as nitrate (NO3). Ammonia can also be found in the environment as a waste product of life. As we use nitrogen within bodies it can be converted into ammonia – which can be toxic to us. Our bodies remove this ammonia via urine, and many times we can smell this when we go to the restroom. Nitrogen fixing bacteria can convert this ammonia to nitrites as well and complete the nitrogen cycle.
Once nitrogen has been fixed to the usable nitrate it can be taken up by plants and used within. Animals obtain their needed nitrogen by eating the plants or eating the animals that ate the plants. In both cases, nitrogen is used for protein synthesis in our bodies and unused nitrogen is released into the environment to continue the cycle.
So, what is the connection to water quality?
You might think that excessive nitrogen (nutrients) in the water would be a good thing. Released ammonia, though toxic, could be “fixed” into nitrite and eventually nitrate and recycled back into life. And you would right. Excessive amounts of ammonia though, may not be converted quick enough and a toxic state could occur. We see this in aquaculture ponds and home aquaria a lot.
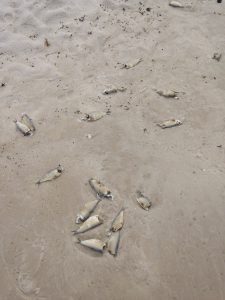
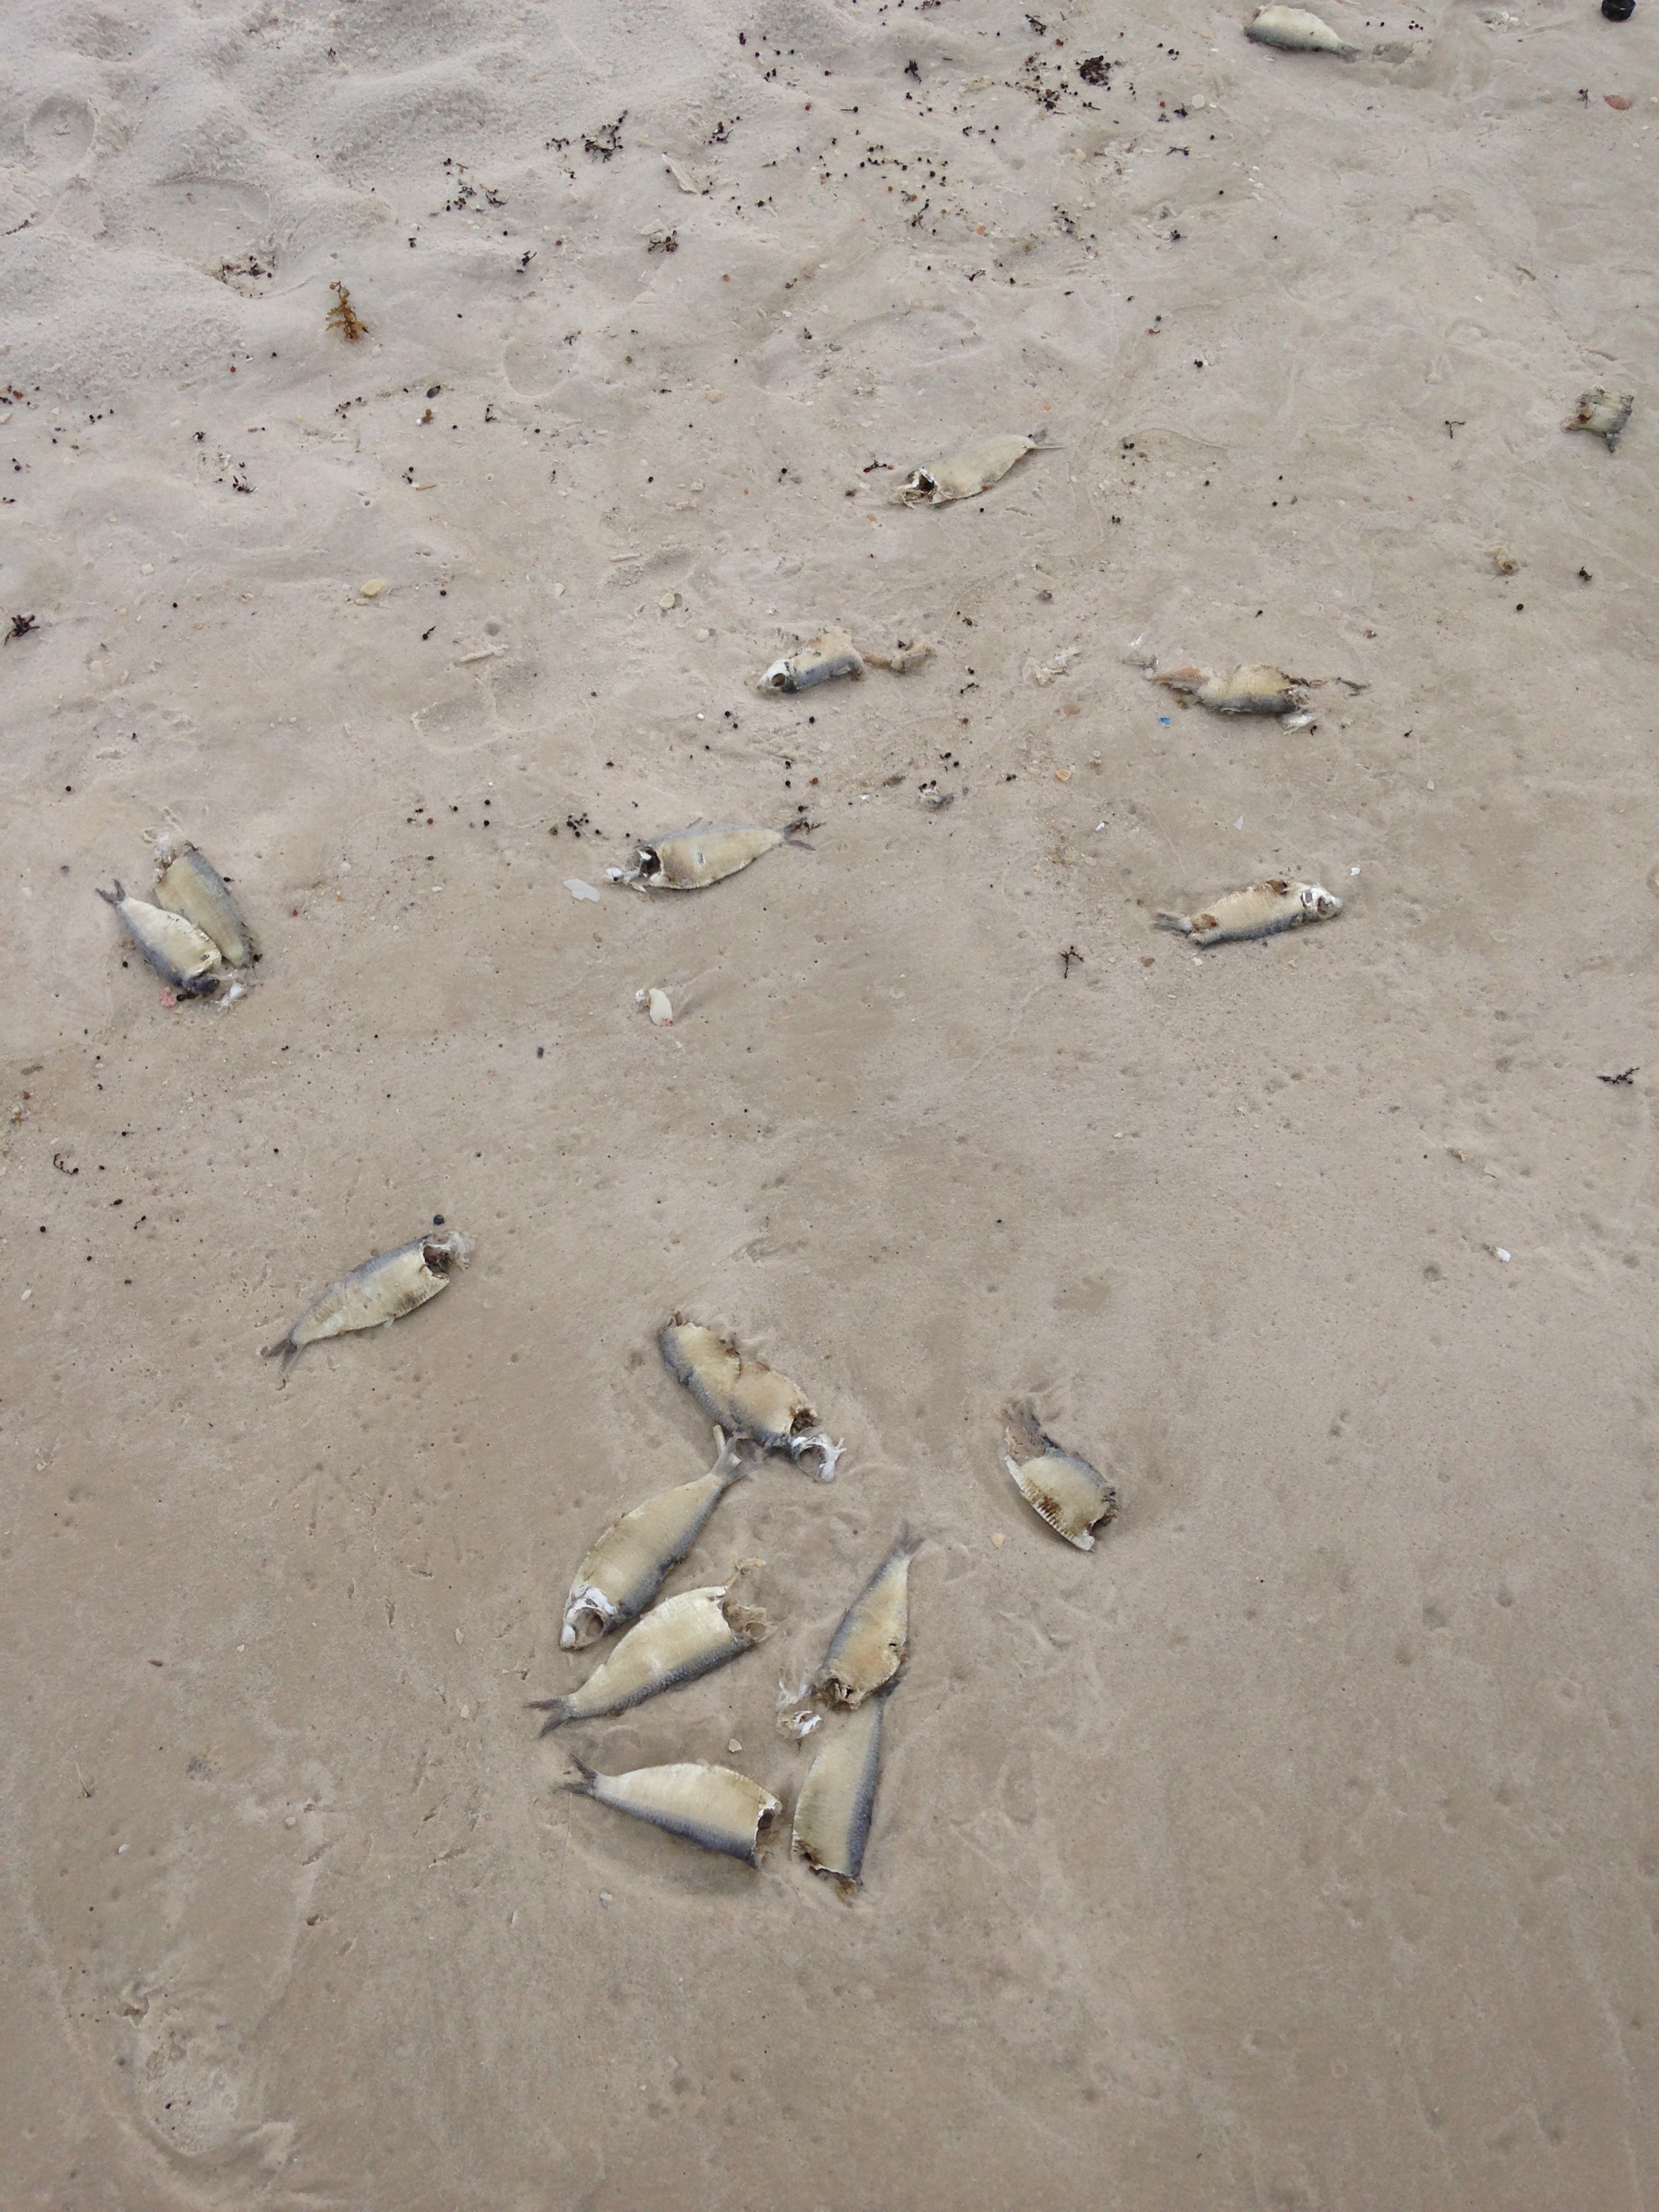
Members of the herring family are ones who are most often found during a fish kill triggered by hypoxia.
Photo: Madeline
But what about excessive nitrates? Shouldn’t that be good for the plants?
The concept makes sense, but what we see with increase plant growth in aquatic systems is problematic. Excessive plant growth can cause several problems.
1) Too much plant growth at the surface (algae, leafy vegetated material) can block sunlight to the other plants living on the bottom of the waterway. This can cause die off of those plants and a mucky bottom – but there is more.
2) Excessive plant growth at the surface and the middle of the water column can slow water flow. Reduced water flow can negatively impact feeding and reproductive methods for some members of the community, cause stagnation, and decrease dissolved oxygen – but there is more.
3) Plants produce oxygen, which is a good thing, so more plants are better right? Well, they do produce oxygen when the sun is up. When it sets, they begin to respirate just as the animals do. Here excessive plants can remove large amounts of dissolved oxygen (DO) in the water column at night. If the DO levels reach 3.0 µg/L many aquatic organisms begin to stress. We say the water is hypoxic (oxygen starving). When a system becomes hypoxic the animals will (a) come to the surface gasping, (b) some even approach the beach (the famous crab jubilee of Mobile Bay), (c) leave the water body for more open water, (d) die (a fish kill). This is in fact what we call a dead zone. Not always is everything dead, in many cases there is not much alive left – they have moved elsewhere so we say the bottom is “dead”. Here is something else… as the dead fish and (eventually) dead plants settle to the bottom they are decomposed by bacteria. This decomposition process requires dissolved oxygen – you guessed it – the DO drops even further enhancing the problem. In some cases, the DO may drop to 0.0 µg/L. We say the water is now anoxic (NO oxygen). I have only seen this twice. Once in Mobile Bay, and once in Bayou Texar. But I am sure it happens more often. The local environment can enhance (or even cause) this problem as well. Warm water holds less oxygen and much of the oxygen dissolved in water comes from the atmosphere – by way of wave action. So, on hot summer days when the wind is not moving much, and excessive nutrients (nitrogen) is entering the water, you have the perfect storm for a DO problem and possible fish kill.
4) Oh, and there is one other issue… some of the algae that produces these blooms release toxins into the water as a defense. These are known as harmful algal blooms (HABs). Red tide is one of the more famous ones, but blue-green blooms are becoming more familiar. So now you have a possible hypoxic situation with additional toxins in the water that can trigger large fish kills. Some of these HABs situations have killed marine mammals and sea turtles as well.
Though this process can occur naturally (and does) excessive nutrients certainly enhance them, and in some cases, initiate them. So, too much nitrogen in the system can be bad.
So, what does the LAKEWATCH data tell us about the Pensacola Bay system?
Well, first, we have not had volunteers on all bodies of water for the same amount of time. We currently have volunteers monitoring (1) northern Pensacola Bay, (2) Bayou Texar, (3) Bayou Chico, (4) Bayou Grande, (5) Big Lagoon, and (6) lower Perdido Bay. Pensacola Bay has JUST started, and Big Lagoon has not even started yet (COVID-19 issues) – so we only have data from the other four. Bayou Texar has the longest sample period at 13 years.
Lakewatch is a citizen science volunteer supported by the University of Florida IFAS
Second, this program does not sample for just nitrogen, but another key nutrient as well – phosphorus. When you look at a bag of fertilizer you will see a series of numbers looking like: 30-28-14. This would be nitrogen, phosphorus, and potassium. People adding fertilizer to their lawns should know which nutrient they need the most and can by a fertilizer with a numerical concentration that is best for their lawn. You can have your soil tested at the county extension office. But the point here is that there is more than nitrogen to look at and, as we have learned, more than one form of nitrogen out there. So, what we do at LAKEWATCH is monitor for total nitrogen (TN) and total phosphorus (TP).
Another parameter monitored is total chlorophyll a (TC). The idea is… if there are excessive amounts of nutrients in the water there will be excessive amounts of algae. You could collect a sample of water and count the number of algal cells in the water – but another way is to measure the amount of chlorophyll in the water as a proxy for the amount of algae. Chlorophyll, of course, is the compound within plants that allows photosynthesis to happen. There is a chemical process used to release the chlorophyll within the cells and you can then use an instrument to measure the amount of chlorophyll in the water.
LAKEWATCH volunteers also monitor water clarity. It is true that clarity can be impacted by sediments in the water as much as an algal bloom, but anything that contributes to less sunlight reaching the bottom can be problematic for some bodies of water. This is done by lowering a disk into the water and measuring the depth at which it “disappears”.
For those not familiar with the term salinity, it is the measure of the amount of dissolved solids in the water – what most people say, “how salty is it?”. For reference, the Gulf of Mexico is usually around
35‰, most open estuaries are between 20-30‰.
Below is a table of the LAKEWATCH data we have as of the spring 2020.
| Year of Sampling |
Body of Water |
Total Phosphorus (µg/L) |
Total Nitrogen (µg/L) |
Total Chlorophyll (µg/L) |
Water Clarity (feet) |
Salinity (‰) |
| 2014 – 2018 |
Bayou Chico |
20-30 |
350 – 600 |
10 – 30 |
2.6 – 4.2 |
7.0 – 8.2 |
| 2012 – 2017 |
Bayou Grande |
16 – 19 |
320 – 340 |
5 -6 |
4.0 – 5.2 |
17 – 18 |
| 2007 – 2018 |
Bayou Texar |
17 – 18 |
600 – 800 |
6 – 8 |
3.4 – 3.8 |
8 – 10 |
| 2014 – 2018 |
Lower Perdido |
15 -16 |
350 – 360 |
5 -6 |
5.3 – 6.1 |
13 -14 |
| STATE AVG. |
(includes lakes) |
25.0 |
309 |
3.7 |
|
|
There are a couple of things that stand out right away
(keep in mind some water bodies have not been monitored very long by LAKEWATCH).
1) Phosphorus is not as big a problem in our part of the state. In the peninsula part of Florida there is a lot of phosphorus in the sediments and much of it is mined. You can see this in the average value for the state. Actually, because of this, many of the central and south Florida lakes are naturally high in phosphorus and this is not considered “polluted”. All that said, there are higher levels of phosphorus in Bayou Chico. Which is interesting. More on solutions in a moment.
2) We have a lot of nitrogen in our waters. Bayou Texar in particular is much higher than the state average. More on this in a moment.
3) We have a little more chlorophyll than the state average, but not alarming.
4) Bayou Grande and lower Perdido are clearer than Bayou’s Texar and Chico.
5) All these bodies of water are less than 20‰. More on this as well.
So, comments…
1) We already discussed the phosphorus issue (or non-issue), but what about Bayou Chico? Phosphorus is NOT introduced to the system from the atmosphere as nitrogen is – rather, it comes from the sediments. High levels of TP would suggest high levels of sediments in the water column (the water clarity data supports this) – which suggest high levels of run-off. The watershed for Bayou Chico is highly urbanized and run-off has historically been a problem.
2) Nitrogen can come from many sources, but when numbers get high – many will hypothesize they are most likely from lawn run-off (fertilizers), or sewage (septic leakage, sanitary sewage overflows, animal waste). There are certainly other possibilities, but this is where most resource managers and agencies begin.
3) Elevated chlorophyll indicates elevated primary production. This is not unusual for an estuary. They are known for their high productivity. Bayou Chico seems have more algae than the others. Most probably due to the increase levels of nutrients entering the watershed.
4) Bayou Grande and lower Perdido Bay have better water clarity than Bayou’s Chico and Texar. Though all four bodies of water have significant coastal and watershed development, Bayou’s Chico and Texar and completely developed as well as their “feeder creeks”. Again, indication of a run-off problem.
5) All four bodies of water have several sources of freshwater input as well as stormwater run-off that has contributed to the lower salinities found here. It is possible that the salinities here were less than 20‰ prior to heavy development.
Possible Solutions….
There is a common theme with each of these – stormwater run-off. Rain that historically fell on the land and percolated into the ground water, now flows off impervious surfaces (streets, driveways, parking lots, even buildings) into drainage pipes and discharges into the waterways. This stormwater carries with it much more than just fertilizers and animal waste, it carries pesticides, oil, grease, solid waste, leaf litter, and much more.
How do you reduce stormwater?
Well, there is not much you can do with impervious surfaces now, but the community should consider alternative materials and plans for future development – what we call “Green Infrastructure”. Green roofs, pervious streets and parking lots, there are a lot of methods that have been developed to help reduce this problem.
Another consideration is Florida Friendly Landscaping. This is landscaping with native plants that require little (or no) water and fertilizer. It also includes plants that can slow run-off and capture nutrients before they reach the waterways and methods of trapping run-off onto your property.
If you happen to live along a waterway, you might consider landscaping your property by restoring some of the natural vegetation along the shoreline – what we call a living shoreline. Studies have shown that these coastal plants can remove a significant amount of nitrogen from the run-off of your property as well as reduce coastal erosion and enhance fisheries by providing habitat.
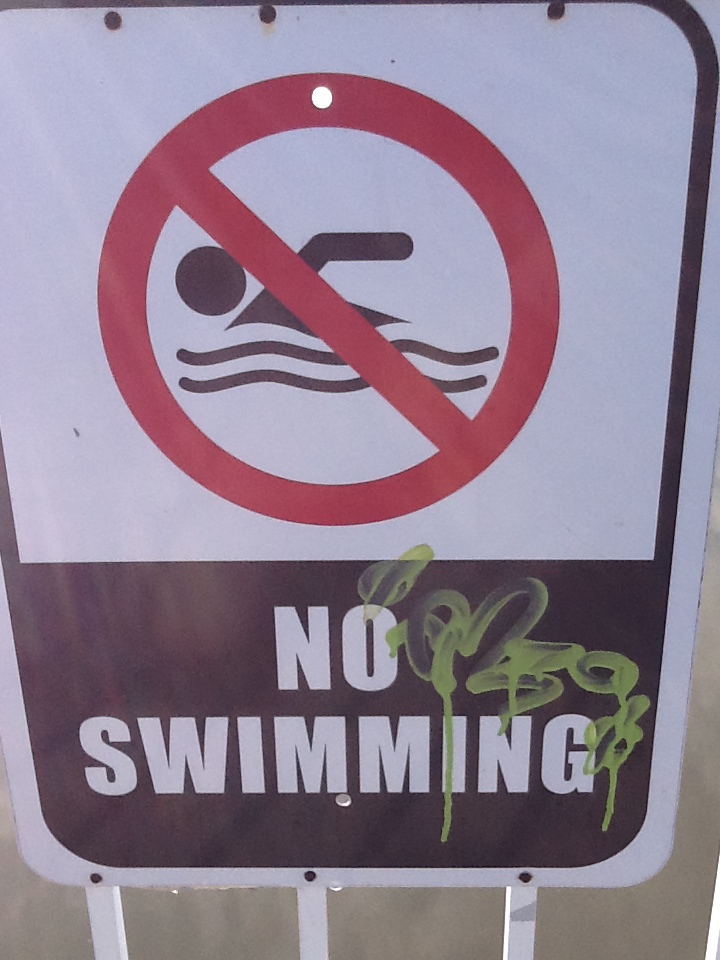
Closed due to bacteria.
Photo: Rick O’Connor
What about sewage issues?
Unfortunately, most septic systems were not designed to remove nitrogen – so leaks occur and will continue. The only options you have there are (a) maintain your septic by pumping once every five years, (b) consider taping into a nearby sewage line.
Sewers systems are not without their problems. Sanitary sewage overflows do occur and can increase nitrogen in waterways. These are usually caused by cracks in old lines (which need to be replaced), are because we flush things down drains that eventually “clog the arties” and cause overflows. Things such as “flushable wipes”, which are flushable – they go down the drains – but they do not breakdown as toilet paper does and clog lines. Cooking grease and oil, and even milk have been known to clog systems.
Our LAKEWATCH volunteers will continue to sample three stations in each of their bodies of water. We are looking for a volunteer to monitor Escambia Bay. If interested contact me.
If you are interested learning more about green infrastructure, Florida Friendly Landscaping, or living shorelines lines contact your county extension office (850-475-5230 for Escambia County). If interested in issues concerning sanitary sewage overflows or septic issues, contact your county extension office, or (if in Escambia or Santa Rosa counties) visit ECUAs FOG website (Fats, Oils, and Grease) https://ecua.fl.gov/live-green/fats-oils-grease.
by Matt Deitch | May 8, 2020
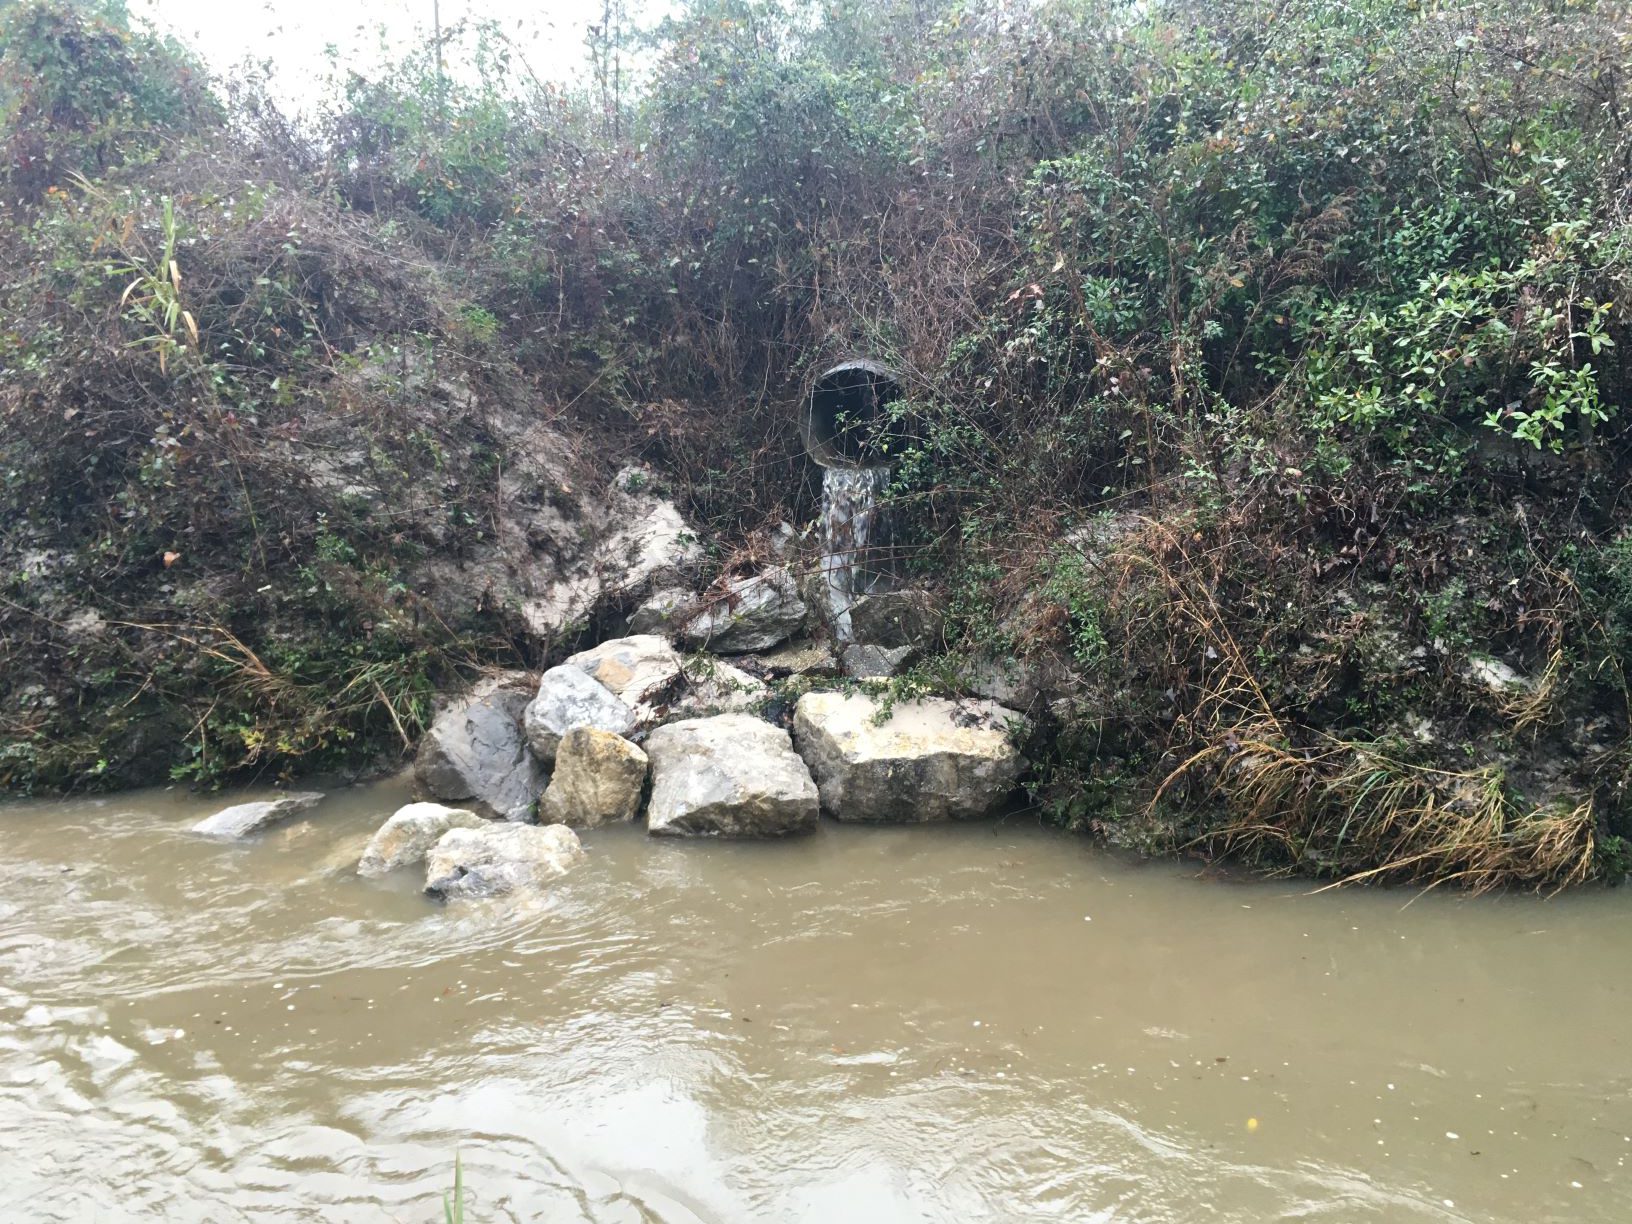
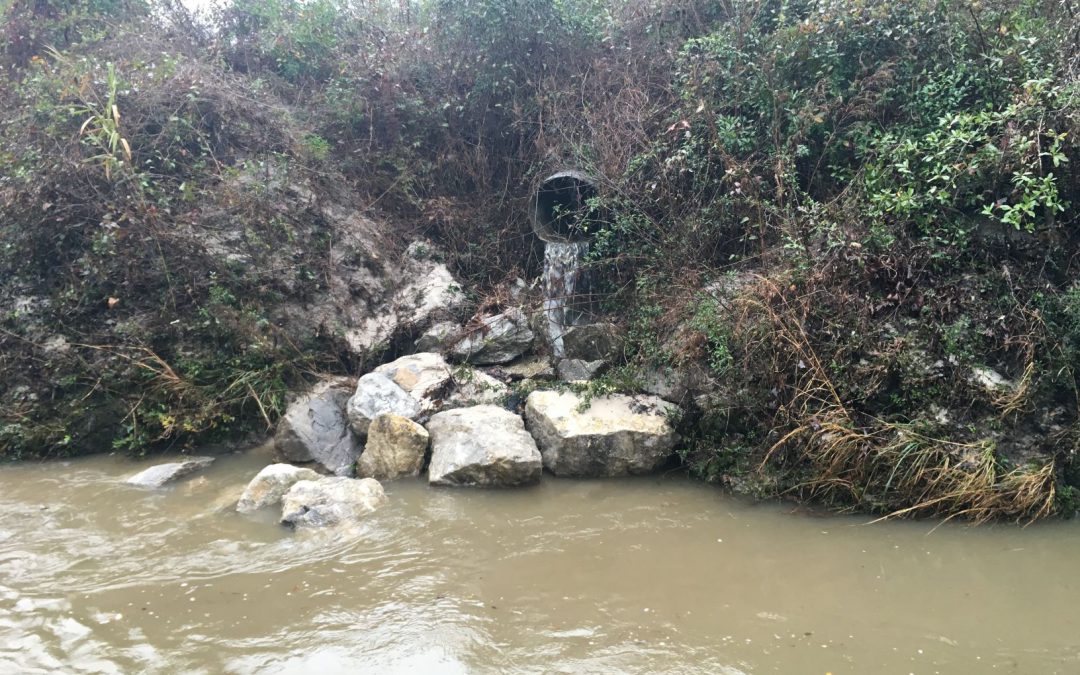
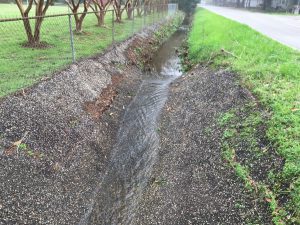
Urbanization—the process of conversion from forests, grasslands, or agricultural fields to predominantly residential, commercial, and industrial settings—can cause profound changes to the pathways that rainfall takes to become streamflow. This landscape conversion leads to less water infiltrating into soil and more water running directly into streams and other nearby water bodies (such as lakes, wetlands, and bayous). Urban water runoff carries pollutants that have accumulated on the landscape and in soil since the previous rainfall. If the concentrations of pollutants in streams are large enough, they can cause problems for the organisms that live in streams as well as those in the bays and bayous those streams flow into (often called receiving waters).
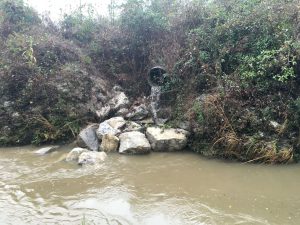
Stormwater conveyance in Santa Rosa nd Escambia counties.
Photo: Matt Deitch
Local governments play a key role in mitigating the impacts of urbanization on aquatic ecosystems. In northwest Florida, County government is often responsible for limiting pollutant inputs from the network of surface and underground stormwater conveyances known as “municipal separate storm sewer systems” (abbreviated as MS4s). The United States EPA requires urban areas to be regulated as sources of pollutant discharge through their National Pollutant Discharge Elimination System (abbreviated NPDES); departments within Escambia County and Santa Rosa County government coordinate the administration of these permits with the US EPA.
The requirements of these MS4 water quality permits vary depending on the population of the area. Permits for medium and large cities or counties having populations greater than 100,000 are categorized as “Phase I” MS4s, while areas with smaller populations are categorized as being “Phase II” MS4s. These two categories have many similar requirements, but also have a few important differences. Permits for both types of MS4s require local agencies to develop methods for community outreach on stormwater pollution issues, controlling runoff from construction sites, and requiring stormwater management in new developments. In addition to the requirements listed above, Phase I MS4s require the implementation of a water quality monitoring program and a plan to reduce pollutants from developed areas.
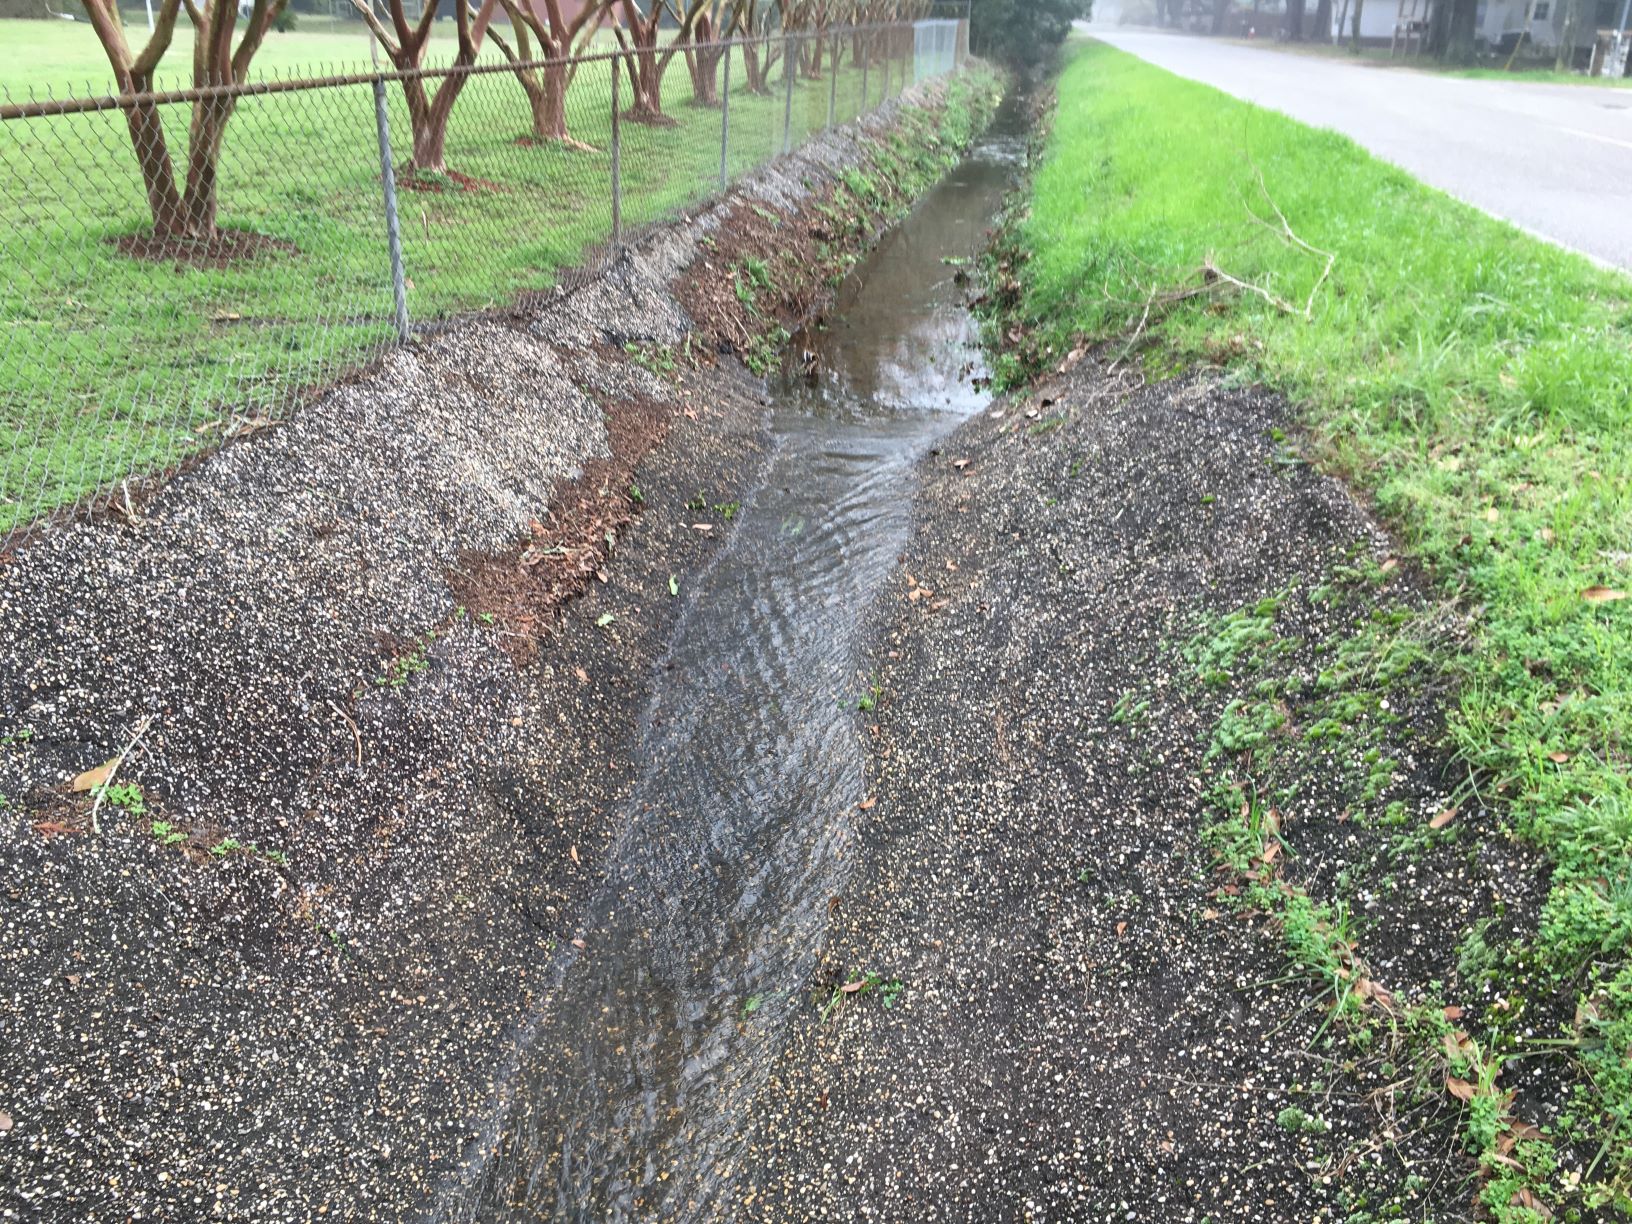
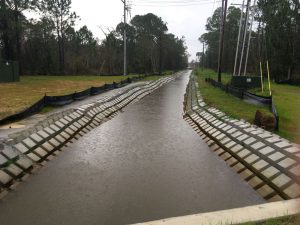
Stormwater conveyance in Santa Rosa and Escambia counties.
Photo: Matt Deitch
In Spring 2020, the southern portion of Santa Rosa County transitioned from a Phase II MS4 region to Phase I. This means that Santa Rosa County will begin implementation of a surface water monitoring program to evaluate pollutant concentrations in stormwater conveyances (including creeks); and develop plans for reducing pollutants from their MS4s entering the Pensacola Bay System. This program will make important contributions to understanding the effects of urban development on our local streams and estuaries, and improve water quality in the Pensacola Bay System.
This is a great opportunity to remind us of the importance of disposing our personal protective equipment including face masks, plastic gloves, and other single-use items we use to protect ourselves from the coronavirus in the trash after use. Leaving it on the curb or in parking lots means that it can wash into stormwater ponds or creeks and bayous, which can cause problems for the animals that live there.
Stormwater conveyance in Escambia and Santa Rosa counties.
Photo: Matt Deitch
by Andrea Albertin | Apr 9, 2020
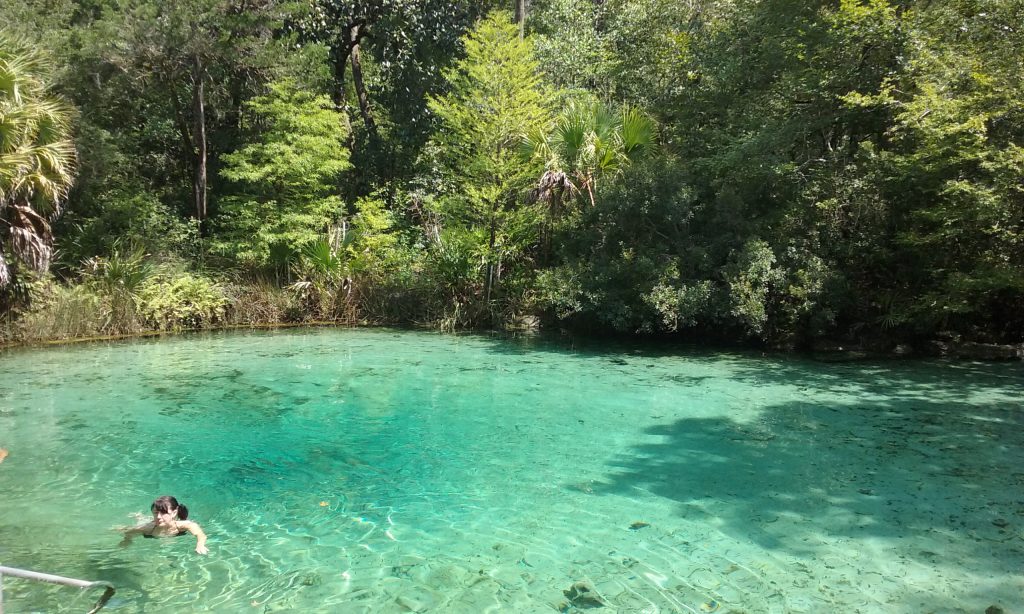
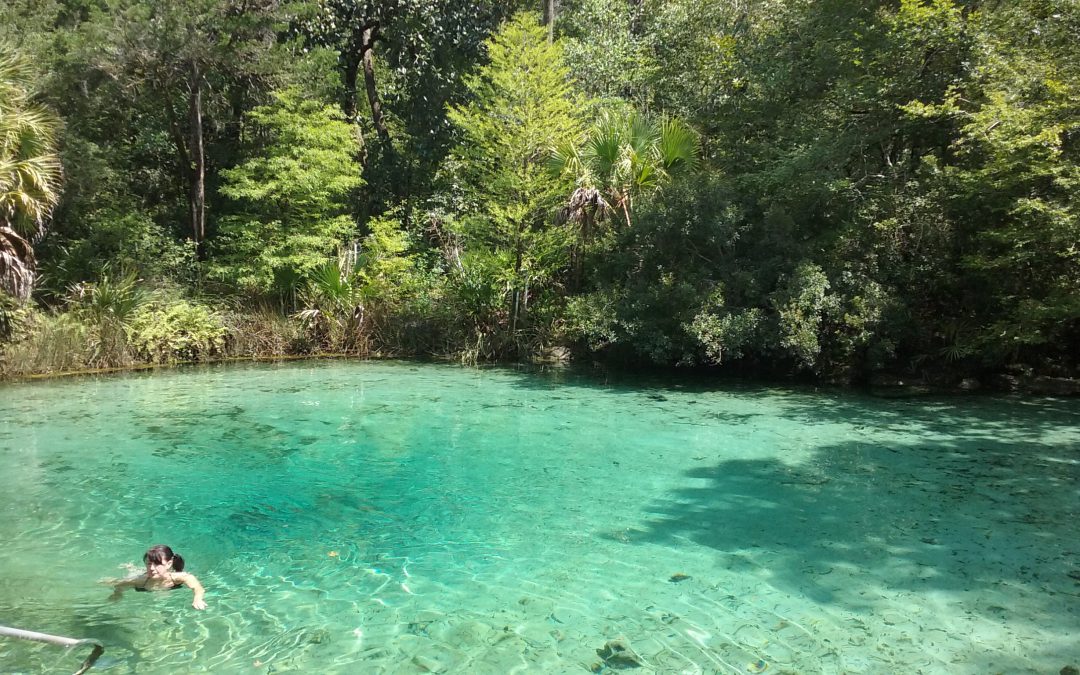
Pitt Spring in the Florida Panhandle is one of more than 1,000 freshwater springs in the state. Springs serve as ‘windows’ to groundwater quality, since the water that flows from them comes largely from the Upper Floridan Aquifer. Photo: A. Albertin
As Florida residents, we are so fortunate to have the Floridan Aquifer lying below us, one of the most productive aquifer systems in the world. The aquifer underlies an area of about 100,000 square miles that includes all of Florida and extends into parts of Alabama, Georgia and South Carolina, as well as parts of the Atlantic Ocean and the Gulf of Mexico (Figure 1). The Floridan Aquifer consists of the Upper and Lower Floridan Aquifer.
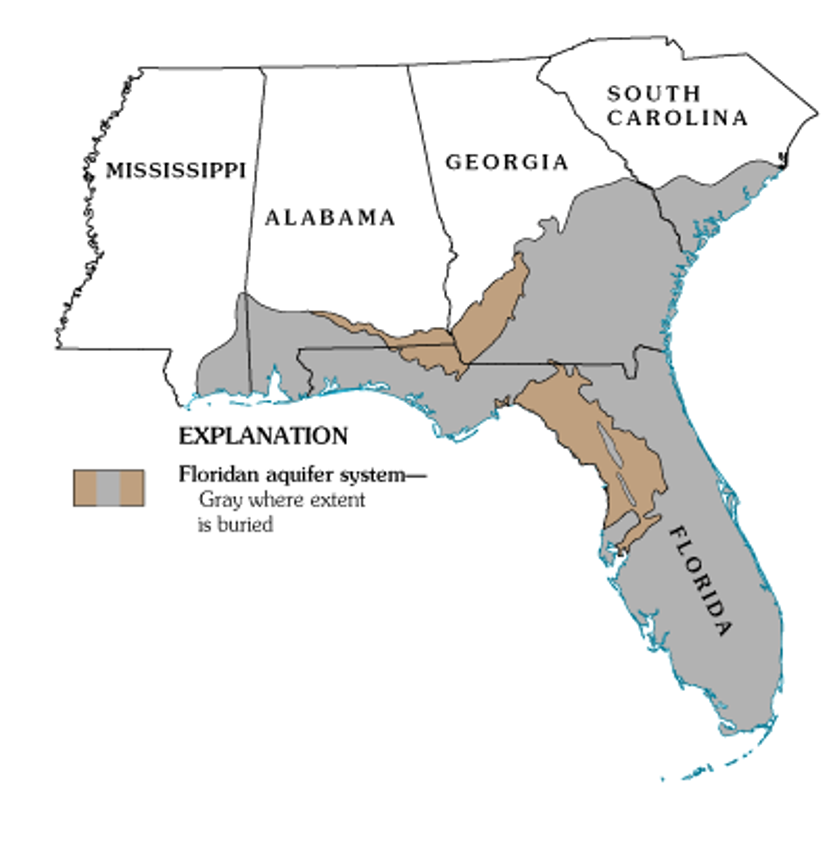
Figure 1. Map of the extent of the Floridan Aquifer. Areas in gray show where the aquifer is buried deep below the land surface, while areas in light brown indicate where the aquifer is at land surface. Many springs in Florida are found in these light brown areas. Source: USGS Publication HA 730-G.
Aquifers are immense underground zones of permeable rocks, rock fractures and unconsolidated (or loose) material, like sand, silt and clay that hold water and allow water to move through them. Both fresh and saltwater fill the pores, fissures and conduits of the Floridan Aquifer. Saltwater, which is more dense than freshwater, is found in all areas of the deeper aquifer below the freshwater.
The thickness of the Floridan Aquifer varies widely. It ranges from 250 ft. thick in parts of Georgia, to about 3,000 ft. thick in South Florida. Water from the Upper Floridan Aquifer is potable in most parts of the state and is a major source of groundwater for more than 11 million residents. However, in areas such as the far western panhandle and South Florida, where the Floridan Aquifer is very deep, the water is too salty to be potable. Instead, water from aquifers that lie above the Floridan is used for water supply.
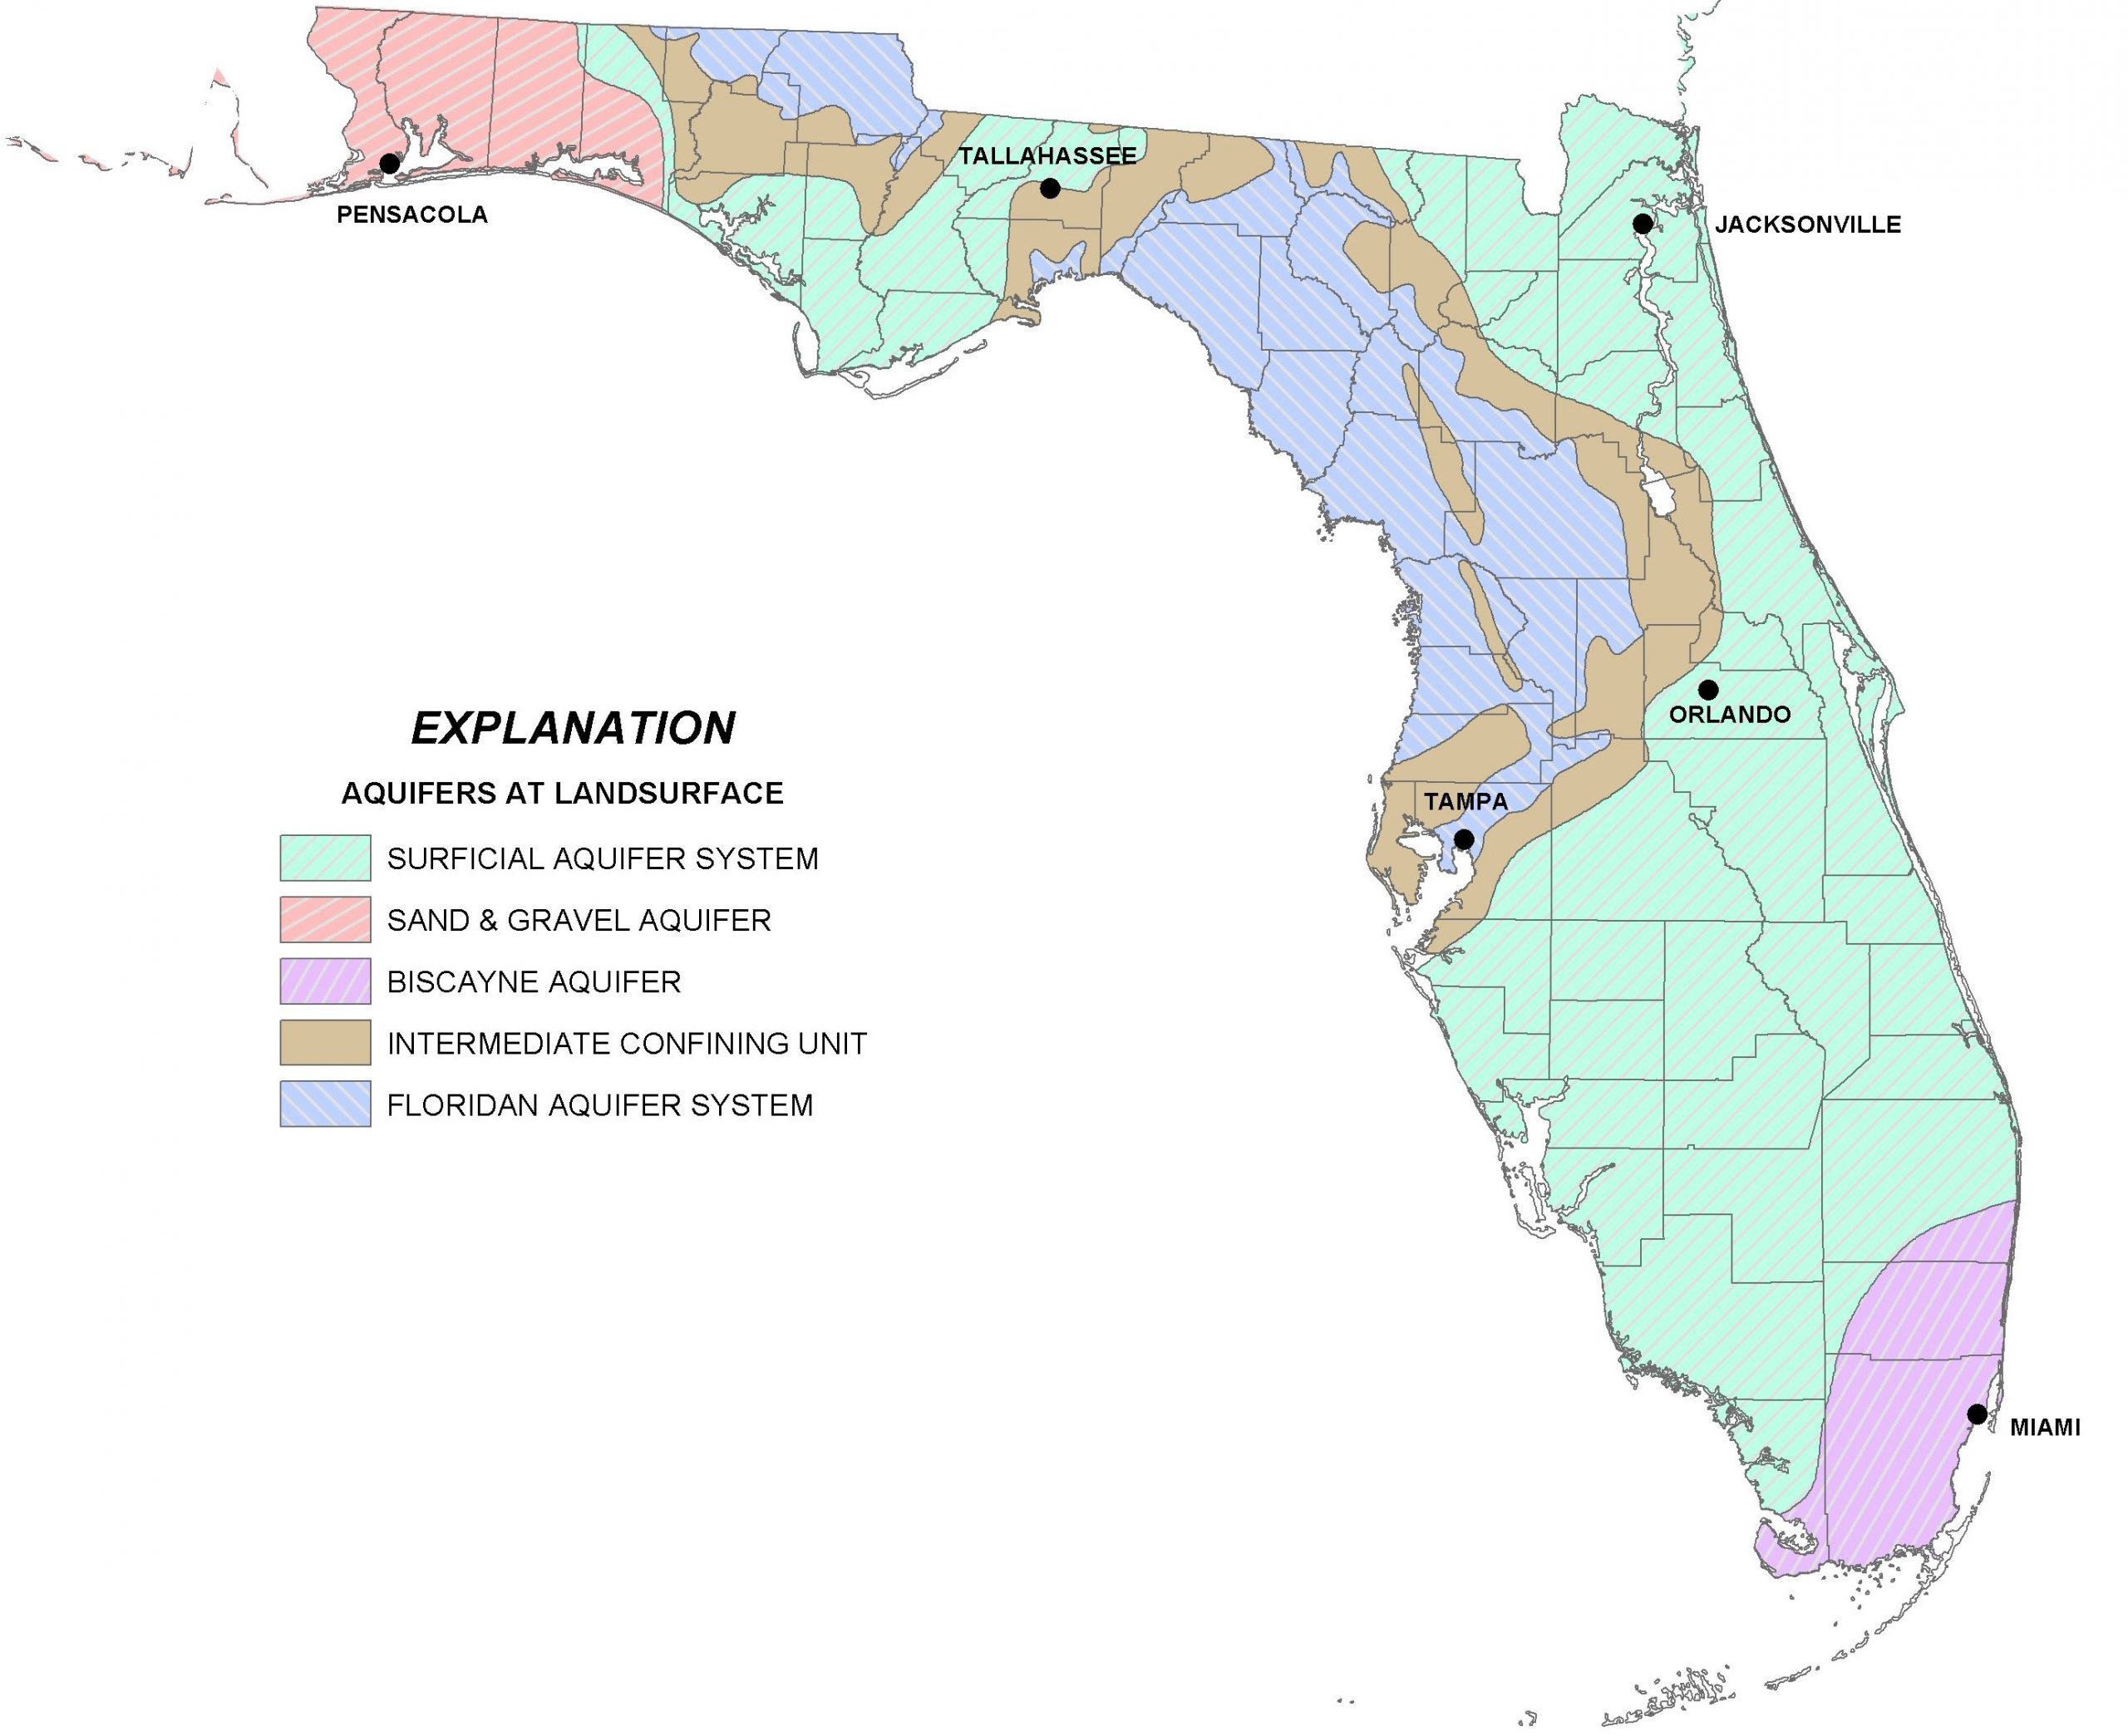
There are actually several major aquifer systems in Florida that lie on top of the Floridan Aquifer and are important sources of groundwater to local areas (Figure 2):
- The Sand and Gravel Aquifer in the far western panhandle is the main source of water for Santa Rosa and Escambia Counties. It is made up of of sand and gravel interbedded with layers of silt and clay.
- The Biscayne Aquifer supplies water to Dade and Broward Counties and southern Palm Beach County. A pipeline also transports water from this aquifer to the Florida Keys. The aquifer is made of permeable limestone and less permeable sand and sandstone.
- The Surficial Aquifer System (marked in green in the map in Figure 2) is the major source of drinking water in St. Johns, Flagler and Indian River counties, as well as Titusville and Palm Bay. It is typically shallow (less than 50 ft. thick) and is often referred to as a ‘water table’ aquifer, but in Indian River and St. Lucie Counties, it can be up to 400 ft. thick.
- Not included in Figure 2 is a fourth aquifer, the Intermediate Aquifer System in southwest Florida. It lies at a depth between the Surficial Aquifer System and the Floridan Aquifer. It is found south and east of Tampa, in Hillsborough and Polk counties and extends south through Collier County. It is the main source of water supply for Sarasota, Charlotte and Lee counties, where the underlying Floridan Aquifer is too salty to be potable.

Figure 2. A map of four major aquifer systems in the state of Florida at land surface. The Floridan Aquifer (in blue) underlies the entire state, but in areas north and east of Tampa it is found at the surface. The Surficial (green), Sand and Gravel (red), and Biscayne Aquifer (purple/pink) lie on top of the Floridan Aquifer. A confining unit (area in brown) consists of impermeable materials like thick layers of fine clay that prevent water from easily moving through it. Source: FDEP.
All of the aquifer systems in Florida are recharged by rainfall. In general, freshwater from deeper portions of the aquifer tends to have better water quality than surficial systems, since it is less susceptible to pollution from land surfaces. But, in areas where groundwater is excessively pumped or wells are drilled too deeply, saltwater intrusion occurs. This is where the underlying, denser saltwater replaces the pumped freshwater. Florida’s highly populated coastal areas are particularly susceptible to saltwater intrusion, and this is one of the main reasons that water conservation is a major priority in Florida.
More information about the Floridan Aquifer System and overlying aquifers can be found at the Florida Department of Environmental Protection (https://fldep.dep.state.fl.us/swapp/Aquifer.asp#P4) and in the UF EDIS Publication ‘Florida’s Water Reosurces’ by T. Borisova and T. Wade (https://edis.ifas.ufl.edu/fe757).

by Matt Deitch | Mar 13, 2020
Flooding and poor water quality are common issues of concern in the Florida Panhandle. Our frequent heavy rains cause water to quickly run off rooftop, parking lot, and driveway surfaces; this runoff water carries with it the chemicals deposited on land surfaces between rain events by direct application (such as landscape fertilizers) as well as through wind and circulation, a process referred to as atmospheric deposition. Surface water that runs off our developed urban and residential landscape is usually routed into stormwater drains and sewers, and then into stormwater detention ponds or directly into surface streams.
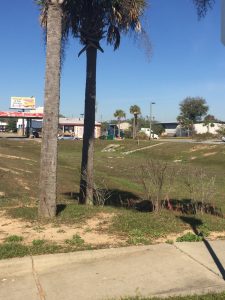
Dry stormwater pond in Escambia County.
Photo: Matt Deitch
Conventional methods for dealing with stormwater runoff is through the use of stormwater ponds. Stormwater ponds allow water to slowly infiltrate into the soil before moving to streams or wetlands via shallow groundwater pathways. Typically hidden behind shopping centers or in the back of residential subdivisions, stormwater ponds attenuate flooding by delaying the time when water reaches the stream and are intended to improve water quality through microbial processes (such as denitrification) or plant uptake, particularly focusing on reducing the amount of nitrogen and phosphorus that reaches nearby streams. However, the efficacy of stormwater ponds is highly variable (many do not function as intended), and they often are visually unattractive aspects of a community.
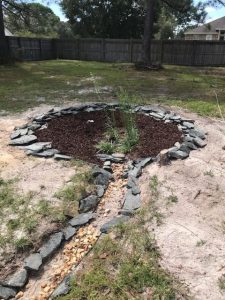
A backyrad rain garden after installation near Navarre FL.
Photo: Nikki Bennett
Stormwater managers in other parts of Florida are increasingly utilizing a suite of management features termed “green infrastructure” as alternatives to stormwater ponds to reduce floodwaters and improve water quality before it enters nearby streams and wetlands. Green infrastructure, which includes features such as rain gardens, green rooftops, rainwater cisterns, bioswales, and permeable pavers, is designed to slow water down and reduce pollutant concentrations by mimicking natural processes of infiltration and biological uptake at its source—off the rooftops, driveways, roads, and parking lots where stormwater first concentrates. As a result, green infrastructure reduces surface runoff that occurs during storm events, leading to less flooding downstream. With the magnitude of peak flow reduced, stormwater runoff is also likely to carry lower amounts of pollutants downstream. In addition to their capacity to reduce flooding and improve water quality, green infrastructure can have many other benefits. It is often visually appealing, with vegetation typically selected to be visually attractive, appropriate for local conditions, and requiring low maintenance.
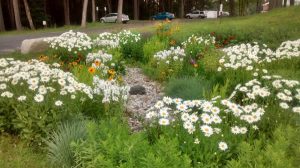
Rain garden at the VA Central Western Massachusetts Health Care System facility.
Photo: US Air Force
With our frequent rainfall, moderately developed urban areas, and expanding communities, the Florida Panhandle is ideal for using green infrastructure to reduce flooding and improve water quality. Features such as bioswales, rain gardens, and permeable pavement can be added to new development to mitigate stormwater runoff; they can also be added to existing neighborhoods to reduce flooding where roadside areas or other shared spaces allow. In addition to mitigating the effects of rainfall, green infrastructure can also improve property values because of their visual appeal. For green infrastructure techniques to be effective, they require widespread use throughout a neighborhood rather than at a handful of locations; so if it sounds like green infrastructure would benefit your community, talk with your neighbors and reach out to UF IFAS agents to discuss how it could be added to your community!
by Andrea Albertin | Jan 31, 2020

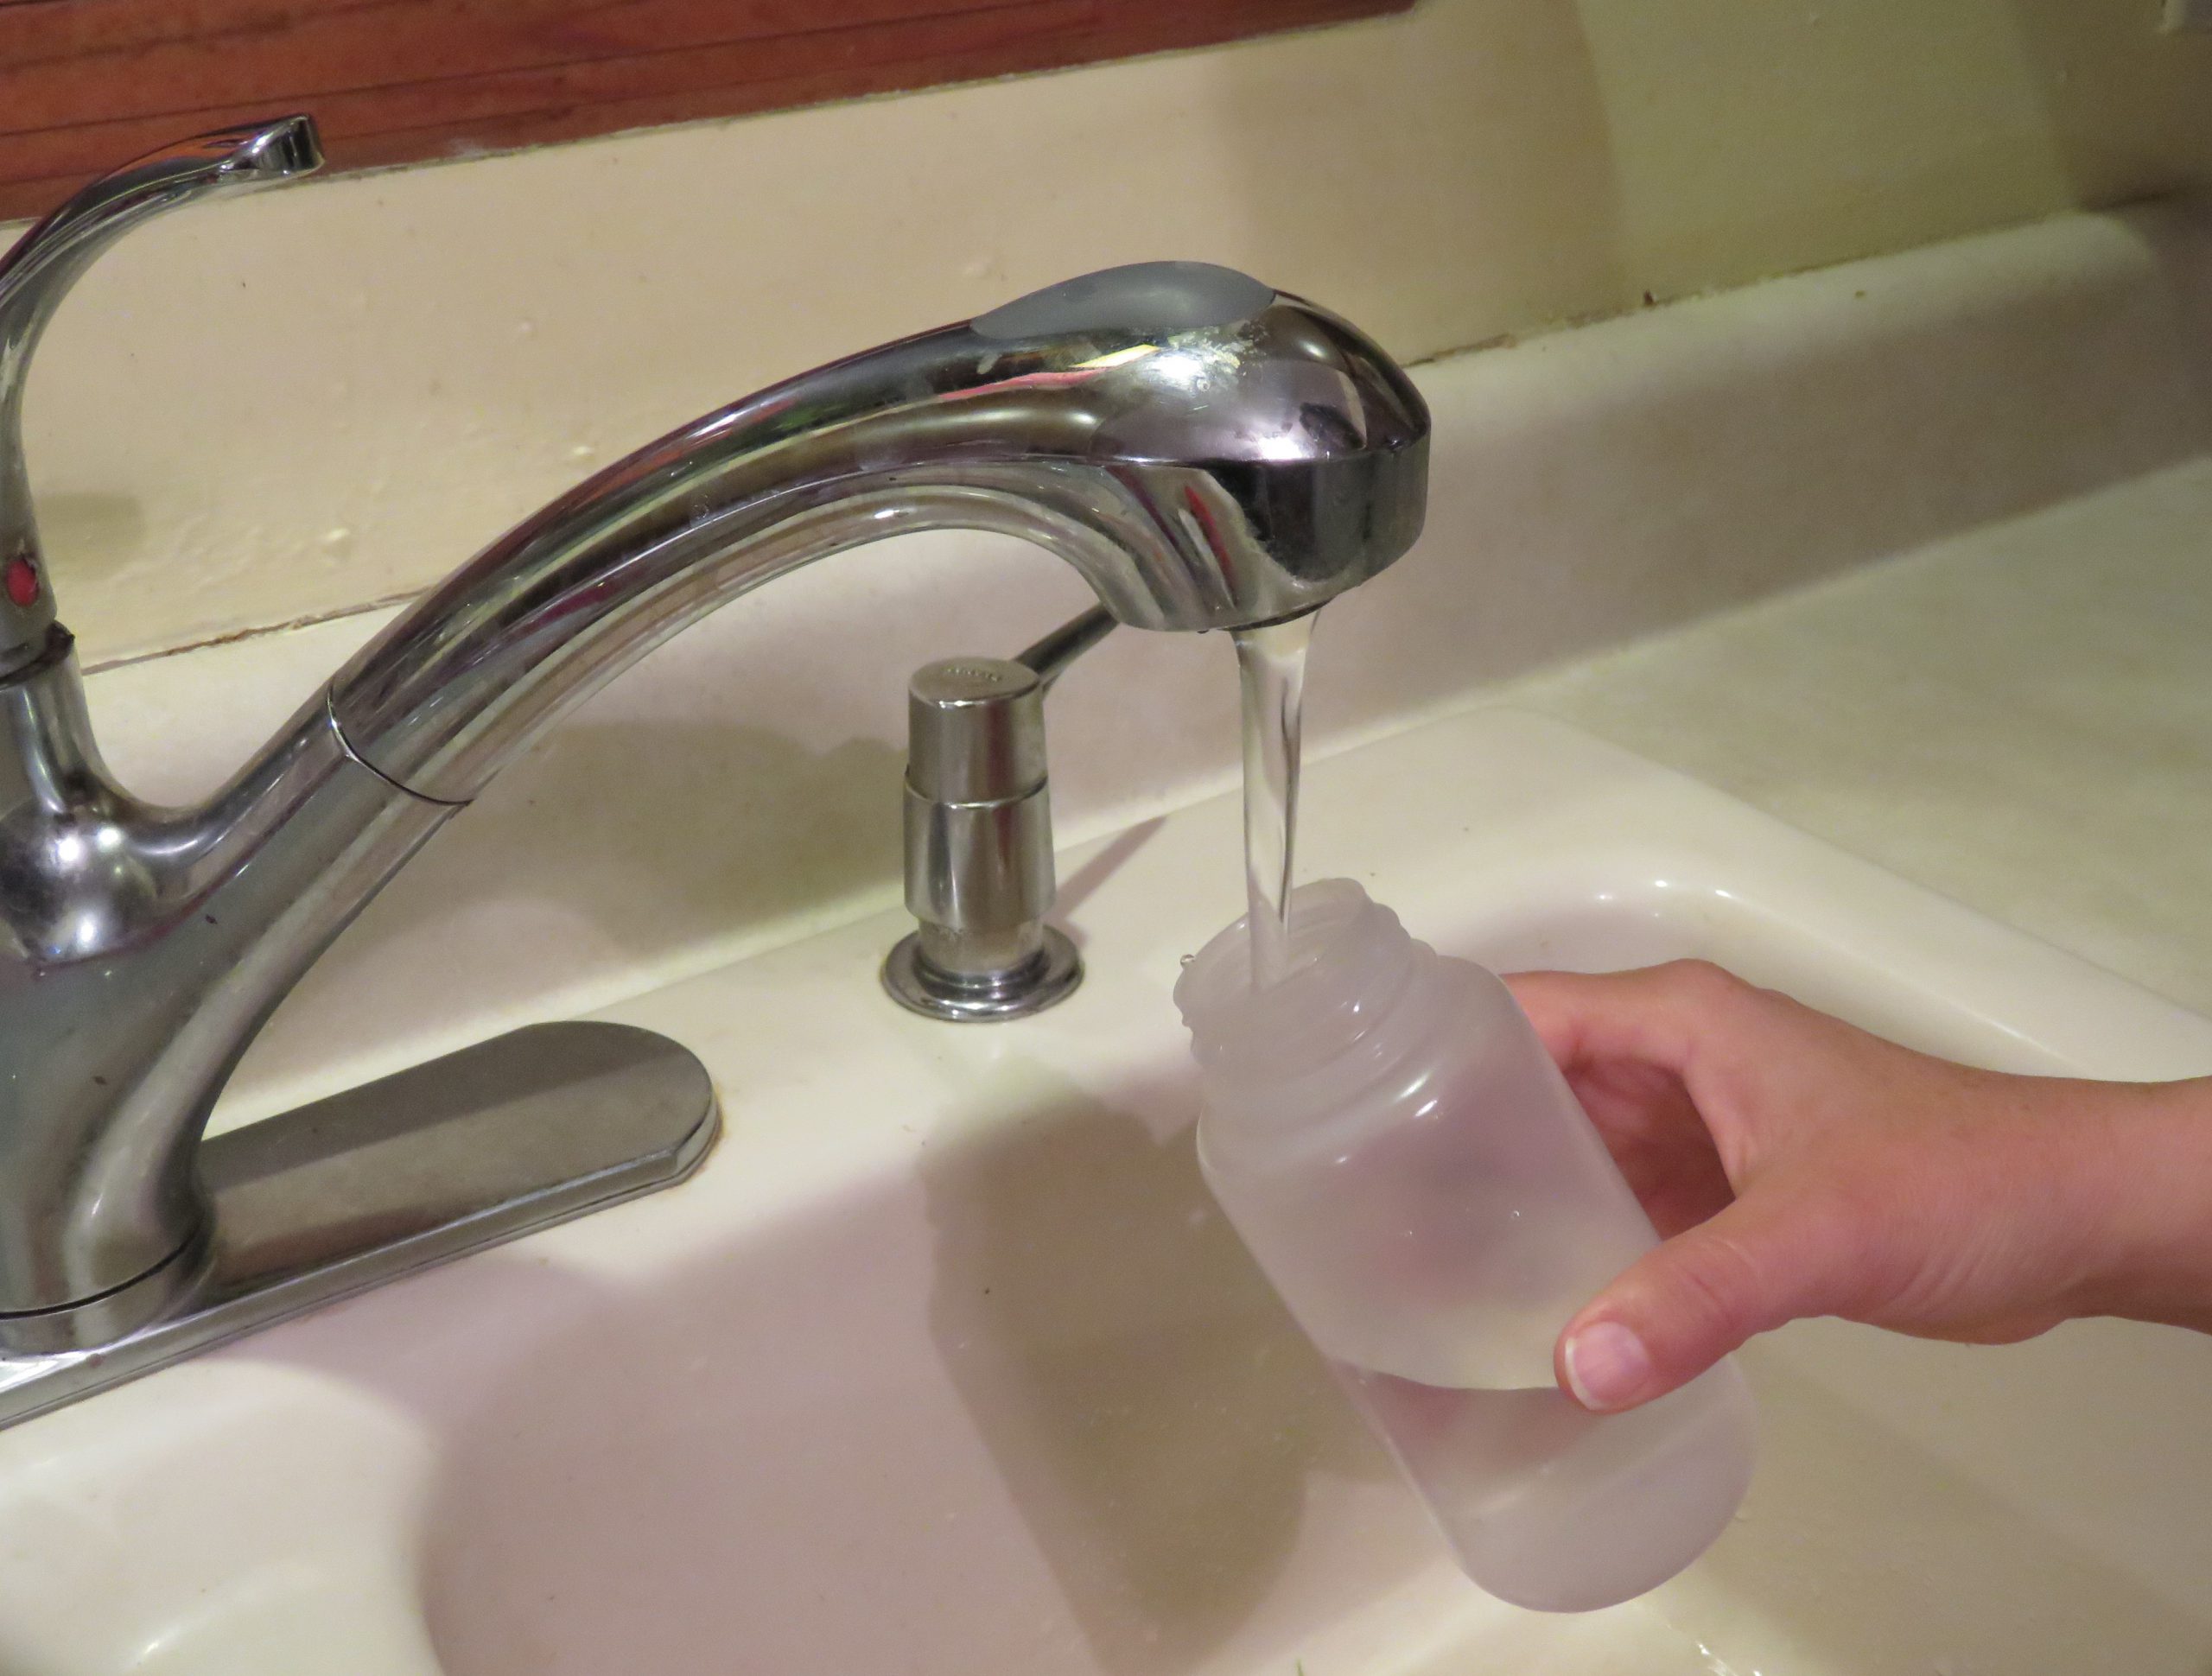
Contact you local county health department office for information on how to test your well water. Image: F. Alvarado Arce
Residents that rely on private wells for home consumption are responsible for ensuring the safety of their own drinking water. The Florida Department of Health (FDOH) recommends private well users test their water once a year for bacteria and nitrate.
Unlike private wells, public water supply systems in Florida are tested regularly to ensure that they are meeting safe drinking water standards.
Where can you have your well water tested?
Your best source of information on how to have your water tested is your local county health department. Most health departments test drinking water and they will let you know exactly what samples need to taken and ho w to submit a sample. You can also submit samples to a certified private lab near you.
Contact information for county health departments can be located at: http://www.floridahealth.gov/programs-and-services/county-health-departments/find-a-county-health-department/index.html
Contact information for private certified laboratories are found at https://fldeploc.dep.state.fl.us/aams/loc_search.asp
Why is it important to test for bacteria?
Labs commonly test for both total coliform bacteria and fecal coliforms (or E. coli specifically). This usually costs about $25 to $30, but can vary depending on where you have your sample analyzed.
- Coliform bacteria are a large, diverse group of bacteria and most species are harmless. But, a positive test for total coliforms shows that bacteria are getting into your well water. They are used as indicators – if coliform bacteria are present, other pathogens that cause diseases may also be getting into your well water. It is easier and cheaper to test for total coliforms than to test for a suite of bacteria and other organisms that can cause health problems.
- Fecal coliform bacteria are a subgroup of coliform bacteria found in human and other warm-blooded animal feces, in food and in the environment. E. coli are one group of fecal coliform bacteria. Most strains of E. coli are harmless, but some strains can cause diarrhea, urinary tract infections, and respiratory illnesses among others.
To ensure safe drinking water, FDOH strongly recommends disinfecting your well if the water tests positive for (1) only total coliform bacteria, or (2) both total coliform and fecal coliform bacteria (or E. coli). Disinfection is usually done through shock chlorination. You can either hire a well operator in your area to disinfect your well or you can do it yourself. Information for how to shock chlorinate your well can be found at http://www.floridahealth.gov/environmental-health/private-well-testing/_documents/well-water-facts-disinfection.pdf
Why is it important to test for nitrate concentration?
High levels of nitrate in drinking water can be dangerous to infants, and can cause “blue baby syndrome” or methemoglobinemia. This is where nitrate interferes with the blood’s capacity to carry oxygen. The Maximum Contaminant Level (MCL) allowed for nitrate in drinking water is 10 milligrams nitrate per liter of water (mg/L). It is particularly important to test for nitrate if you have a young infant in the home that is drinking well water or when well water is used to make formula to feed the infant.
If test results come back above 10 mg/L nitrate, use water from a tested source (bottled water or water from a public supply) until the problem is addressed. Nitrates in well water can come from fertilizers applied on land surfaces, animal waste and/or human sewage, such as from a septic tank. Have your well inspected by a professional to identify why elevated nitrate levels are in your well water. You can also consider installing a water treatment system, such as reverse osmosis or distillation units to treat the contaminated water. Before having a system installed, contact your local health department for more information.
In addition to once a year, you should also have your well water tested when:
- The color, taste or odor of your well water changes or if you suspect that someone became sick after drinking well water.
- A new well is drilled or if you have had maintenance done on your existing well
- A flood occurred and your well and/or septic tank were affected
Remember: Bacteria and nitrate are not the only parameters that well water is tested for. Call your local health department to discuss your what they recommend you should get the water tested for, because it can vary depending on where you live.
FDOH maintains an excellent website with many resources for private well users at http://www.floridahealth.gov/environmental-health/private-well-testing/index.html, which includes information on potential contaminants and how to maintain your well to ensure the quality of your well water.