by Rick O'Connor | Mar 11, 2022
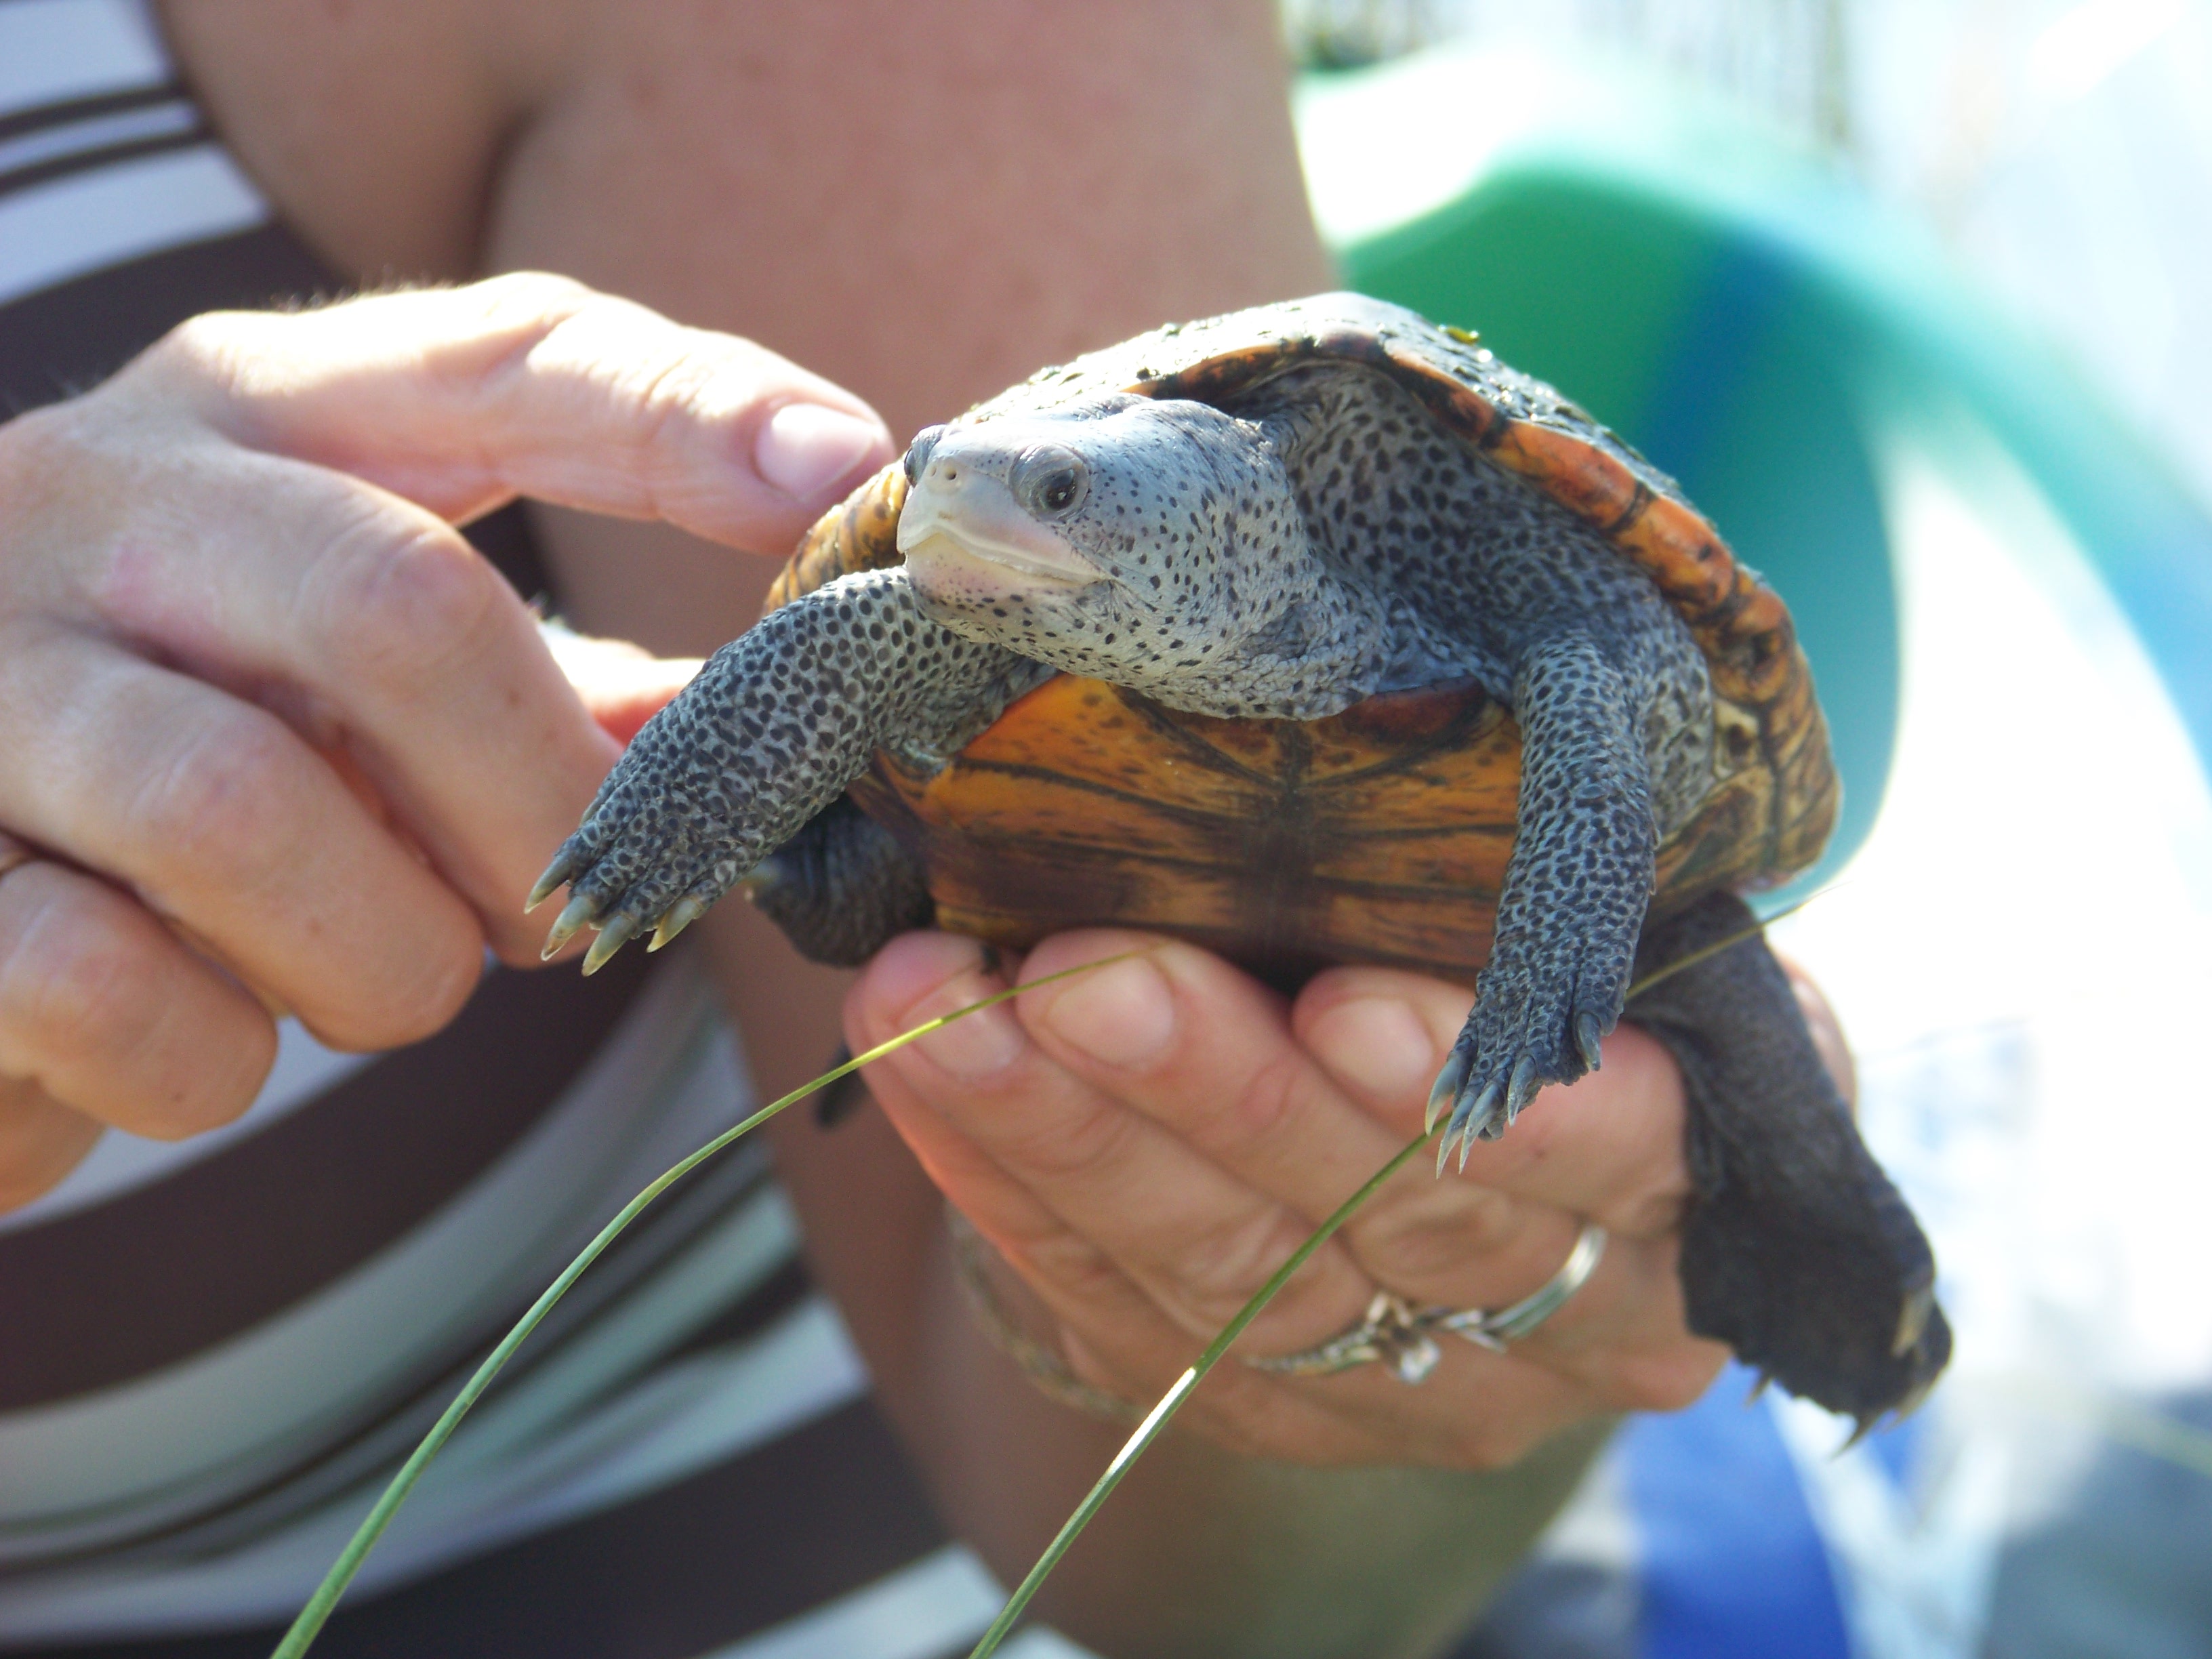
Let’s begin by stating what a diamondback terrapin is. I have found many Floridians are not familiar with the animal. It is a turtle. A turtle in the family Emydidae which includes the pond turtles, such as cooters and sliders. The big difference between terrapins and the other emydid turtles is their preference for salt water. They are not marine turtles but rather estuarine – they like brackish water.
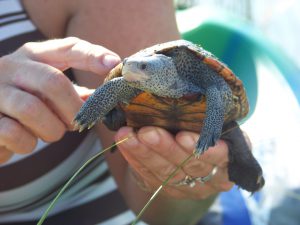
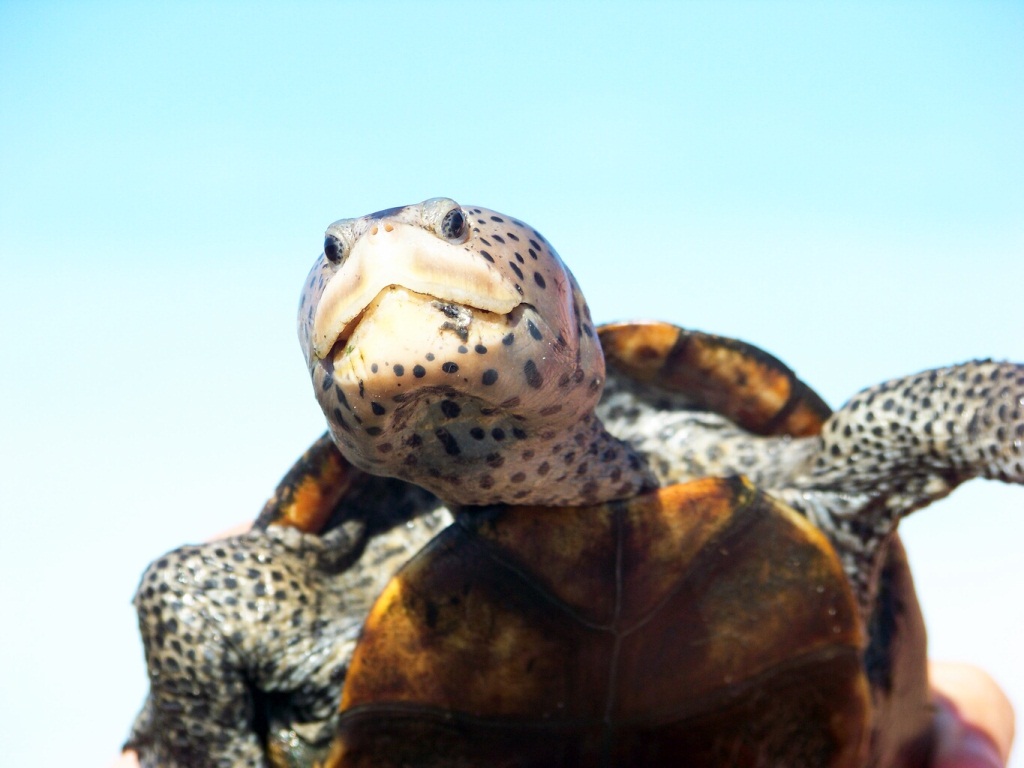
The diamond in the marsh. The diamondback terrapin.
Photo: Molly O’Connor
Their haunt are the salt marshes and mangroves of the state. Their range extends from Massachusetts down the east coast and covering all of the Gulf of Mexico over to Brownsville Texas. There are seven subspecies of the animal within that range. Five of those live in Florida and three only live in Florida. They are more abundant, and well known, in the Chesapeake Bay area where they are the mascot of the University of Maryland. In Florida they seem to be more secretive and hidden. Encounters with them are rare and there has been concern about their status for years. Though researchers are not 100% sure on their population size, it was felt that more conservation measures were needed.
Ten years ago, the issue with all turtles in the state was the illegal harvest for the food trade. All sorts of species were being captured and sent to markets overseas. The Florida Fish and Wildlife Conservation Commission (FWC) stepped in and set possession quotas on many species of Florida turtles. For terrapins, the number was two. For some, like the Suwannee Cooter, there was a no possession rule.
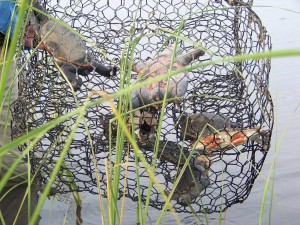
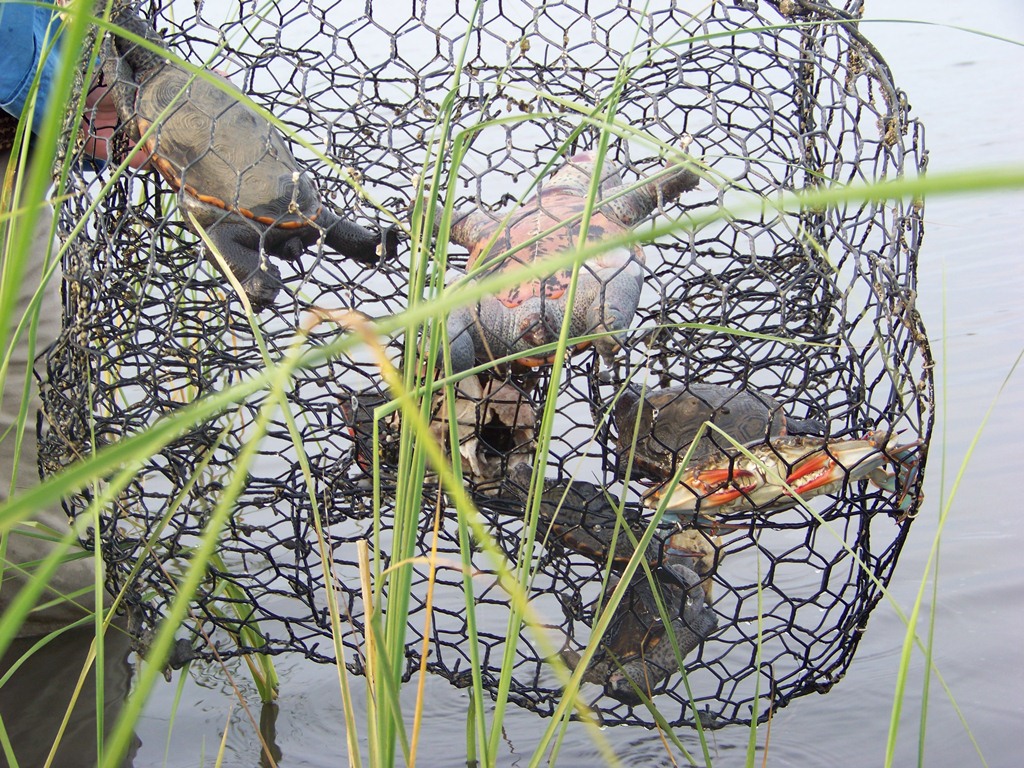
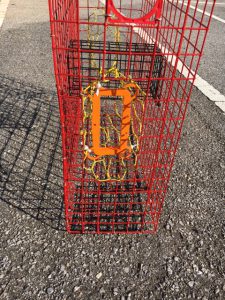
Drowned terrapins in a derelict crab trap in the Florida panhandle. (photo: Molly O’Connor)
There has also been concern with incidental capture of terrapins in crab traps. These turtles have been known to swim into the traps and drown. In the Chesapeake Bay area, they have found as many as 40 dead turtles in one trap. Not only is this bad for the turtles, but it is also bad for the crab fisherman because high numbers of dead turtles in the trap means no crabs. Studies began to develop some sort of excluder device that would keep terrapins out, but allow crabs in. Dr. Roger Wood developed a rectangle shaped wire excluder now called a By-Catch Reduction Device (BRD) that reduced the terrapin capture by 80-90% but had no significant effect on the crab catch. That was what they were looking for. This BRD has been required on crab traps up there for years.
What about Florida?
Studies using the BRD were also conducted here with the same results, but the BRD was not required. Incidental capture in crab traps does occur here but not to the extent it was happening in the Chesapeake and FWC wanted to hold off for more science before enacting the rule. BRDs were available for those who wanted them, but not required. This past December (2021) that changed.
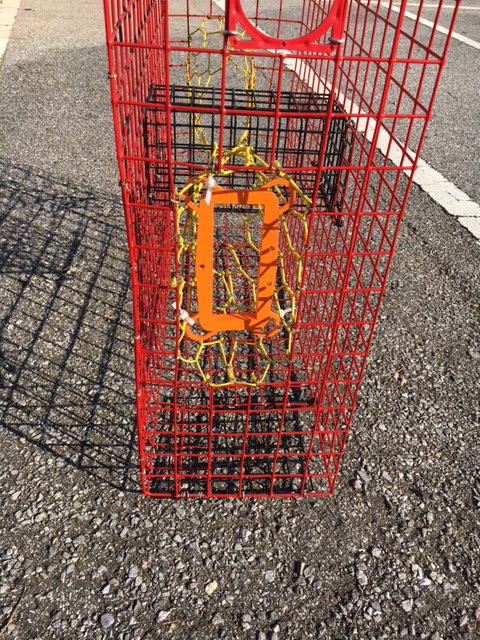
This orange plastic rectangle is a Bycatch Reduction Device (BRD) used to keep terrapins out of crab traps – but not crabs.
Photo: Rick O’Connor
In recent years there has been another issue with harvesting terrapins for the pet trade. With this, and other conservation concerns for this turtle, FWC developed a new rule for terrapins at their December 2021 meeting.
- The possession limit for terrapins has dropped from 2 to 0 – there is a no-take rule for this animal beginning March 1, 2022. Collection for scientific research will still be allowed with a valid collecting permit from the FWC. Those who currently have two or less terrapins in their possession as pets may keep them but must obtain a no cost personal possession permit to do so by May 31, 2022. Those who have terrapins within an education center may keep them but must obtain a no cost exhibit permit by May 31, 2022.
- Recreational crab traps will require the BRD device by March 1, 2023. You have a year. Those in the Pensacola area can contact me for these. I have a case of them I am willing to provide to the public.
Again, studies have shown that these BRDs do not significantly impact the crab catch. Crabs can turn sideways and still enter the traps. But reducing incidental capture of terrapins will hopefully increase their numbers in our state. For information on how to obtain the needed permits visit FWC.
by Rick O'Connor | Mar 11, 2022
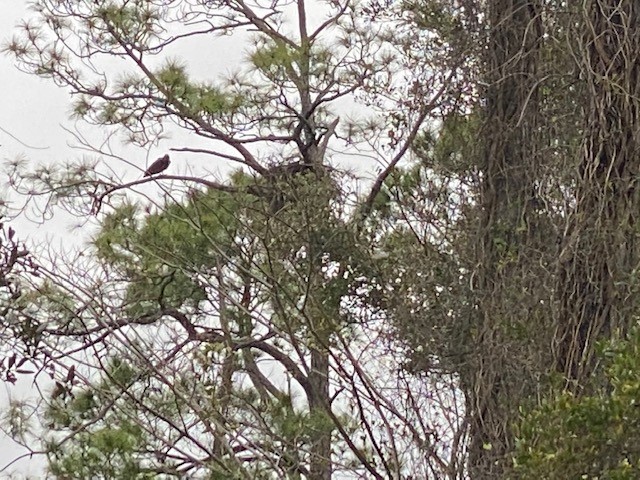
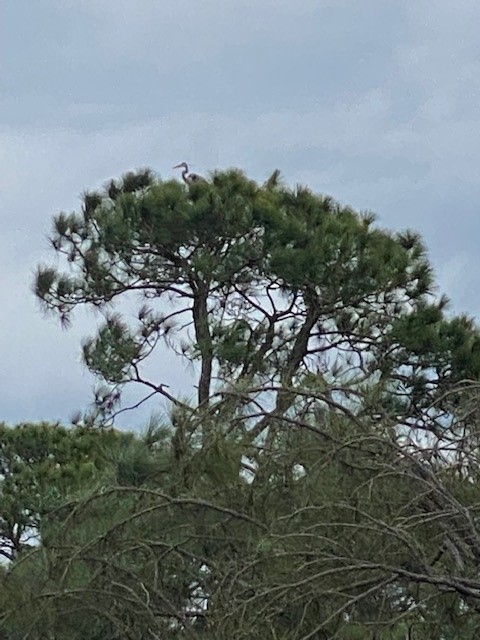
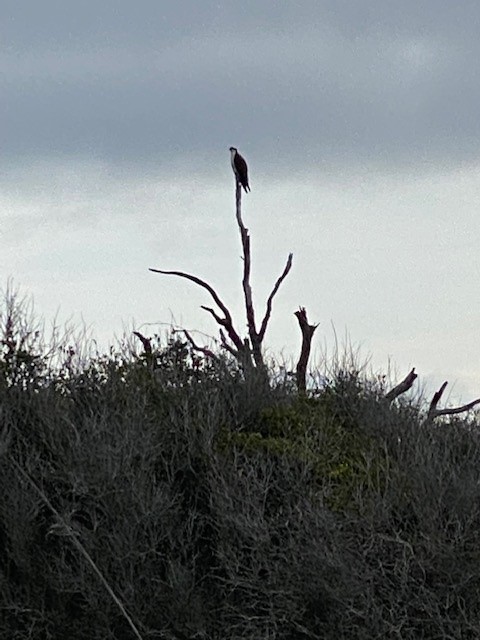
The month of March is the last of winter. For todays hike we returned to Gulf Islands National Seashore/Ft. Pickens where it was 63°F, overcast with a strong breeze from the northwest. A cold front is coming through to remind us that winter is not over yet. It was not 44°F as it was on our February hike but with the wind and cloud cover, it was a bit cool and not ideal for most wildlife to be out. But the ospreys were…
Osprey perched.
Photo: Rick O’Connor
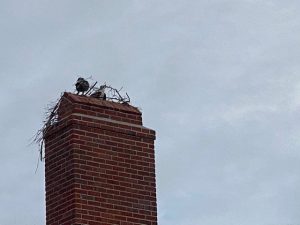
An osprey pair building a nest on the chimney of the ranger station at Ft. Pickens.
Photo: Rick O’Connor
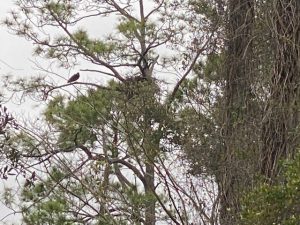
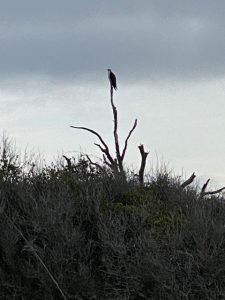
Another osprey pair with a nest in a large pine.
Photo: Rick O’Connor
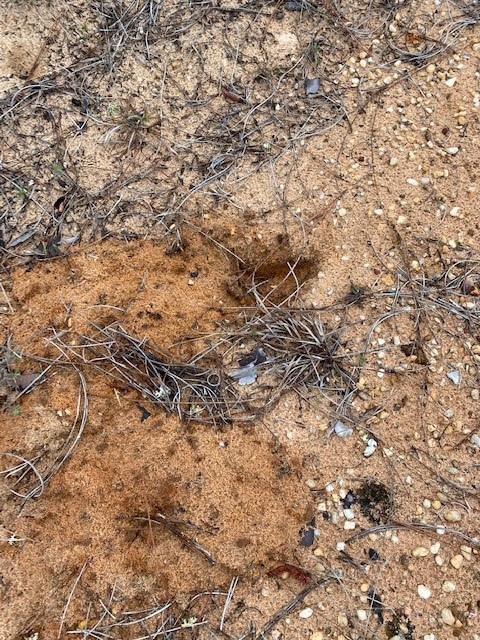
They were everywhere. Building nests in live pines, dead snags, platforms built just for this, and on the chimney of the ranger station. Their sounds were everywhere – it is breeding season for them. The great blue herons were still nesting, we saw them first in January, but there are still a few around. American egrets were out as were numerous mourning doves. As with the colder February day, it was primarily bird action right now. I did see evidence of armadillos, and would guess other mammals were on the move, but did not see evidence of any others. The reptiles and amphibians are still missing – but should not be for long.

The herons began nesting in January. Some are still there.

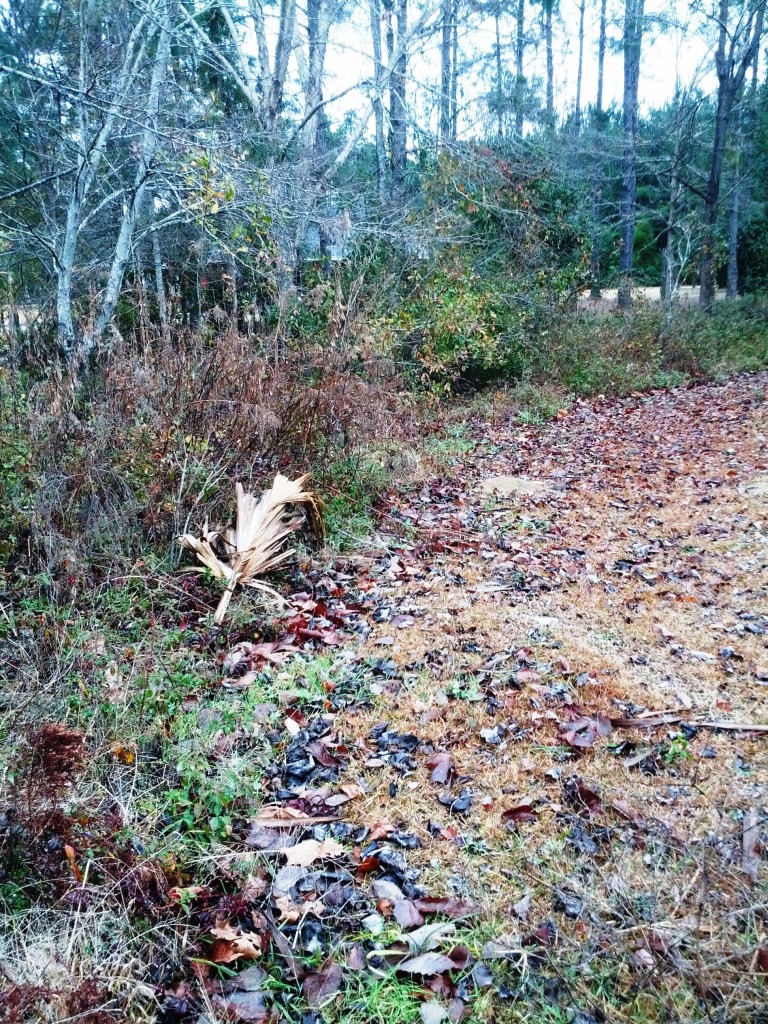
Evidence of armadillos digging.
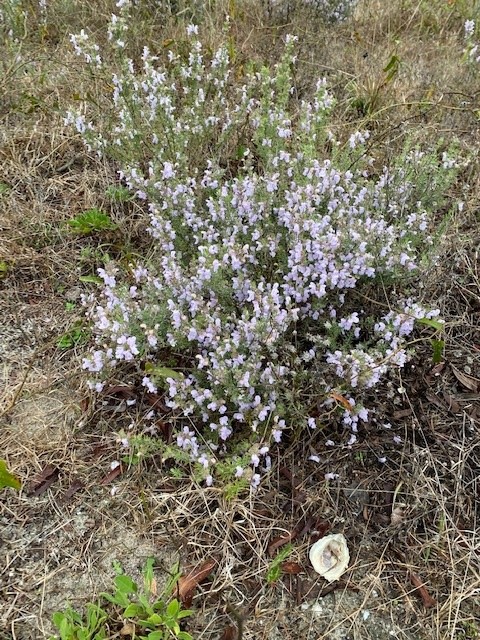
The plant I know as beach heather, many call false rosemary, and has the scientific name Conradina, was in full bloom. After the hollies of the Christmas season, these are the plants I often see bloom first. Though I have seen bees around my home already, and wasps, I did not see/hear any insect movement this morning.
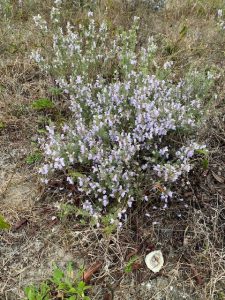
Beach heather (false rosemary) is one of the first plants to bloom on our islands.
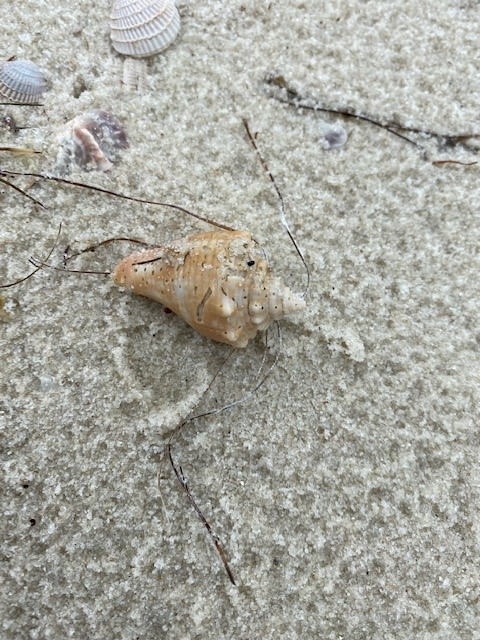
The north beach (Pensacola Bay) was rough due to the northwest wind. It was difficult to see if anything was moving around in the shallows. There were a lot of shells on the shore. Two particularly caught my eye. The Florida Fighting Conch was pretty abundant, more than normal – and there were several scallops shells. There are two species locally, the calico scallop (often found in the Gulf) and the bay scallop (the estuarine version and the one of “scalloping” fame). Calcio scallops are often pinkish in color and often with spots. The bay scallop is usually gray in color. Those I saw this morning were all bleached white but, based on other variety of shells in the mix, I am thinking these were calcio scallops.
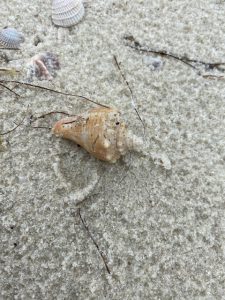
There were several Florida Fighting Conch shells on the beach this month.
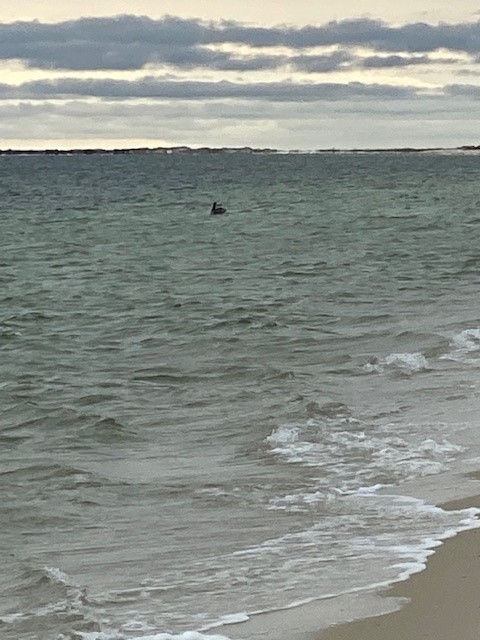
There was very little marine debris today and no tracks of any kind seen. There was only one lone pelican spotted, maybe due to the high winds they settled somewhere else. Maybe they have moved off to smaller islands for breeding themselves, I am not sure.
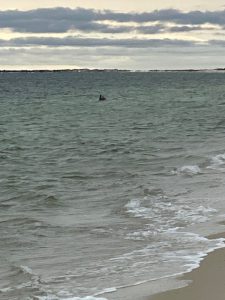
We only saw this one lone pelican today.
Though the wildlife has been more restricted to birds at the moment, the birding is excellent right now and the beach has relatively few people – it is a great time to take a hike out there.

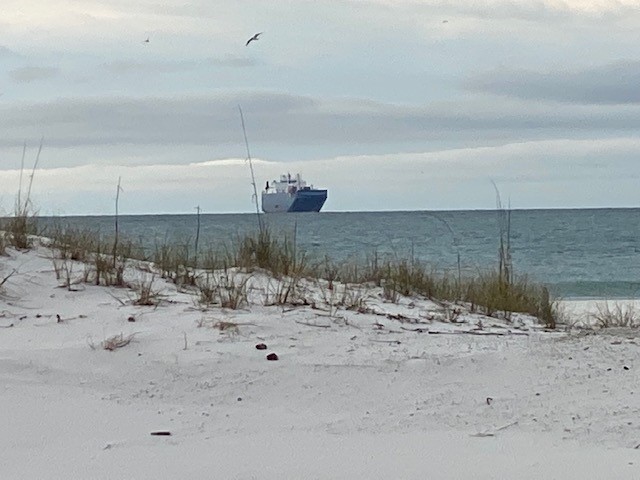
This large tanker awaits its turn to enter Pensacola Bay.
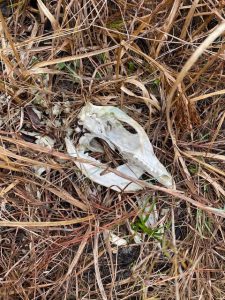
This skull found along the side of the side of the road is believed to be a raccoon.

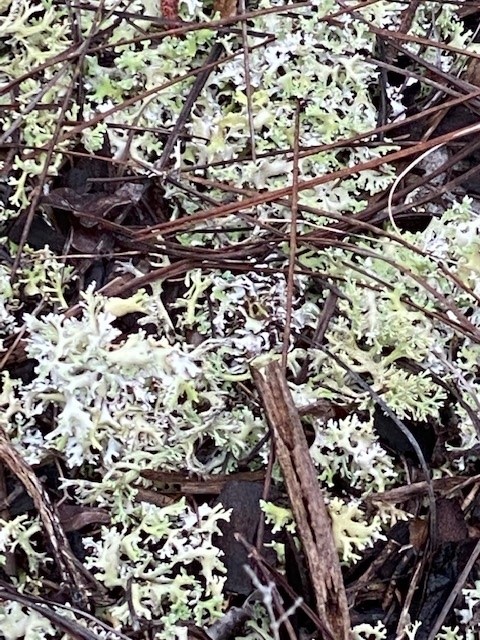
Lichen is an organism that is a partnership between algae and fungus. They were a brilliant white-green this month.
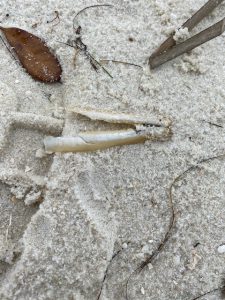
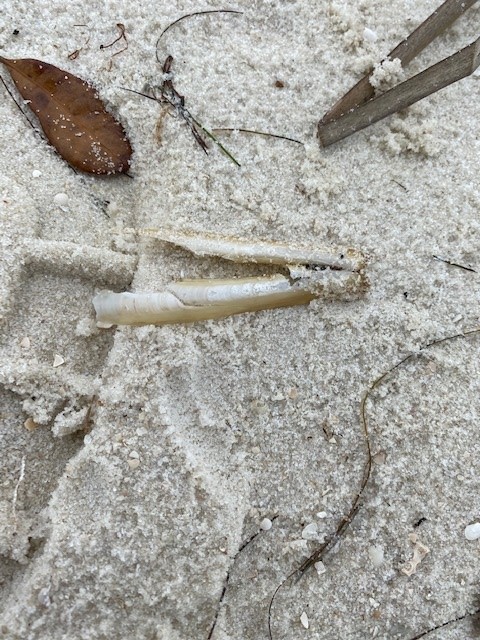
Razor clam shells are quite common along the shoreline.
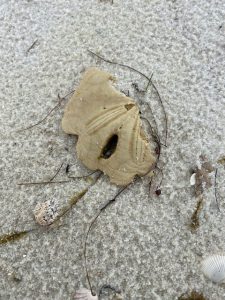
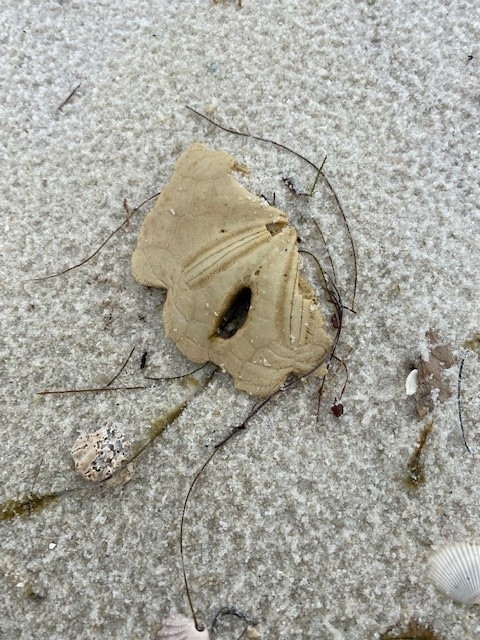
Sand dollars are not as common on the bay side of the island but there were several today.
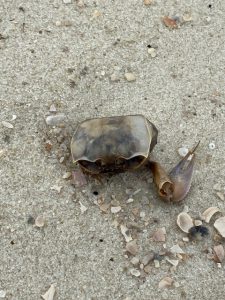
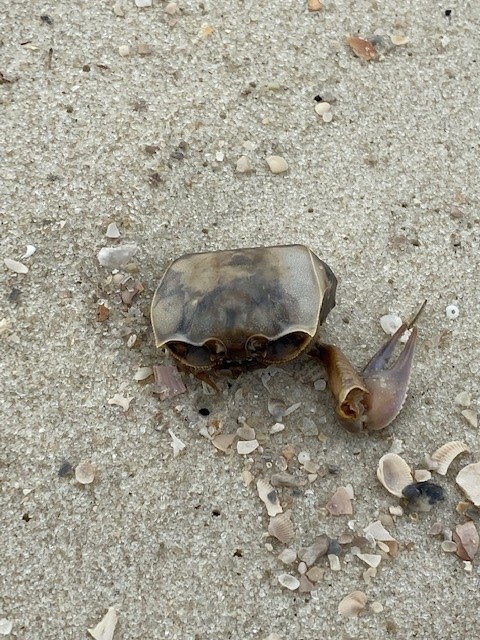
The remains of a ghost crab.
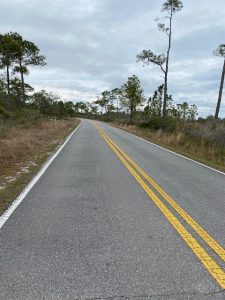
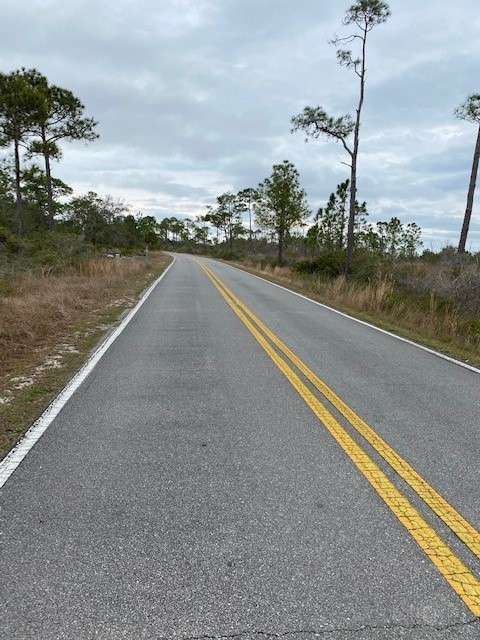
Believe it or not, walking along the road is a great spot to find wildlife.
by Rick O'Connor | Mar 11, 2022
Snook… Wait did you say Snook in the Florida panhandle?
Yep… they are not common, but they have seen here.
For those who do not know the fish and do not understand why seeing them is strange, this is a more tropical species associated with tarpon. In the early years of tourism in Florida tarpon fishing was one of the main reasons people came. Though bonefish and snook fishing were not has popular as tarpon, they were good alternatives and today snook fishing is popular in central and south Florida… but not in the north.
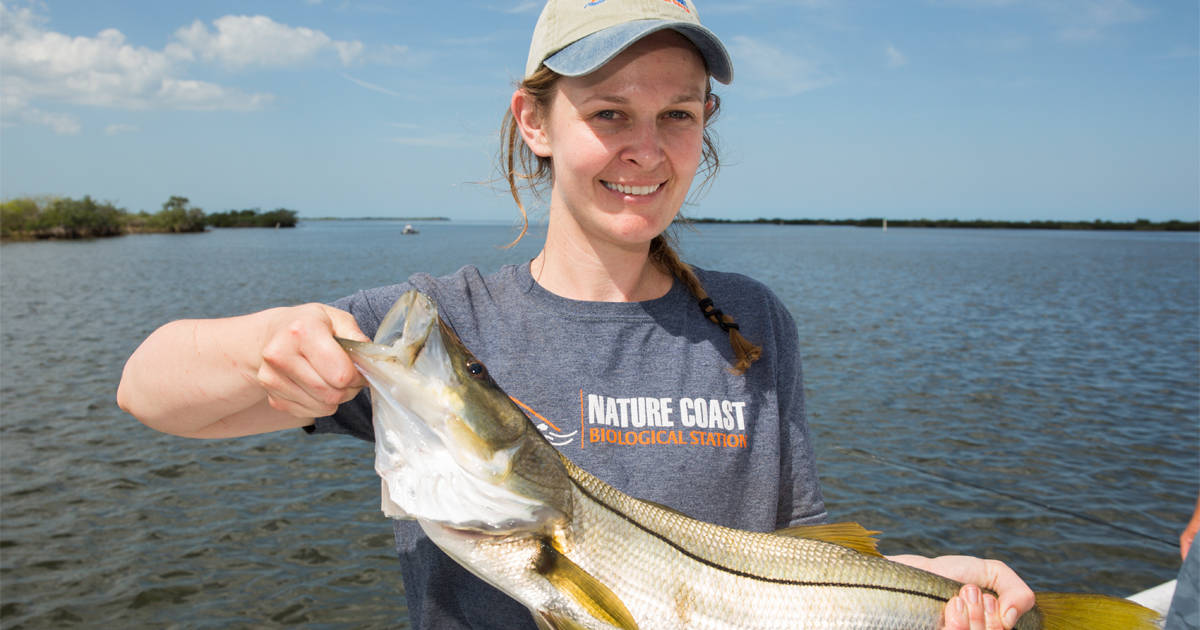
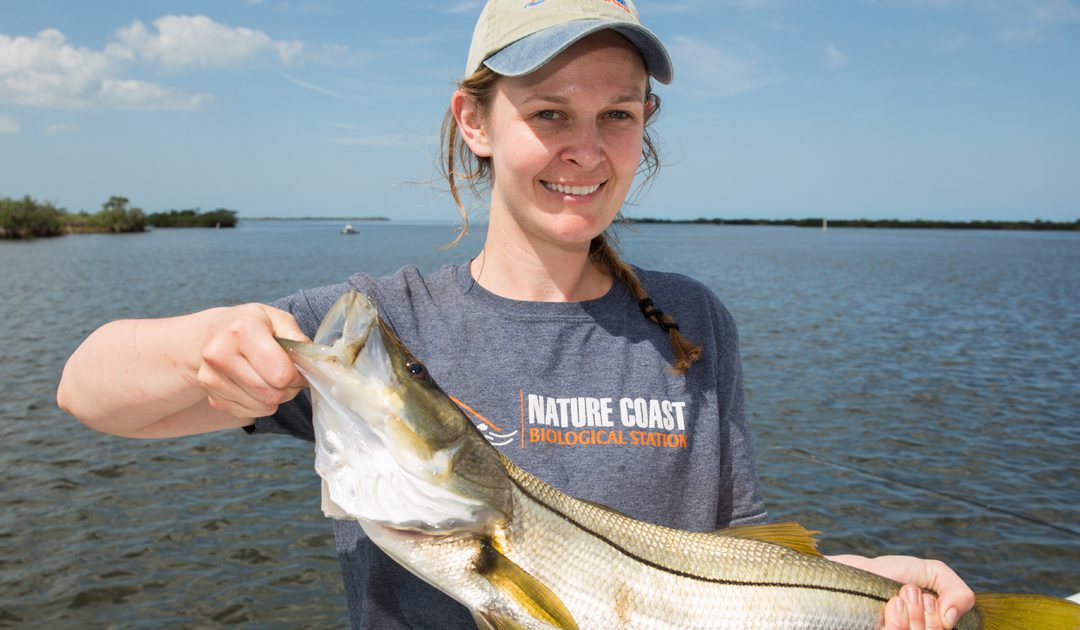
This snook was captured near Cedar Key. These tropical fish are becoming more common in the northern Gulf of Mexico.
Photo: UF IFAS
This fish is extremely sensitive to cold water, not liking anything under 60° F. They frequent the same habitats as tarpon, mangroves and marshes. They are euryhaline (having a wide tolerance for salinity) and can be found in freshwater rivers and springs. Actually, near river mouths is a place they frequent. The younger fish are more often found within the estuaries and adults have been found in the Gulf of Mexico. Again, this is a more tropical fish with records in Florida north of Tampa being rare. In the western Gulf the story is the same, almost all records are south of Galveston, Texas. Until recently…
Hoese and Moore1 cite a paper by Baughman (1943) that indicated the range of the fish had actually moved further south. One reason given was the loss of the much-needed salt marsh and mangrove habitats from human development. But in recent years there have more reports north of Tampa. Purtlebaugh (et al.)2 published a paper in 2020 indicating an increase in snook captured in the Cedar Key area of the Big Bend beginning in 2007. At first records only included adults, and the thought was these were “wayward” drifters in the region. But by 2018 they were capturing fish in all size classes and there was evidence of breeding going in the area. The range of the fish seemed to be moving north. The study suggests they still need warm water locations to over winter, and, like the manatees, springs seem to be working fine. But another piece of the explanation has been the reduction of hard freezes during winter in this part of the Gulf. Climate change may be playing a role here as well.
There seems to be other tropical species dispersing northward in a process some call “tropicalization” including the mangroves. There have been anecdotal reports of snook near Apalachicola where mangroves are becoming more common, and I know of two that were caught in Mobile Bay. There are mangroves growing on the Mississippi barrier islands as well. While explaining this during a presentation I was doing for a local group, a gentleman showed me a photo of a snook on his phone. I asked if he caught it in the Pensacola area. He replied yes. When I asked where, he just smiled… 😊 He was not going to share that. Cool.
There is no evidence that snook have established breeding populations are in our waters. Especially after this winter with multiple days with temperatures in the 30s, it is unlikely snook would be found here. But it is still interesting, and we encourage anyone who does catch one, to report it to us.
References
1 Hoese, H.D., Moore, R.H. 1977. Fishes of the Gulf of Mexico; Texas, Louisiana, and Adjacent Waters. Texas A&M Press. College Station Tx. Pp 327.
2 Purtlebaugh CH, Martin CW, Allen MS (2020) Poleward expansion of common snook Centropomus undecimalis in the northeastern Gulf of Mexico and future research needs. PLoS ONE 15(6): e0234083. https://doi.org/10.1371/journal.pone.0234083.
by Rick O'Connor | Mar 4, 2022
Nestled on the shore of the Choctawhatchee Bay across from Destin in Okaloosa County you will find 4-H Camp Timpoochee. Its private facilities, open spaces, waterfront view, and beautiful sunsets allow campers, students, and guests to play, learn, and work in a safe and relaxing environment. During a stay at Camp Timpoochee, you will experience memorable camp activities in a beautiful environment that will bring you back year after year. Camp Timpoochee provides modern conveniences, within the traditional camp setting, to combine a relaxed camp atmosphere with today’s camping needs.
If you have a child aged 6-16, you might want to consider sending them on a summer adventure at 4-H Camp Timpoochee located in Niceville, Florida. This camp allows campers first-hand experience with Florida’s marine and coastal environment above and below the waterline. Programs are designed to bring science to life in this living laboratory with the forest and bay providing classrooms for hands-on learning. Participants have an opportunity to learn while seining, cast netting, fishing, snorkeling, kayaking, going on a nature hike, or shooting archery.
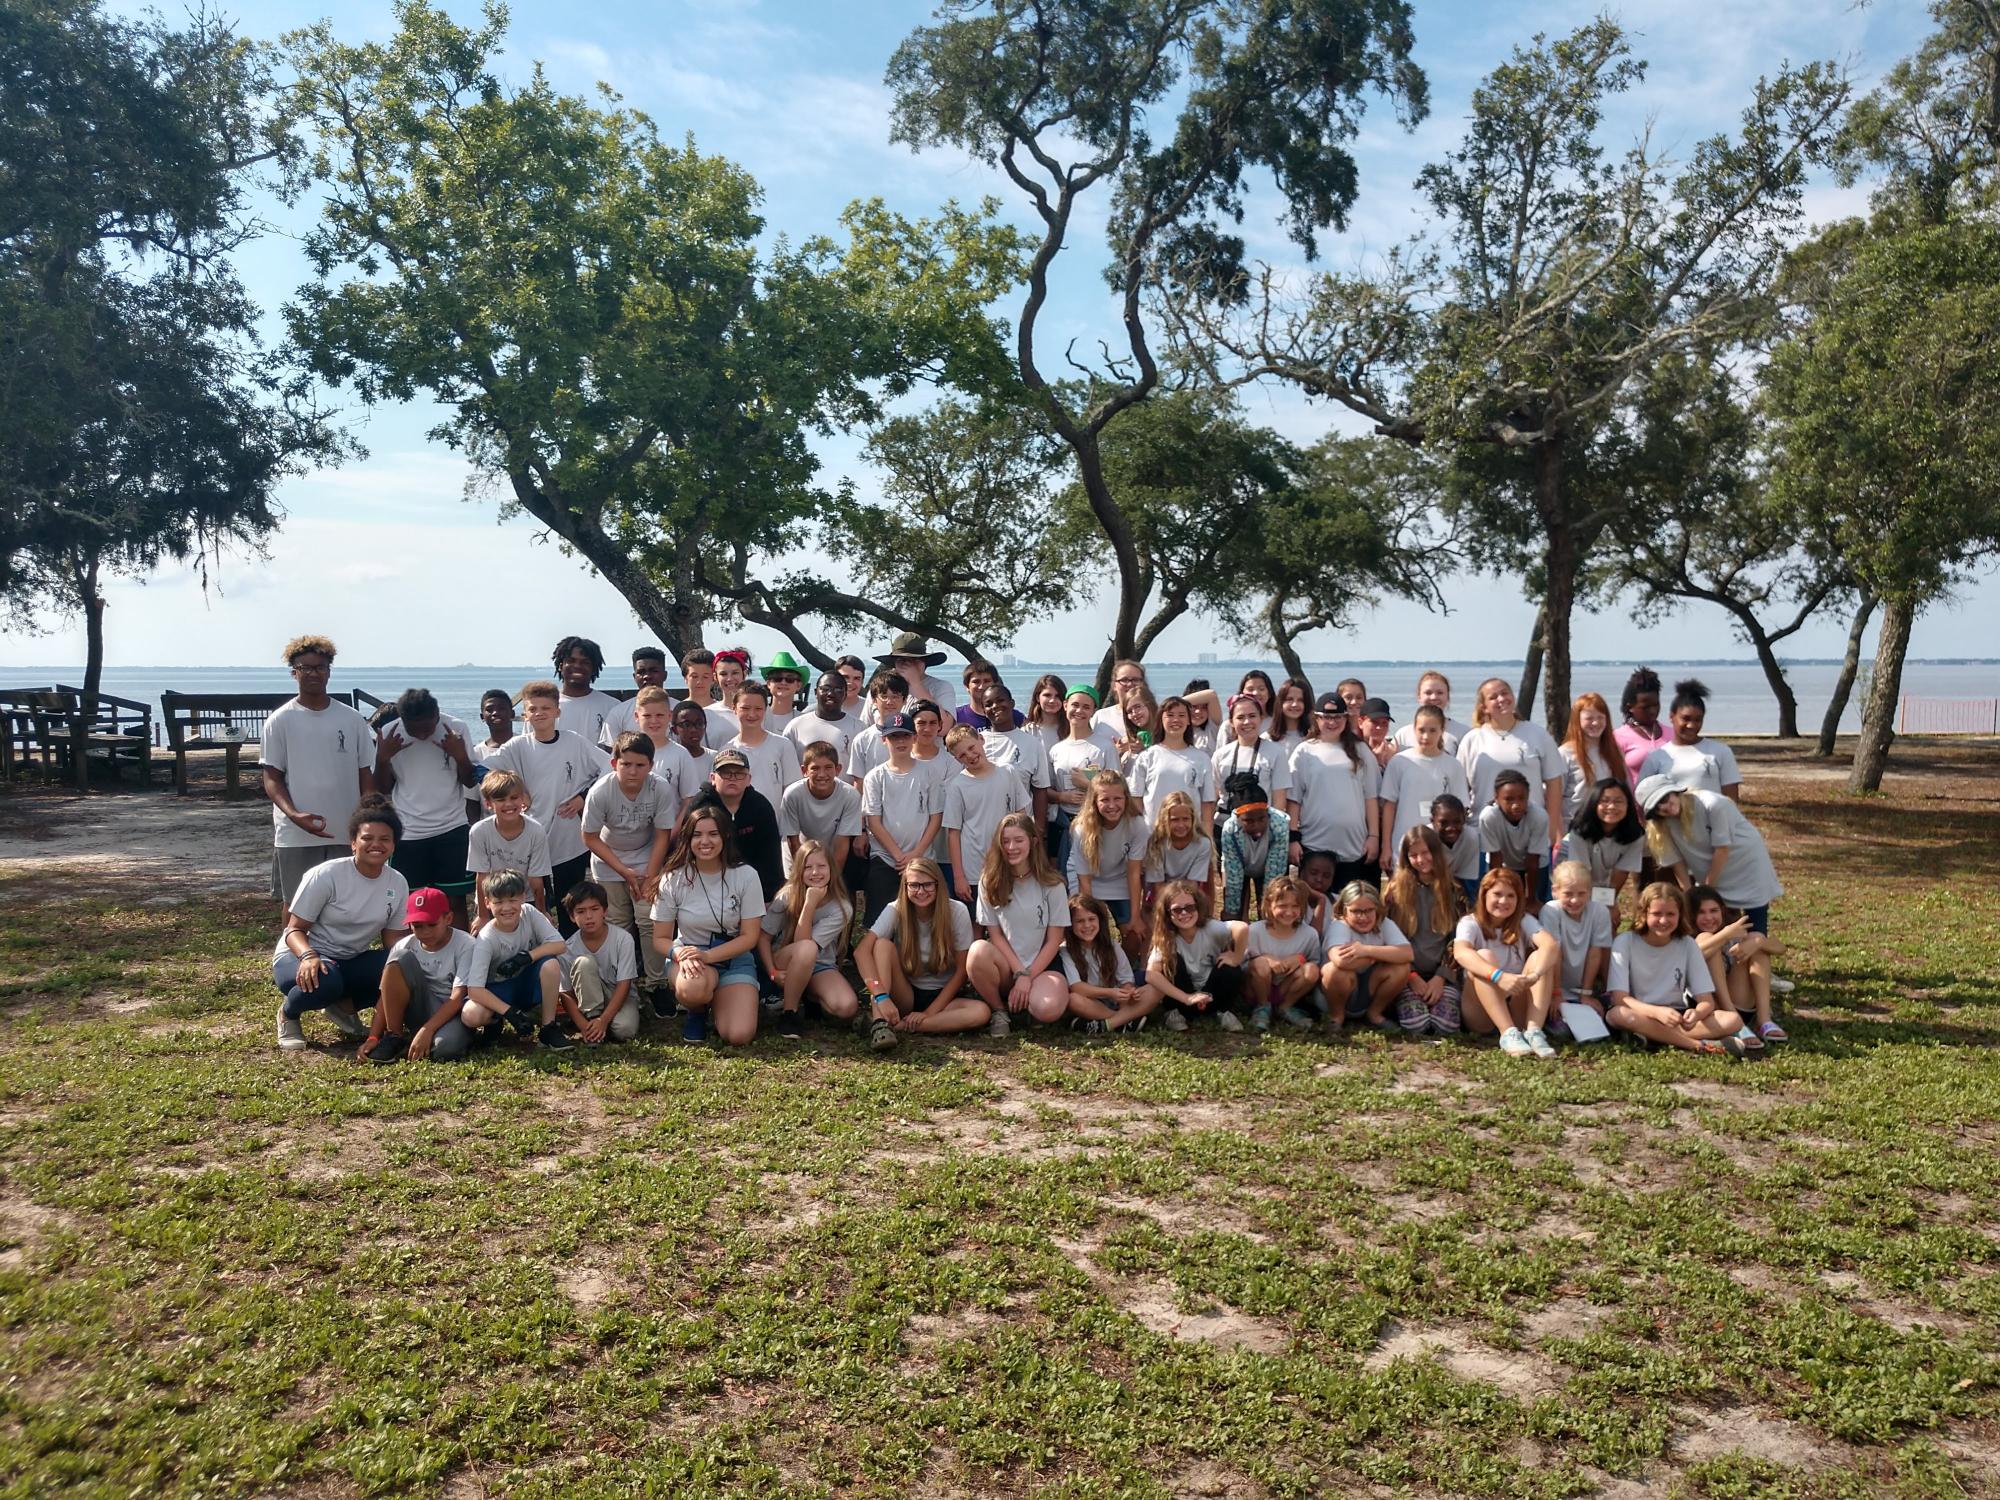
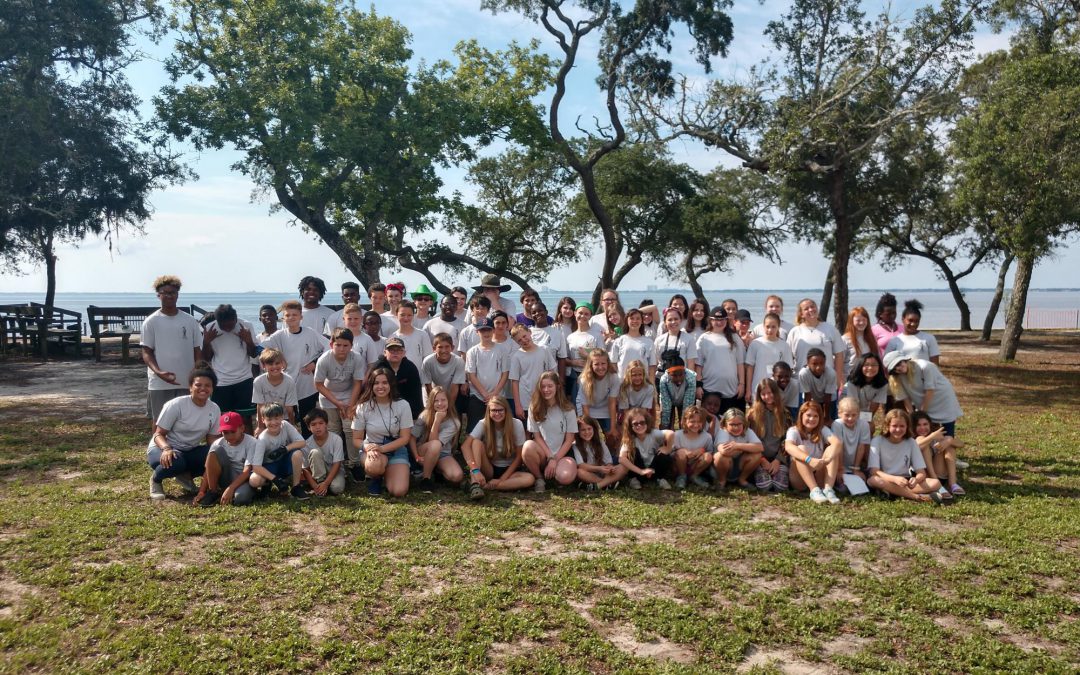
These are Happy Campers!
Photo: Brian Estevez
4-H summer camping programs provide opportunities for youth to sense of safety and security within a new environment away from home. It can provide that first experience being away from family in a residential setting. Youth are building their independence by having cabin responsibilities, getting to and from scheduled events on time, and gaining exposure to working together as a team. Camp life provides some early opportunities for children to learn the concept of generosity. Helping others in need, whether it is a forgotten item, simply sharing your free time with someone new, or demonstrating care and concern to someone who is feeling left out are all character-building skills that are part of the camp learning environment.
Established in 1926, 4-H Camp Timpoochee is the oldest continually operating 4-H camp in Florida. It provides the perfect outdoor living classroom. With more than a third of a mile of shoreline, it has become the perfect escape from the hustle of the outside world offering a place to disconnect from technology and reconnect with people. Serving more than 800 campers each summer, 4-H Camp Timpoochee provides multiple opportunities for youth to experience new adventures, step outside their box and make life-long friends and memories.
Open year round, 4-H Camp Timpoochee is more than just a summer camp. It offers opportunities for rental groups to enjoy its tranquil and multi-purpose facility through retreats, weddings, reunions and more! Offering lodging spaces, meal service, and meeting spaces, it has quickly become a unique location for various youth and adult organizations far and wide to enjoy.
So, if you want your child to get outdoors and leave electronics behind, consider sending him/her to 4-H Camp Timpoochee to learn about the great outdoors and Florida marine life. 4-H is one of the nation’s most diverse organizations and includes people from all economic, racial, social, political, and geographic categories. There are no barriers to participation by any young person. Participants are given the opportunity to engage in activities that hold their personal interest, while being guided by adult volunteers.
For more information on 4-H Camp Timpoochee and their summer program for 2022, please visit https://florida4h.ifas.ufl.edu/camps/camp-timpoochee/summer-camps/.
by Rick O'Connor | Mar 4, 2022
During this week we have read about what an invasive species is, how they got here, which ones have been here awhile, which are new potential threats, and why we should even care about this. All important things to know when you are trying to understand invasive species. But what can you do about it? Is there anything that can be done from your side?
Yes… there is.
The first step in helping to manage invasive species is to learn which plants and animals in your landscape are invasive. Many of the animals are easy, but the plants not so much. I have already heard from a few of you about Mimosa – like me, we had no idea it was on the list. But we should know which plants are and are not. How do you learn this?

Unfortunately, Six Rivers CISMA’s new website is not live yet. It should be by April 1, 2022, and when it is there will be information for you there. Another way is to check EDDMapS (www.EDDMapS.org). You can search the distribution map at the tool bar, type in the name of the species you have a question about and see if there are records. If it is, this does not mean it is invasive in Florida, just that it is invasive somewhere, but it is a start. If it is a plant (and most have questions about plants more than animals) you can search the University of Florida IFAS Assessment (https://assessment.ifas.ufl.edu/). This database will give you the status of the plant in Florida. However, you will need to know the scientific name of the plant. You can find this by googling the common name and finding it that way. Of course, you can always contact your county extension office.
Here is one for the SCUBA divers out there. I met with a couple of experts a year ago or so to discuss a list of 20 potential nonnative fish threats to the Florida Keys. We discussed which of these could become threats in the northern Gulf, could tolerate our climate. It was decided that we should tell divers if they see any fish that looks out of place, never been here before sort of thing, get a photo and contact us at the extension office. We will go from there.

Survey your yard
The second step is to conduct a survey of your yard or business. You probably know your yard already, but most have crews handle the landscaping for their businesses. You can conduct the search for plants but let your landscaping crew know your interest in any unusual animals they may see. You can also participate in community surveys with the county extension office. As COVID restrictions begin to lift, we will be conducting more of these in public areas in the coming months. Check our website calendar.
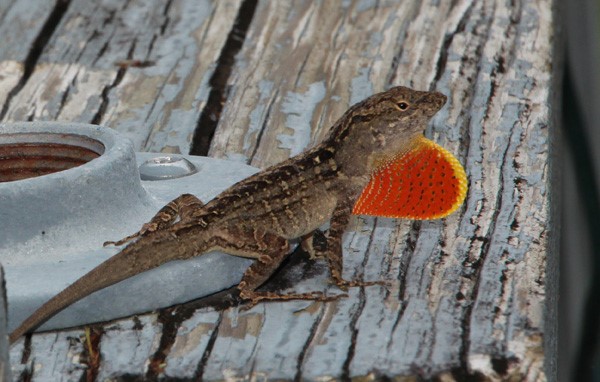
Be aware of what you are buying and bringing home this spring during gardening time. Not just the plant that you are buying, but who might be hitchhiking on it. Many of the ornamental plants people purchase are grown in large nurseries in central and south Florida. We believe this is how the Brown Anole, and now, the Cuban Treefrog are getting here. Slugs, lizards, frogs, all sorts of creatures can hitchhike on your plants. Just give it a good look over and if you think you have a potential invasive, call us.
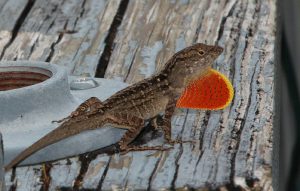
Cuban Anole. Photo credit: Dr. Steve A. Johnson, University of Florida
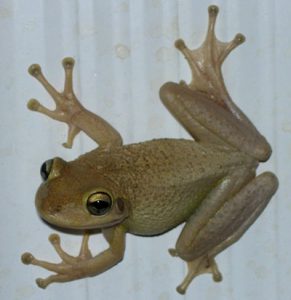
Photo by: Dr. Steve Johnson
The third step is to report them. As you saw in the numbers, and I did not post the Dirty Dozen numbers, but all of them are under reported. Having the public report these to EDDMapS gives managers a better idea of the extent of the problem. Note: You are not allowed to report an invasive species on private property without their permission, please get this first.
How do you report to EDDMapS?
There are two options.
One, go to their website (www.EDDMapS.org). You will see “report a sighting” on their tool bar. Report here. It will ask for a password, so you will need to set up an account. It will ask for area covered; estimating is fine. It will ask for Latitude and Longitude, most phones can give you this. Note: input longitude as a negative number or it will post the location in the eastern hemisphere. It will want a photograph so that it can be verified. This is important. Many are nervous reporting because they are not sure they have identified it correctly. No worries. All records sent in are verified before they are posted. A good photograph will allow the verifiers to do this. Send the record, if they believe it is incorrect, they will not post it.
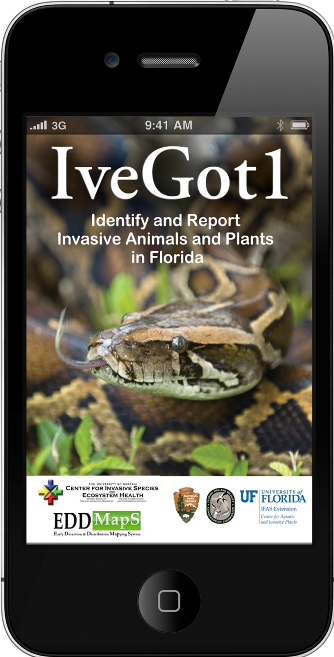
The second option is to use the IveGotOne app. This app handles a lot of the needs for EDDMaps. You see the plant, aim the phone, take the picture, and tell it the area covered, send. Everything else is taken care of. REMEMBER, you must get permission to do this on private property. You can get this app from the EDDMapS website or your favorite app store.
The fourth step is to remove it. This is the hard part.
Hard in the sense that most can remove small weeds and vines and are happy to do so. It is harder when there is a large infestation or if it is an animal – it is not easy to euthanize an animal, for anyone. How do we handle those harder ones?
With plants, contact us at the extension office – or visit the Six Rivers CISMA website when it is live. There has been a lot of research conducted on different methods of removal that will be effective and little impact on the environment. Many do not want to use herbicides, and we get that, but in some cases that may be the only option. So, which herbicides are the safest to use and in what concentrations? Again, give us a call. Interestingly, I recently heard from a local contractor who removes aquatic plants from ponds. He said he could do the same for invasive species. We hope to find a lot of such contractors who might be able to help with large problems that you cannot do yourself. Stay tuned.
With animals it is even harder. Even though there are humane ways to do this, most people cannot just put animals to sleep. Most county animal control units do not deal with invasive species. Instead, you would call the Florida Fish and Wildlife Conservation Commission. They have a number you can call Monday – Friday during normal business hours – (888) 483-4681. If it is after hours, or on the weekend, call (888) 404-FWCC (3922). Either FWC, or a licensed contractor, will come to deal with it. I will let you know they are probably not coming for the Brown Anoles so many have in their yards at the moment. There are just too many of them. Note: it is illegal to transport an invasive species in Florida. If you have a problem please call, do not bring it in.
If you feel you could euthanize an invasive animal first make sure on the identification. Get a good photo and send to your county extension office. If it is, your extension office can give you information on how to humanely euthanize the animal.
Note that there is nothing illegal about having invasive species in your yard. You will not be cited for having such. It is just many do want to remove them.
We hope you have learned a lot this week about invasive species. If you have, email me at roc1@ufl.edu and let me know. And if you decide to report or remove a species, I would like to know this as well.
Hope all is well with everyone.