by Rick O'Connor | Feb 24, 2022
EDRR Invasive Species
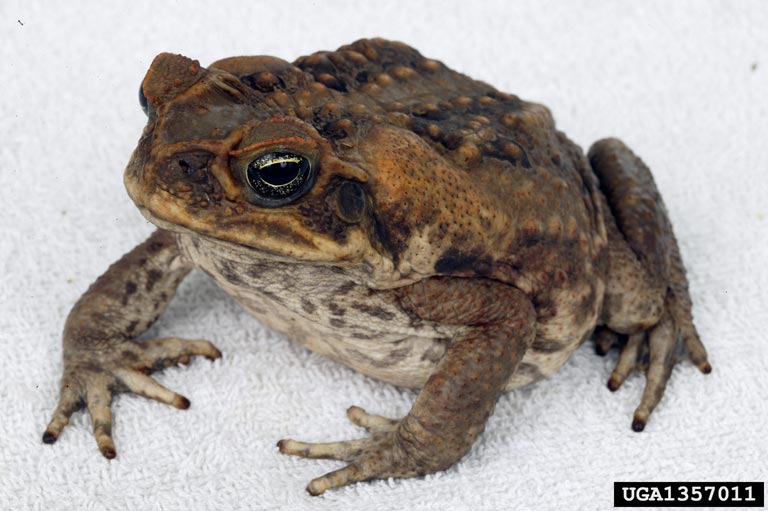
Cane Toad (Rhinella marina)
a.k.a Bufo toad, Marine toad
The Cane Toad
Photo: University of Georgia
Define Invasive Species: must have ALL of the following –
- Is non-native to the area, in our case northwest Florida
- Introduced by humans, whether intentional or accidental
- Causing either an environmental or economic problem, possibly both
Define EDRR Species: Early Detection Rapid Response. These are species that are either –
- Not currently in the area, in our case the Six Rivers CISMA, but a potential threat
- In the area but in small numbers and could be eradicated
Native Range:
The cane toad is native to central and south America.
Introduction:
Cane toads were intentionally released into Florida in the 1930s as a biological control for a beetle that was consuming the economically important sugar cane crop. It is believed that the initial released population did not survive but additional released toads in the 1950s did.
EDDMapS currently list 1,102 records of this toad. All but five are reported from Orlando south. Three were reported in north Florida – one in the Gainesville area, one in the Villages, and one in Deltona area. Two have been reported in the Florida panhandle. A small population existed in Bay County for a period and one report came from Okaloosa County, which is the only report within the Six Rivers CISMA. This toad is still sold in pet stores, and it is most likely these were escaped pets.
Description:
This toad is much larger than our native toads. Florida’s native toads do not reach lengths greater than 4 inches, cane toads can reach 6 inches and possibly up to 9 inches. The are reddish-brown in color and have very large parotid glands (poison glands) on their shoulders. Native toad parotoid glands are typically oval in shape, the cane toads are triangular. The cane toad also possesses a ridged crest over the eye that our native toads lack.
Even in their native range, cane toads prefer human habitations and are often found around homes, gardens, schools, and in agriculture fields.
Issues and Impacts:
There are two primary concerns with this toad. (1) their voracious appetite, and (b) their toxicity to pets. Cane toads will feed on native frogs, lizards, snakes, small mammals, and anything else they can get into their mouths. In areas where cane toads are common, declines of the native southern toads have been reported. The poison secreted by this toad is highly toxic to pets. Though in most cases there is a lot of foaming and drool at the mouth, dogs have had seizures and have gone into cardiac arrest, even dying. The eggs and tadpoles of this toad are also toxic. Eggs laid in landscaped ponds typically kill the fish that inhabit them. The toxin is also highly irritable to humans. Wiping on the face or open cuts can lead to skin irritations and everyone should avoid wiping their eyes. It is recommended to handle these toads with gloves.
Management:
Hand capturing, using gloves, and humanely euthanizing cane toads found in your yard is the primary method of control. It is important to correctly identify the toad before euthanizing it. If you have questions, you can contact your county extension office.
To humanely euthanize wipe, or spray, benzocaine or lidocaine on the lower belly. This will act as an anesthesia to numb the nervous system and put the animal to sleep. The toad can now be placed in a zip lock bag and placed in the freezer. If you do not have products with benzocaine or lidocaine (often found in products to help with toothache or sunburns) you can place the toad in a zip lock bag for a few hours in the refrigerator, then move to the freezer. It is recommended if cane toads are present in your neighborhood to remove outdoor pet food and water bowls. If you do not wish to euthanize the toad you can contact a wildlife control business.
Please report any sighting to www.EDDMapS.org. There are biologists who verify the photograph you send. It is important that we keep track of this EDRR species.
For more information on this EDRR species, contact your local extension office.
References
Johnson, S. 2020. Florida’s Frogs and Toads. University of Florida Department of Wildlife Ecology. https://ufwildlife.ifas.ufl.edu/frogs/canetoad.shtml.
Wilson, A., Johnson, S. 2021. The Cane or “Bufo” Toad (Rhinella marina) in Florida. Electronic Data Information System publication #WEC387. https://edis.ifas.ufl.edu/publication/UW432.
Early Detection and Distribution Mapping System (EDDMapS)
https://www.eddmaps.org/
Six Rivers CISMA
https://www.floridainvasives.org/sixrivers/
by Rick O'Connor | Feb 18, 2022
Six Rivers “Dirty Dozen” Invasive Species
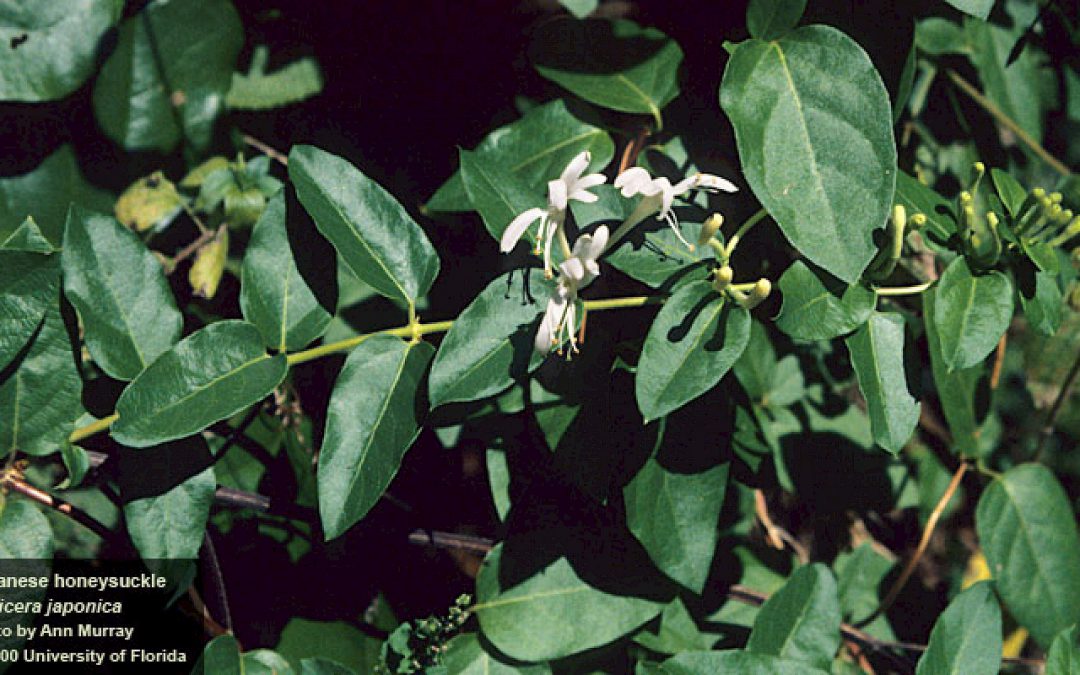
Japanese Honeysuckle (Lonicera japonica)
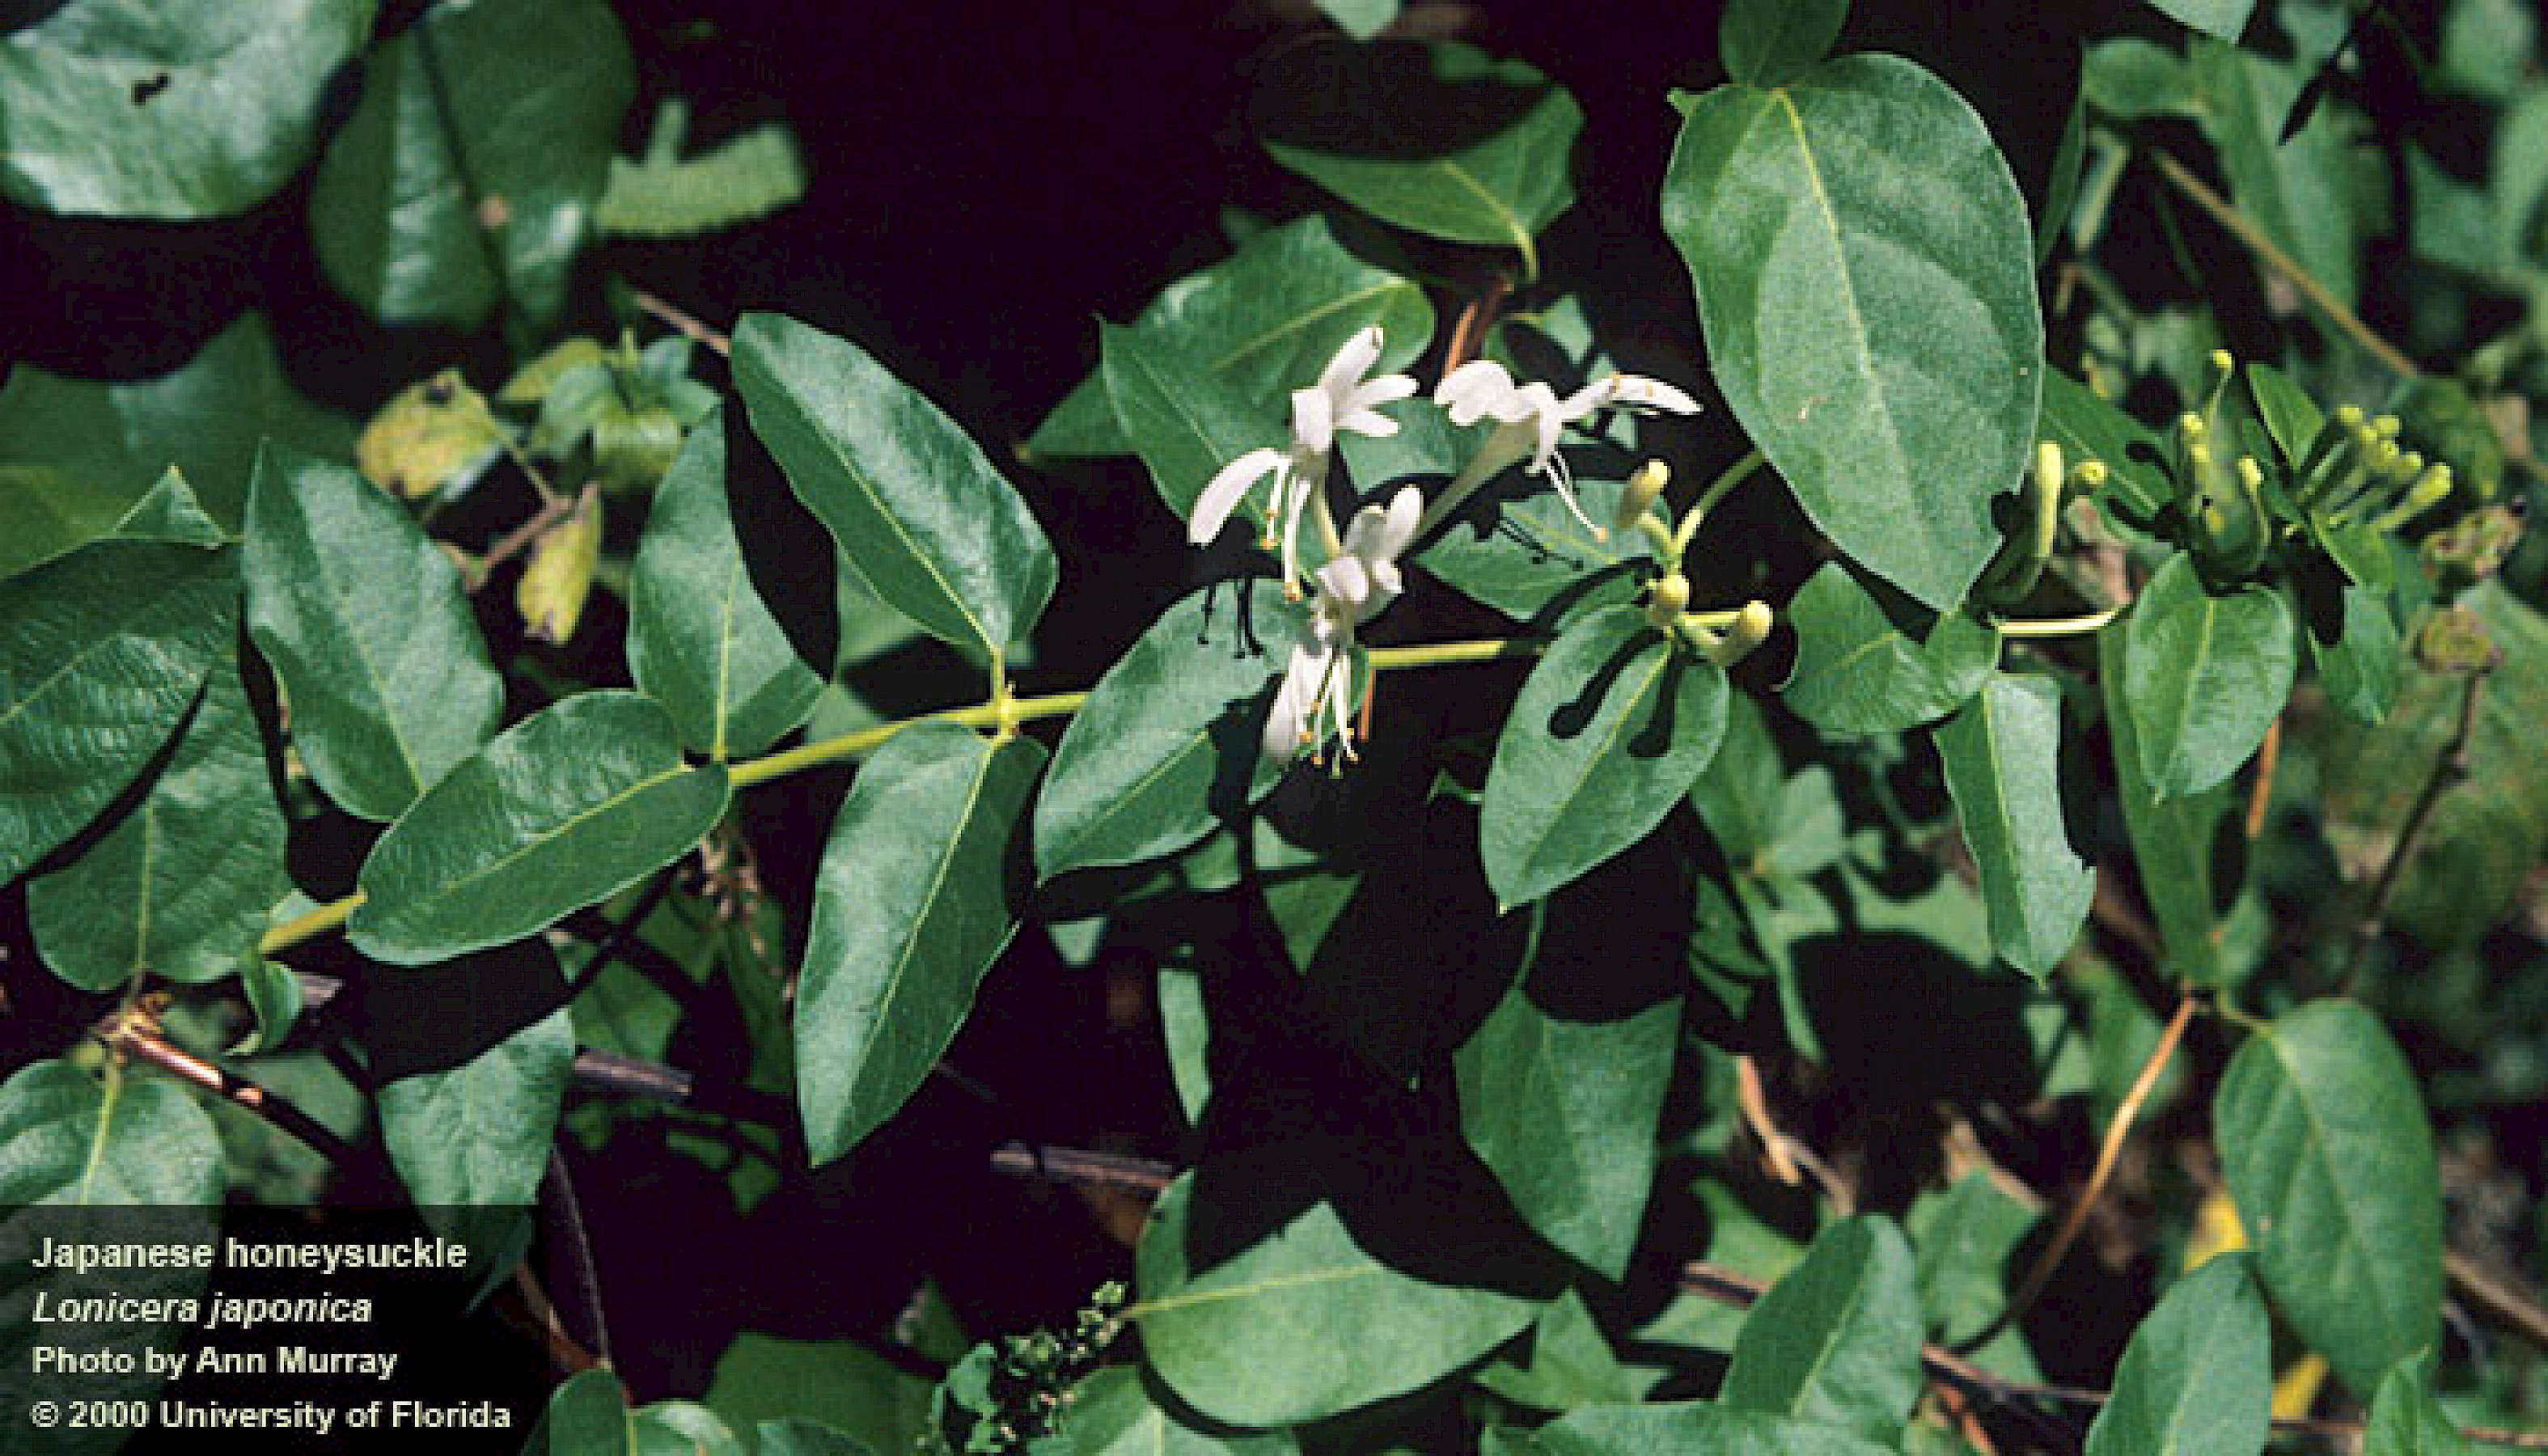
Japanese Honeysuckle
Photo: University of Florida
Define Invasive Species: must have all of the following –
- Is non-native to the area, in our case northwest Florida
- Introduced by humans, whether intentional or accidental
- Causing either an environmental or economic problem, possibly both
Define “Dirty Dozen” Species:
These are species that are well established within the CISMA and are considered, by members of the CISMA, to be one of the top 12 worst problems in our area.
Native Range:
Japanese honeysuckle is native to China, Japan, and Korea.
Introduction:
Japanese honeysuckle was first introduced to Florida in 1875 for agricultural and gardening purposes. It was introduced as a forage plant in the agriculture industry and was very popular as a landscape plant due to its beautiful showy flowers. Its invasive nature was quickly discovered and is now listed as a Category I invasive plant and a Florida noxious weed.
EDDMapS currently has 115,101 records of this plant across the country. Most are east of the Mississippi River but cover the entire east coast, including New England. There are records in the southwestern part of the U.S. In Florida, most of the records are in the northern part of the state, particularly in the panhandle. There are few records south of Orlando. Within the Florida panhandle there are 1,558 records and 1,209 within the Six Rivers CISMA. As with most species, this is probably underreported.
Description:
Japanese honeysuckle is a woody vine that produces beautiful white flowers. These flowers have multiple sepals, and the stamens which extend outward resembling “whiskers”. The leaves are about 1-3 inches, ovate is shape, and opposite on the stem. The small fruits are green and hard when immature, black and soft when older.
Issues and Impacts:
This is an aggressive growing vine that can quickly take over the landscape. It can cover small shrubs and trees killing them, block sunlight so germination of other plants is impossible, and outcompete native plants for needed sunlight decreasing the biodiversity within the area.
Management:
Removing by hand or shovel is effective on small patches. Mowing small patches has found to reduce seed spread but the parent plant may return with additional stems. Mechanical tillage can be effective but can enhance seed dispersal from the seed bank and is not always an option in some locations.
Chemical treatment with either glyphosate or triclopyr has been effective however, cut stump application is recommended. Foliar sprays that do not reach ALL leaves can induce resprouting.
There are no known biological controls at this time.
For more information on this Dirty Dozen species, contact your local extension office.
References
Japanese Honeysuckle. University of Florida IFAS Center for Aquatic and Invasive Plants
https://plants.ifas.ufl.edu/plant-directory/lonicera-japonica/.
Lonicera japonica. University of Florida IFAS Assessment. https://assessment.ifas.ufl.edu/assessments/lonicera-japonica/.
Early Detection and Distribution Mapping System (EDDMapS)
https://www.eddmaps.org/
Six Rivers CISMA
https://www.floridainvasives.org/sixrivers/
by Rick O'Connor | Feb 18, 2022
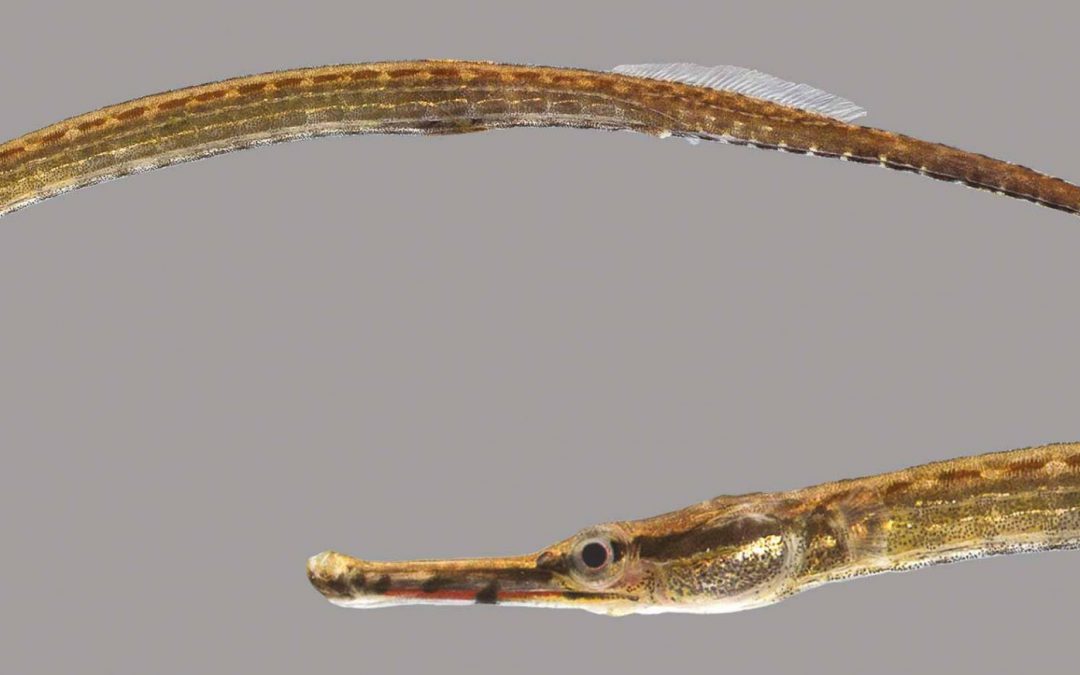
I recently posted an article about the seahorses of the Florida panhandle. It would be remiss of me if I did not include their close cousins the pipefish. Where seahorses are well known but hard to find, pipefish are easy to find but not well known.
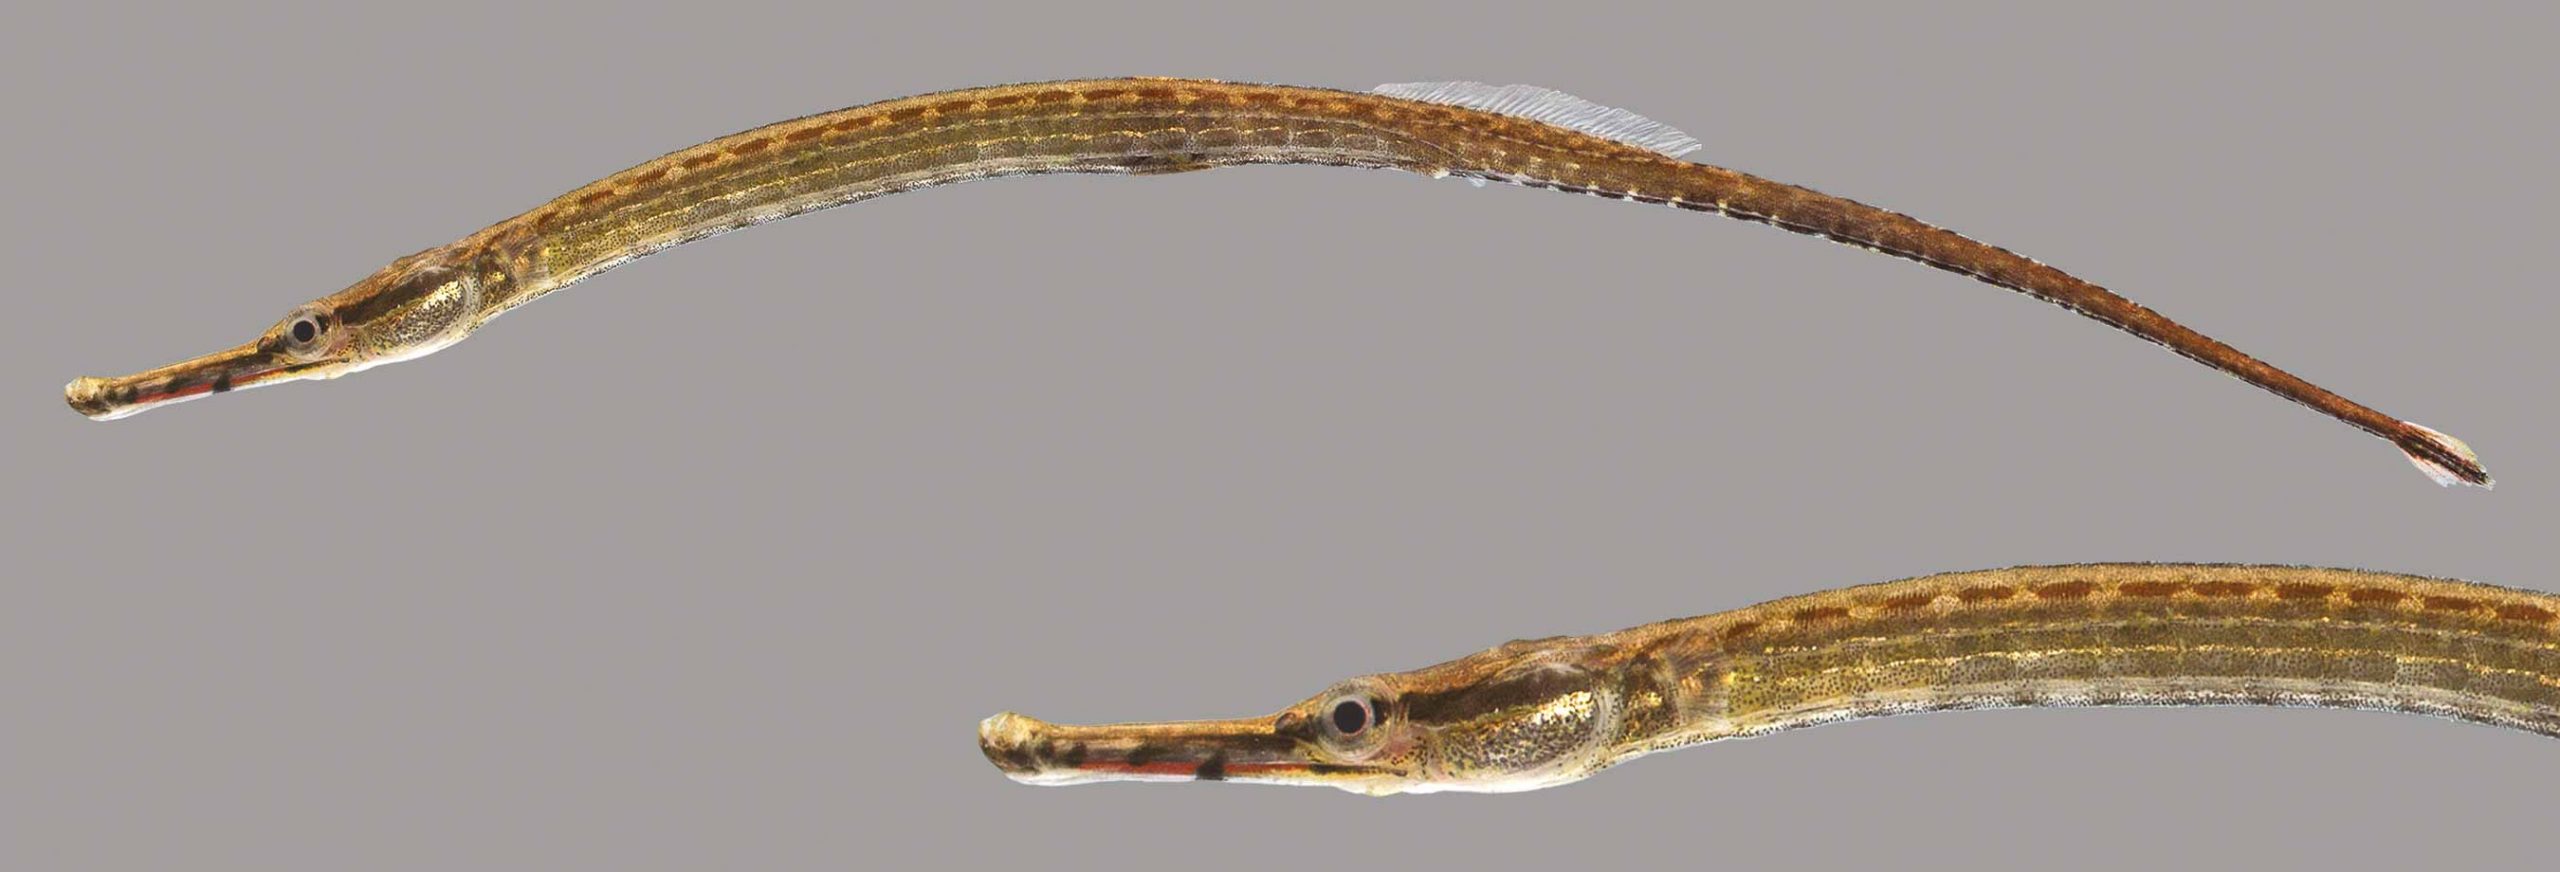
The seahorse-like pipefish.
Photo: University of Florida
Pipefish are in the same family as seahorses, Syngnathidae, and are basically elongated seahorses. Pulling seine nets in local grassbeds we often catch them. Students always ask what they are. “Are these needlefish?” is a frequent question. I reply “no, they are pipefish”. Which then comes “pikefish?”. To which I reply “No, PIPEfish… like P-I-P-E… – they are basically elongated seahorses”. And then there is always – “coool”. To which I reply “yes… very cool”.
Pipefish have the same body armor, body rings, and long tube snout of the seahorse. However, they lack the curled prehensile tail for a more elongated body, looking more a grass blade than their cousins. They actually have a caudal fin (the fin most call “fish tail”). Most range between 3-6 inches long but the chain pipefish can reach a length of 10 inches, this is the “big boy” of the group. Like seahorses, they hide in the grass using their tube-shaped mouths to suck in small planktonic food. Like the seahorses, the males’ possess a brood pouch to carry the fertilized eggs and give live birth (ovoviviparous).
The pipefish can quickly be divided into two groups – those with long snouts, and those with short – and this can be easily seen when captured in a net. After that identification gets a bit tricky, you have to count rays in the fins or rings on the body. It is sufficed to say, “it’s a pipefish” and leave it at that.
Those with long snouts include the Opossum, Chain, Dusky, and Sargassum pipefish.
The Opossum Pipefish (Microphis brachyurus) is about 3 inches long and was not reported from the northwestern Gulf of Mexico according to Hoese and Moore1. In the eastern Gulf, our way, it is considered rare but has been found in salt marshes, seagrasses, and in Sargassum mats drifting in from the Gulf. The Florida Museum of Natural History list this fish as a “marine invader”2. In 1991 NOAA listed it as a species of concern due to its decline across the region3. There are reports of this pipefish entering freshwater creeks within our estuaries.
The Chain Pipefish (Syngnathus louisianae) has a very long snout and is the “big boy” of the group reaching 10 inches in length. It is quite common along the panhandle and has one of the larger ranges of this group, found all along the Atlantic coast, throughout the Gulf of Mexico and in the Caribbean.
The Dusky Pipefish (Syngnathus floridae) is a long-snout, large pipefish reaching a length of eight inches. It prefers higher salinity than many pipefish and is found throughout the Gulf of Mexico and along the Atlantic seaboard often offshore.
The Sargassum Pipefish (Syngnathus pelagicus). This is a good scientific name for this fish (pelagicus) for it lives on the large mats of Sargassum weed that drifts across the oceans. Because of this it has a worldwide distribution. This longnose pipefish reaches the typical length of six inches. It lives as many other pipefish do hiding in the grass snapping up food when it comes close enough but it’s habitat is often drifting offshore and inshore sightings of this species are rare.
There are three species of “short-snout” pipefish.
The Fringed Pipefish (Anarchopterus crinigerus) is a smaller pipefish reaching only three inches. It seems to be absent in the western Gulf but is found along the Florida panhandle, the Gulf coast of peninsula Florida, and through the Caribbean to Brazil.
The Northern Pipefish (Syngnathus fuscus) reaches a length of six inches. It is very common along the Atlantic seaboard but Hoese and Moore1 report only four specimens from the Gulf of Mexico. This one would be considered very rare, and an expert should identify it if one thinks they have it.
The Gulf Pipefish (Syngnathus scovelli) is one of the more common pipefish collected in our waters. It is a short-snout species reaching the typical six inches but has these distinct bluish-gray bars that run vertically along the sides. It is found throughout the Gulf of Mexico and even into some freshwater habitats. The Florida Museum of Natural History also list this species as a marine invader4.
I am not sure how much seining you do along our waterways, but if you do any within the grassbeds you are sure to find one of these unique and interesting fish.
References
1 Hoese, H.D., Moore, R.H. 1977. Fishes of the Gulf of Mexico. Texas A&M Press, College Station TX. Pp. 327.
2 Opossum pipefish. Discover Fishes. Florida Museum of Natural History. https://www.floridamuseum.ufl.edu/discover-fish/florida-fishes-gallery/opossum-pipefish/.
3 Opossum Pipefish. Species of Concern. National Oceanic and Atmospheric Administration, National Marine Fisheries Service. https://www.nrc.gov/docs/ML1224/ML12240A312.pdf.
4 Gulf Pipefish. Discover Fishes. Florida Museum of Natural History. https://www.floridamuseum.ufl.edu/discover-fish/florida-fishes-gallery/gulf-pipefish/.
by Rick O'Connor | Feb 11, 2022
EDRR Invasive Species
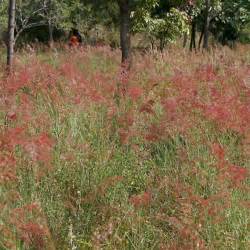
Natal grass (Melinis repens)
Natalgrass
Photo: University of Florida IFAS
Define Invasive Species: must have ALL of the following –
- Is non-native to the area, in our case northwest Florida
- Introduced by humans, whether intentional or accidental
- Causing either an environmental or economic problem, possibly both
Define EDRR Species: Early Detection Rapid Response. These are species that are either –
- Not currently in the area, in our case the Six Rivers CISMA, but a potential threat
- In the area but in small numbers and could be eradicated
Native Range:
South Africa
Introduction:
Intentionally introduced as a forage plant but lacks the nutritional value of other introduced forage plants.
EDDMapS currently list 3,923 records of this plant, all are across the southern United States from California to Florida. 3,591 reports are from Florida itself, with 53 of these in the Florida panhandle, and 31 of those within Six Rivers CISMA.
Description:
This reddish colored grass can cover large areas of open fields. The reddish color comes from the hair-like structures that are associated with the flowers and will become gray with age. The flowers themselves are a pink-purple in color and are produced from panicles (a cluster of small flowers) that are 4-8 inches long. The grass can reach a height of 40 inches and dispersal is by wind blown seeds.
Issues and Impacts:
It aggressively grows in open fields and displaces native grass species from these areas. Many of which are important to local ecology.
Management:
Hand removal of small patches can be effective, but the property owner should be aware of the ease of seed dispersal when doing this, it is recommended to remove prior to going to seed. It tends to quickly invade open areas of disturbance including the use of fire. Mowing does not provide control.
The herbicides glyphosate and imazapyr have shown to have good control but must be used prior to going to seed. Both herbicides are non-selective, and care must be taken not to treat native plants. Imazapyr has a longer soil life and replanting the area after treatment may not be effective for several months.
There are no known biological controls at this time.
If you are in the Florida panhandle area and believe you may have natal grass, please contact your county extension office to let them know as well as report the siting to www.EDDMapS.org. If you have questions on how to do this, your county extension office can help.
For more information on this EDRR species, contact your local extension office.
References
University of Florida IFAS Center for Aquatic and Invasive Plants. Natal Grass. https://plants.ifas.ufl.edu/plant-directory/melinis-repens/.
Early Detection and Distribution Mapping System (EDDMapS)
https://www.eddmaps.org/
Six Rivers CISMA
https://www.floridainvasives.org/sixrivers/
by Rick O'Connor | Feb 10, 2022
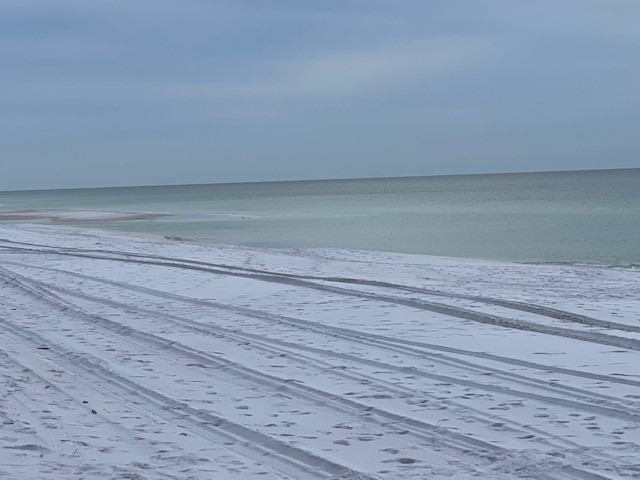
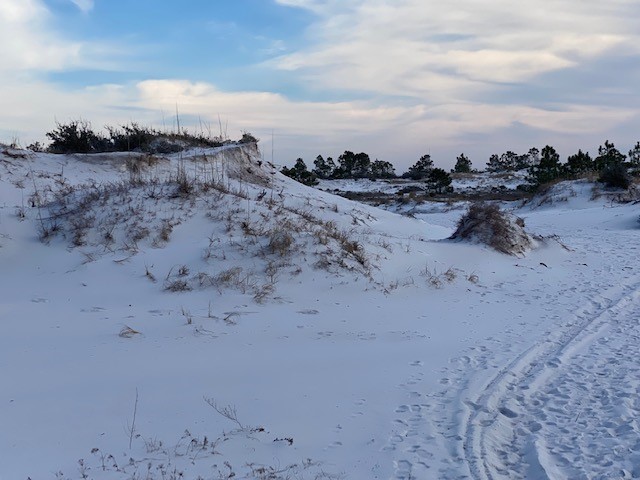
It is now mid-winter and much colder than our trip in January. During February’s hike the temperature was 44°F, compared to 62°F in January. It was overcast with a cold breeze from the northeast – again, colder. When conditions are like this I am not expecting to see much. If I did find something I would expect it to be one of our warm blood friends, mammals or birds, and even they would prefer a day with more sun and less breeze. But I came to see what was out roaming. So, a hike I made.
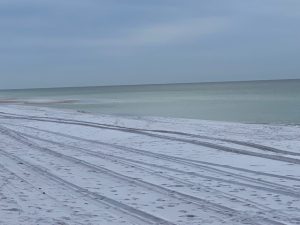
The Gulf front at Park East near Big Sabine.
This month I hiked the Big Sabine area east of Pensacola Beach. It began with a shore walk along the Gulf and then a transect across the different dune fields to the marshes and seagrasses along the Santa Rosa Sound.
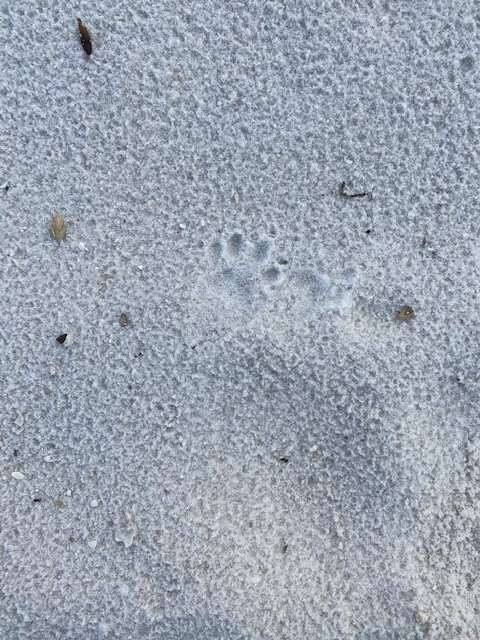
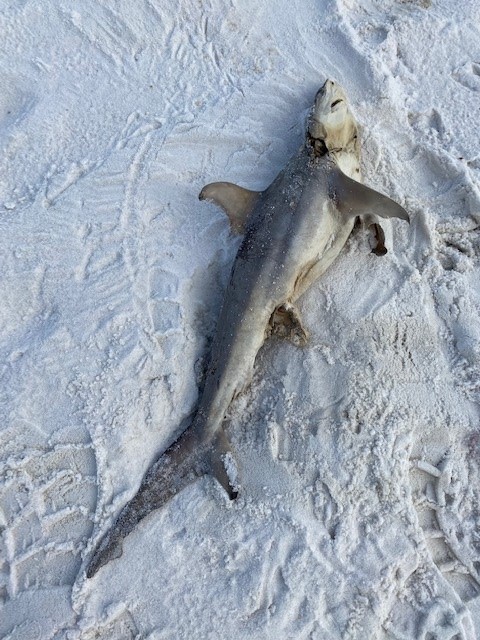
There was no one out today. You could see footprints in the sand, and it had that characteristic “squeak” sound of fresh sand or snow. The only wildlife I saw on the Gulf side was a group of pelicans sitting on very calm water, obviously enjoying the morning. However, you could see footprints of mammals that had come earlier. There are raccoons, armadillos, mice, coyotes, and occasional reports of otters on Santa Rosa Island. There were a lot of skunks on the island prior to Hurricane Ivan (2004), but I have not seen any since. There have been reports of bears on the island as well. I have never seen one, nor their tracks, so do not think they are frequent visitors. I did find a dead shark tossed up on the beach by a fisherman. Not sure if they were trying to catch it or not.
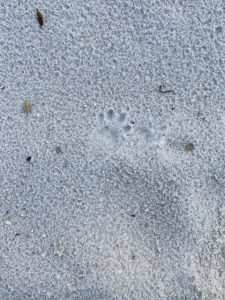
A variety of mammals are found on barrier islands. Most move at night and you know they are there only by their tracks.
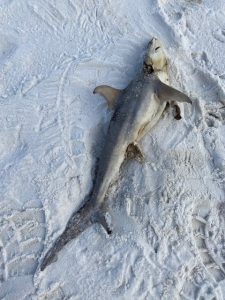
This small shark was found on the beach during the hike. I am not sure why they did not return it to the Gulf.
As I began my transect across the island I ventured into the secondary dune field, which during summer is extremely hot. This part of the island reminds me somewhat of a desert. Very dry, open, and at times very hot. Like the desert it comes alive more at night, but during winter you might see animal movement during the warm parts of the day. I did see mammalian tracks, which included humans and dogs.
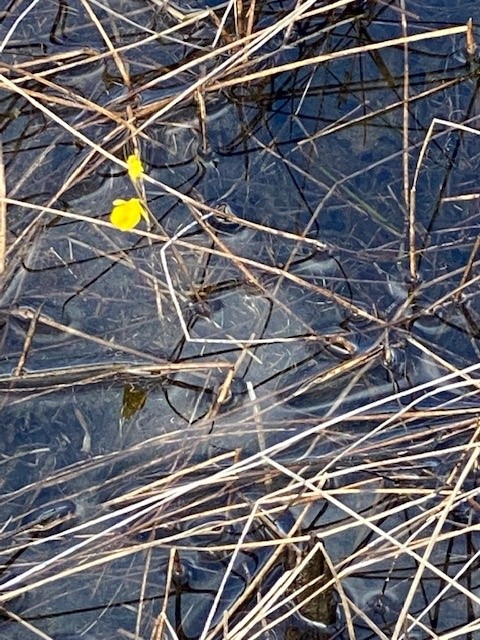
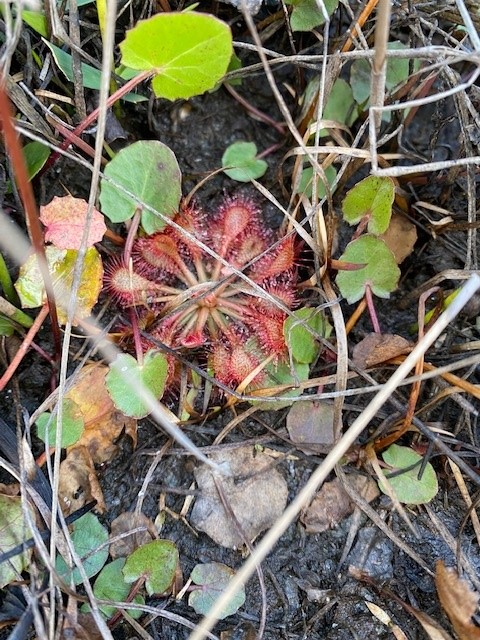
This dune field also holds ephemeral ponds which can harbor a variety of life during the warmer months. Today I only found one blooming yellow-bladder wort as well as other carnivorous plants along the bank such as sundews and ground pines.

Yellow bladder wort is one of the small carnivorous plants that live on our barrier islands.
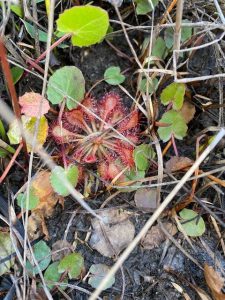
Sundews are another one of the small carnivorous plants found here.
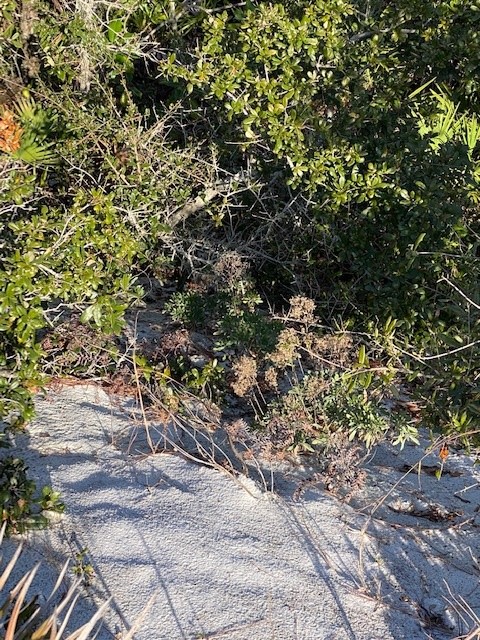
From the open dune field, you venture into the tertiary dunes and the maritime forest. Trees grow here but their growth is stunted due to the salt content in the air. None the less, pine and oak hammocks liter this dune area providing great hiding places for wildlife. Though we did not see any today, I am expecting to find some as the weather warms.
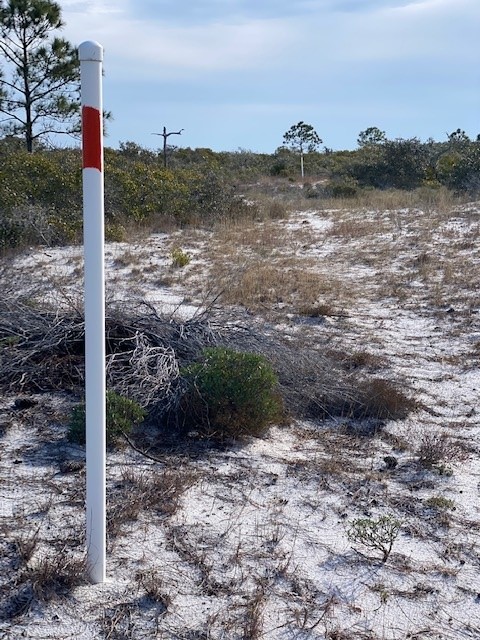
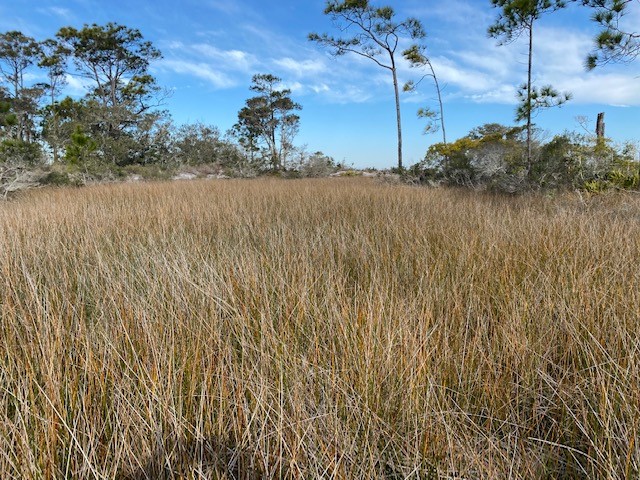
The backside of the island is where you will find the salt marsh. This brackish wetland harbors its own community of creatures, which were not visible today but will be in the spring. Between the tertiary dunes and the marsh runs a section of the Florida Trail. Hikers can walk this section and observe wildlife from both ecosystems.

The larger dunes of the tertiary dune field.
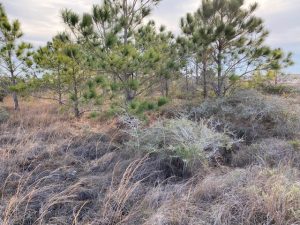
Tree hammocks are common in the tertiary dune fields and provide good places for wildlife.
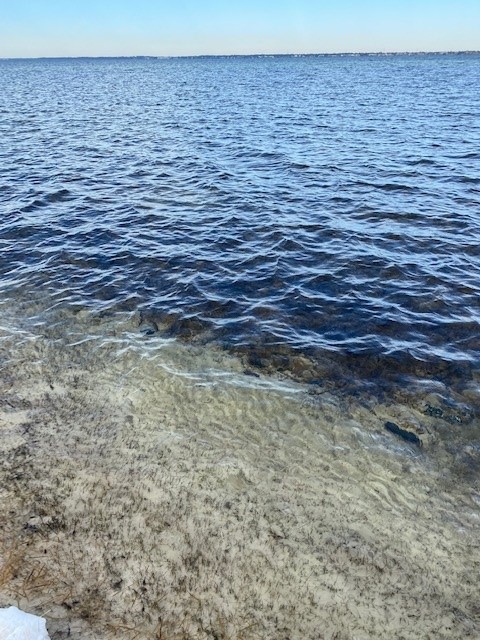
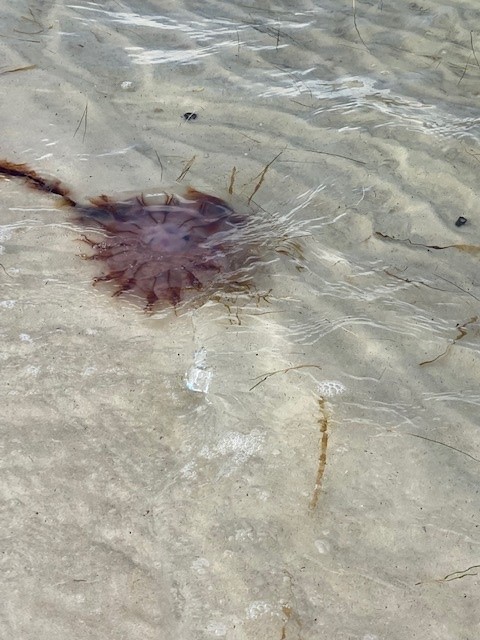
I eventually reached the Sound and the seagrass beds that exist there. Today, here was nothing really moving around, though I did find a dead jellyfish drifting in the waves. As the island wildlife tends to hideout the winter in burrows, the fish move to deeper water where it is warmer.

The backside of these large dunes drop quickly back to sea level.
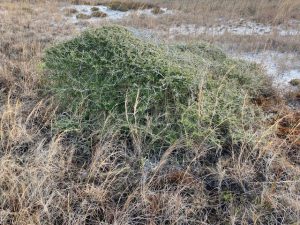
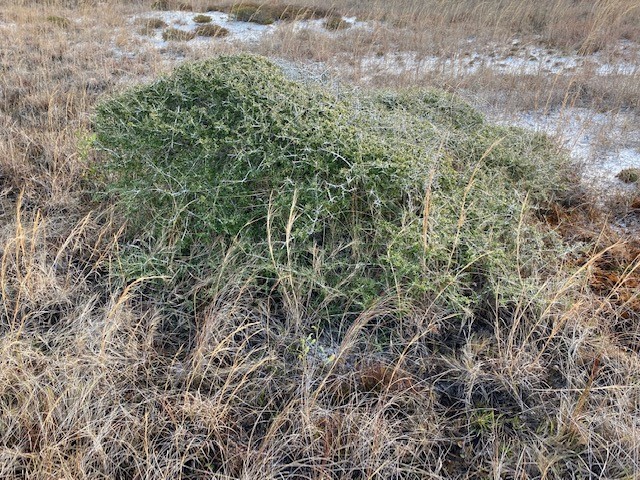
Many plants in the tertiary dunes exhibit “wind sculpting”. It appears someone has taken a brush and “brushed” the tree towards the Sound.
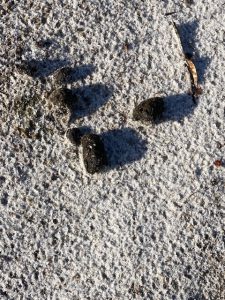
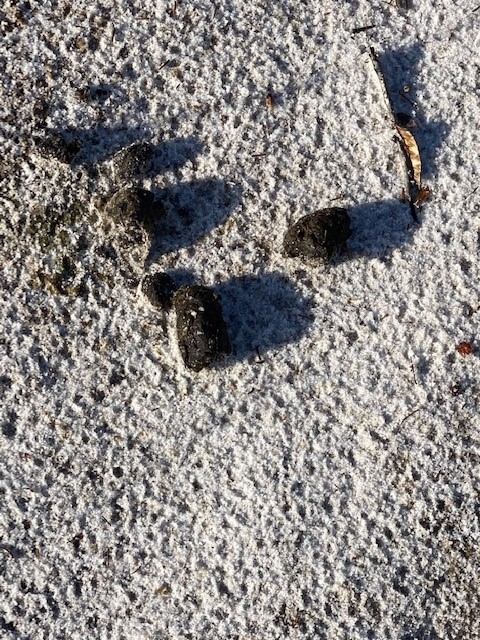
Scat is another sign used to identify mammal activity in the dunes.
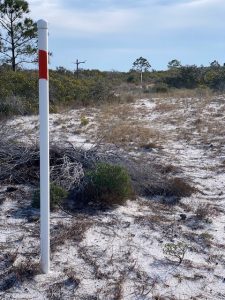
Portions of the Florida Trail cut through the tertiary dune field of Big Sabine.
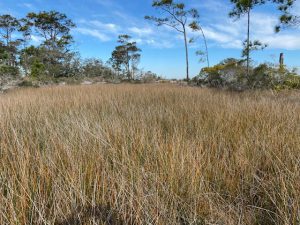
The salt marsh

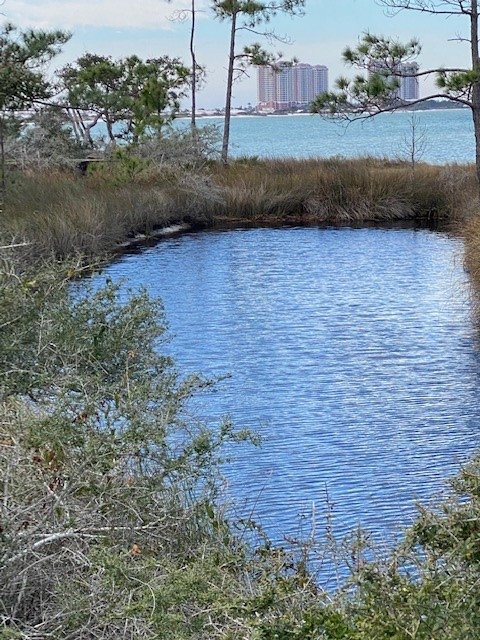
This holding pond is a remnant of an old fish hatchery from the late 1950s and is primarily freshwater.
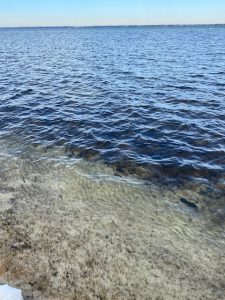
Seagrass meadows can be found in Santa Rosa Sound and harbor a variety of marine life.
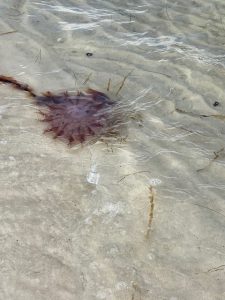
Jellyfish are common on both sides of the island. This one has washed ashore on Santa Rosa Sound.
There was little out today other than a few birds. We will see what late winter will expose next month.