Understanding Salinity in Northwest Florida’s Waters with a Family Activity
Dana Stephens, 4-H Agent
Salinity is the amount of total dissolved salts in water. This includes all salts not just sodium chloride, or table salt. Salinity is important in aquatic environments as many flora and fauna depend on salt and the level of dissolved salts in the water for survival. People interested in the composition of water frequently measure chemical and physical components of water. Salinity is one of the vital chemical components measured and often measured by a device determining how readily electrical conductance passes between two metal plates or electrodes. These units of electrical conductance, the estimate of total dissolved salts in water, is described in units of measurement of parts per thousand (PPT).
At the large scale, Earth processes, such as weathering of rocks, evaporation of ocean waters, and ice formation in the ocean, add salt to the aquatic environment. Earth processes, such as freshwater input from rivers, rain and snow precipitation, and ice melting, decrease the concentration of salt in the aquatic environment. Anthropogenic (human-induced) activities, such as urbanization or atmospheric deposition, can also contribute to changes in salinity.
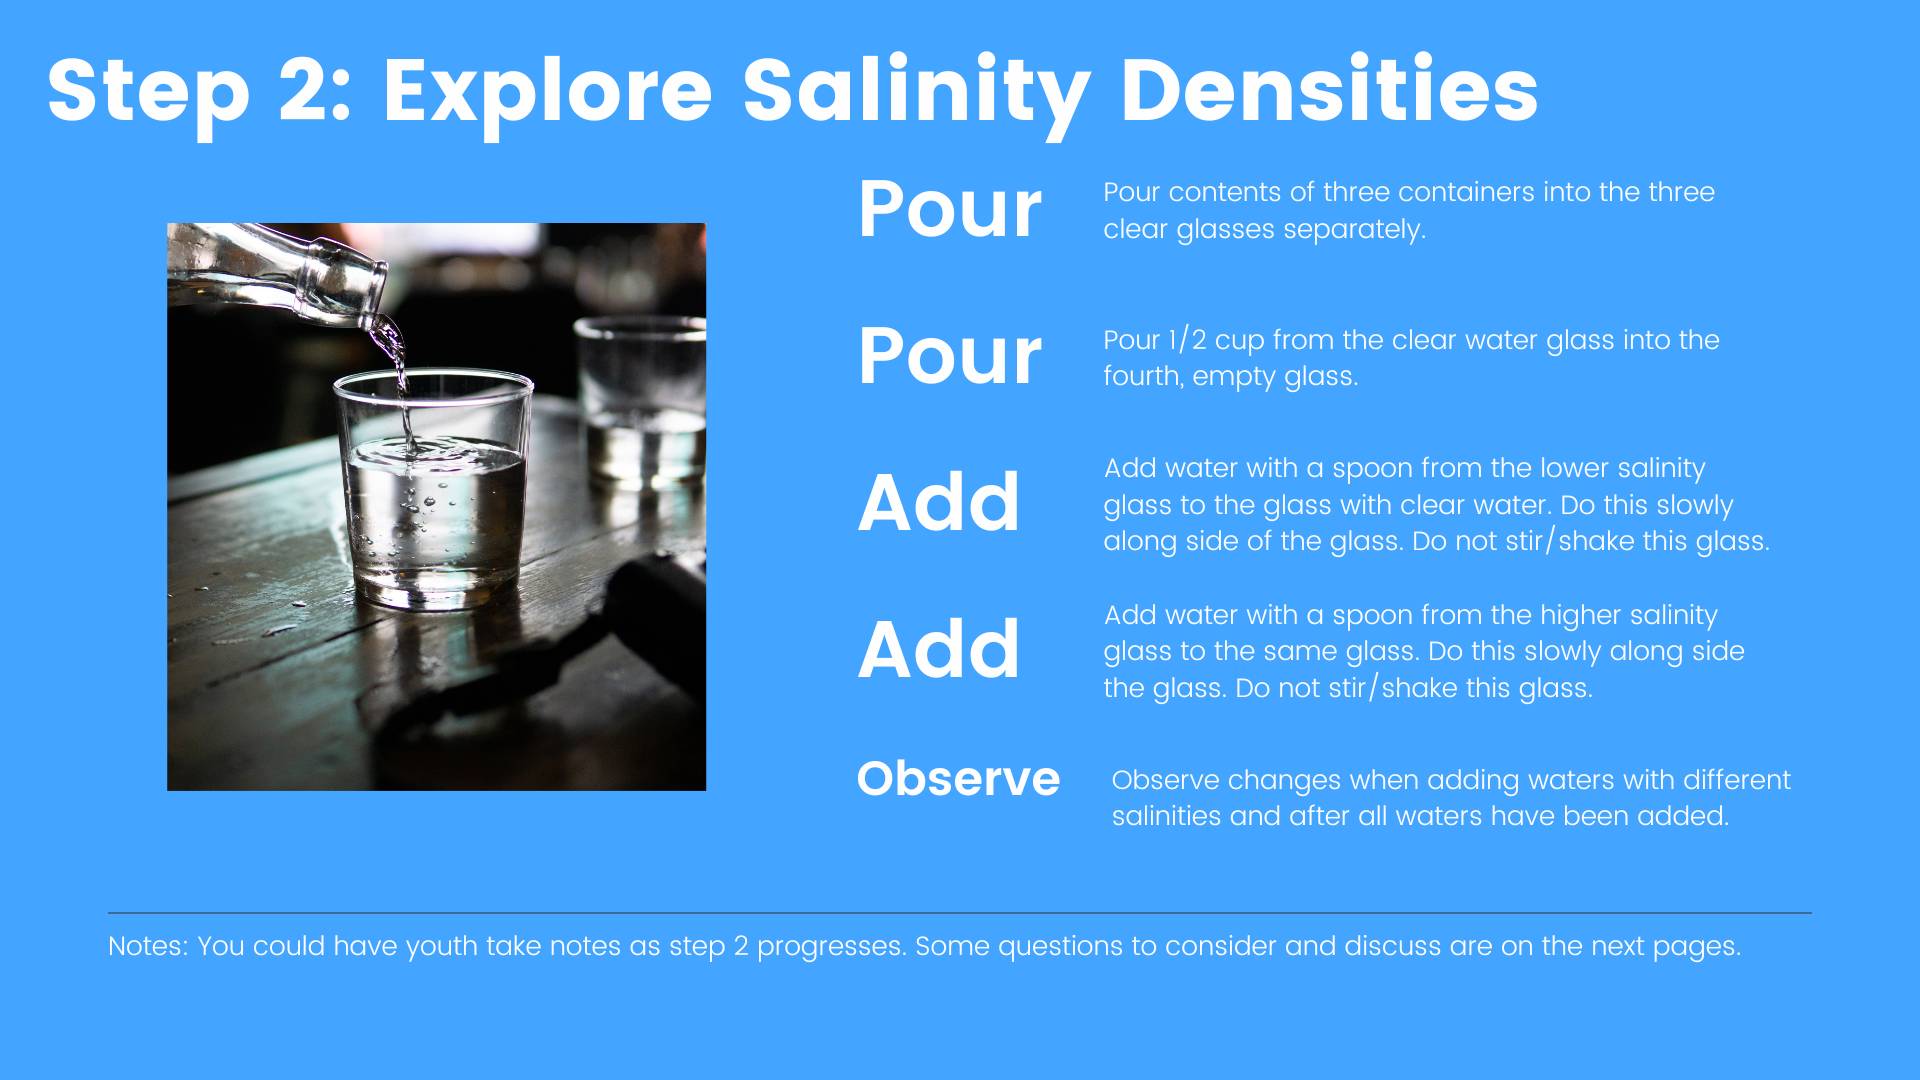
Salinity and changes in salinity affect how water moves on Earth due to contrasts in the density of water. Water containing no dissolved salts is less dense than water containing dissolved salts. Density is weight per volume, so water with no dissolved salts (less dense) will float on top of water with dissolved salts (denser). This is why swimming in the ocean may feel easier than swimming in a lake because the denser water provides increased buoyancy.
Northwest Florida is a unique place because we have a variety of surface waters that range in salinity. There are ponds, lakes, streams, rivers, and springs, which have no to low salinity levels (0 to 0.5 PPT), and commonly referred to as freshwater systems. We house six estuaries—Perdido Bay, Pensacola/Escambia Bay, Choctawhatchee Bay, St. Andrews Bay, St. Joseph Bay, and Apalachicola Bay. Estuaries are bodies of water with freshwater input(s) (e.g., rivers) and a permanent opening to the ocean (e.g., Destin Pass in the Choctawhatchee Bay). Estuarine waters are termed brackish water (0.5 to 30 PPT) due to the dynamic changes in salinity at spatial and temporal scales. Waterbodies with an even more dynamic change in salinity are the coastal dune lakes Northwest Florida’s Walton and Bay Counties. Coastal dune lakes are waterbodies perched on sand dunes that intermittently open and close to the Gulf of Mexico. Sometimes these waterbodies are fresh and sometimes they have the same salinity as the Gulf of Mexico, like after a large storm event. Finally, the Gulf of Mexico, or ocean, has the highest salinity (> 30 PPT) among the waterbodies of Northwest Florida.
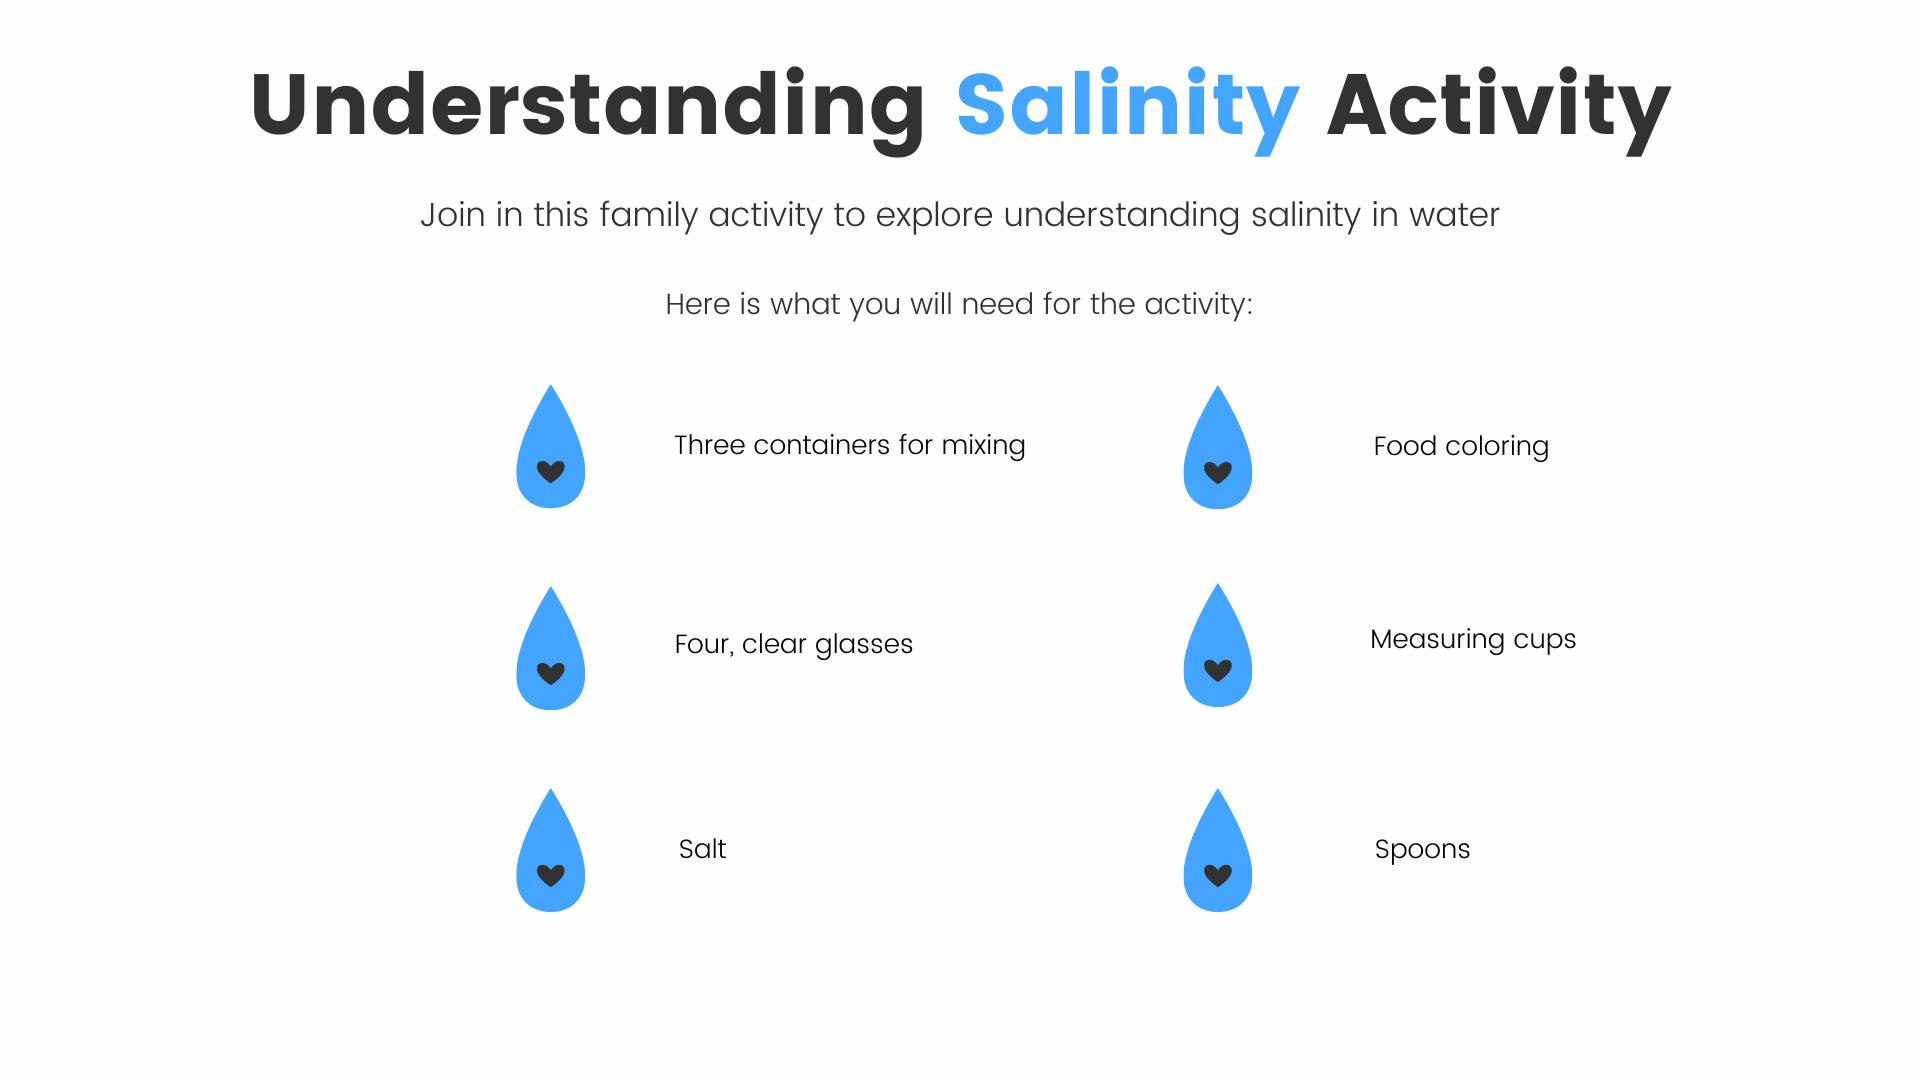
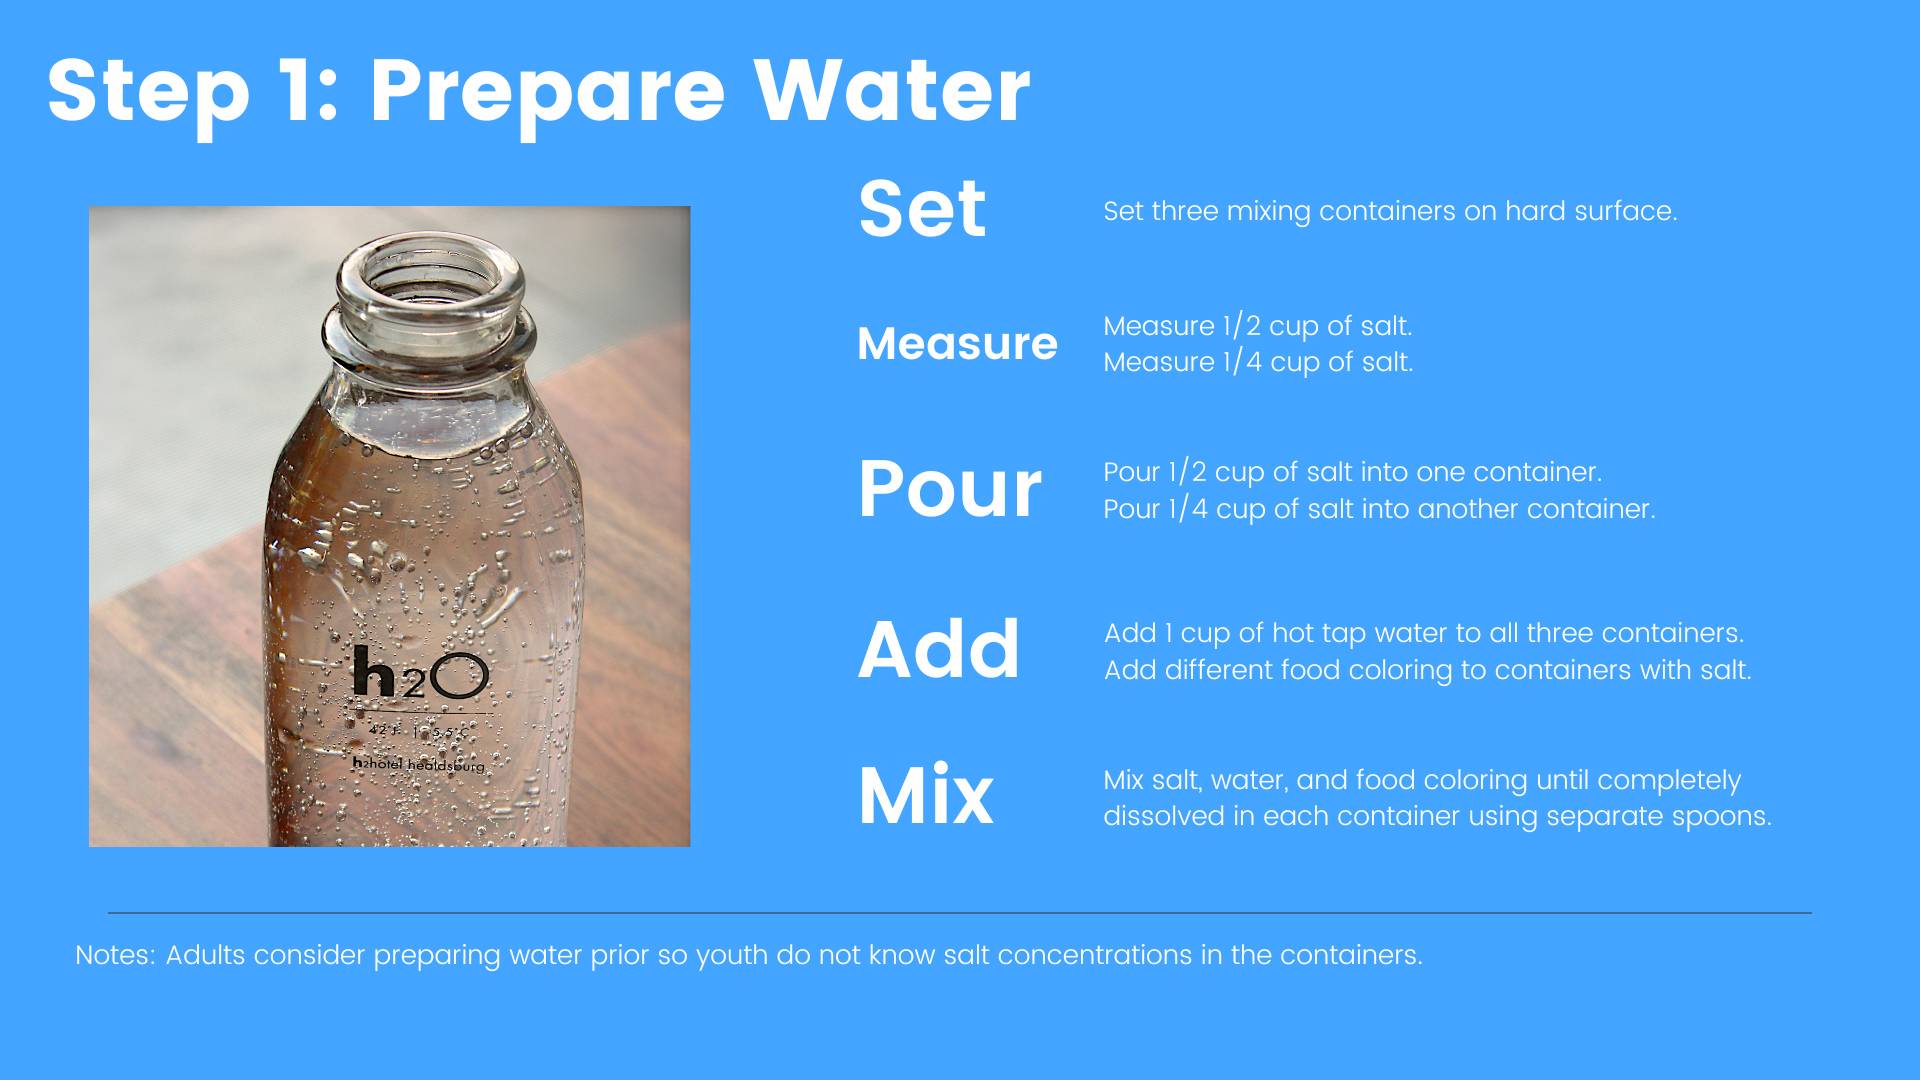
Here is an educational activity for the family to explore salinity and how salinity differs among Northwest Florida waters.
In 2005 I was leading a field trip with high school students in a salt marsh on Santa Rosa Island near Pensacola Beach. As we explored a brackish water creek, we came across a three-foot red mangrove tree, prop roots and all. To say we were surprised and excited would be an understatement.
Most know that mangroves are trees that can tolerate seawater and grow along estuarine shorelines across the tropics, including south Florida. They can form dense forests that support all sorts of aquatic and terrestrial wildlife. They need calm protected waters to establish themselves but once established are excellent at protecting shoreline communities during hurricanes. However, they cannot tolerate cold weather, only surviving freezing temperatures for one or two nights.
The red mangrove. Photo: University of Florida
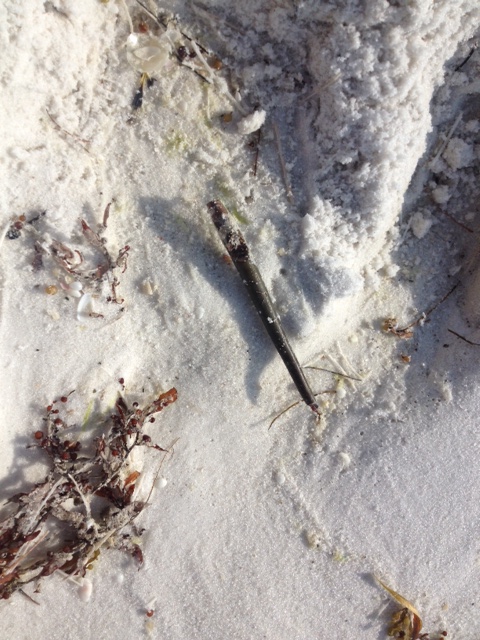
Growing up in Pensacola we would often find red mangrove propagules (seedlings) washed ashore arriving from the tropical parts of the Gulf. They were generally on the Gulf side of Santa Rosa Island and Perdido Key but never germinated. If they were carried into the estuary, and found a protected lagoon to begin germination, they would not survive our winters. This is what made finding an established three-foot mangrove in a lagoon off Santa Rosa Sound in 2005 so surprising.
Mangrove propagule washed ashore. Photo: Rick O’Connor
Historically mangroves were not found north of Tampa Bay. However, in recent decades they have become established as far north as Cedar Key. Trying to determine whether the mangrove we found was the northern most in Florida I found that they were also expanding along the east coast of Florida as far north as St. Augustine, and there were records in the Jacksonville area. Many attribute this to climate change. Our winters are milder than they were when I was a kid, and this may be leading to what many are calling the “tropicalization of northern Gulf of Mexico”. Not only mangroves, but other historically south Florida species, such as snook and bonefish, have been reported along the panhandle.
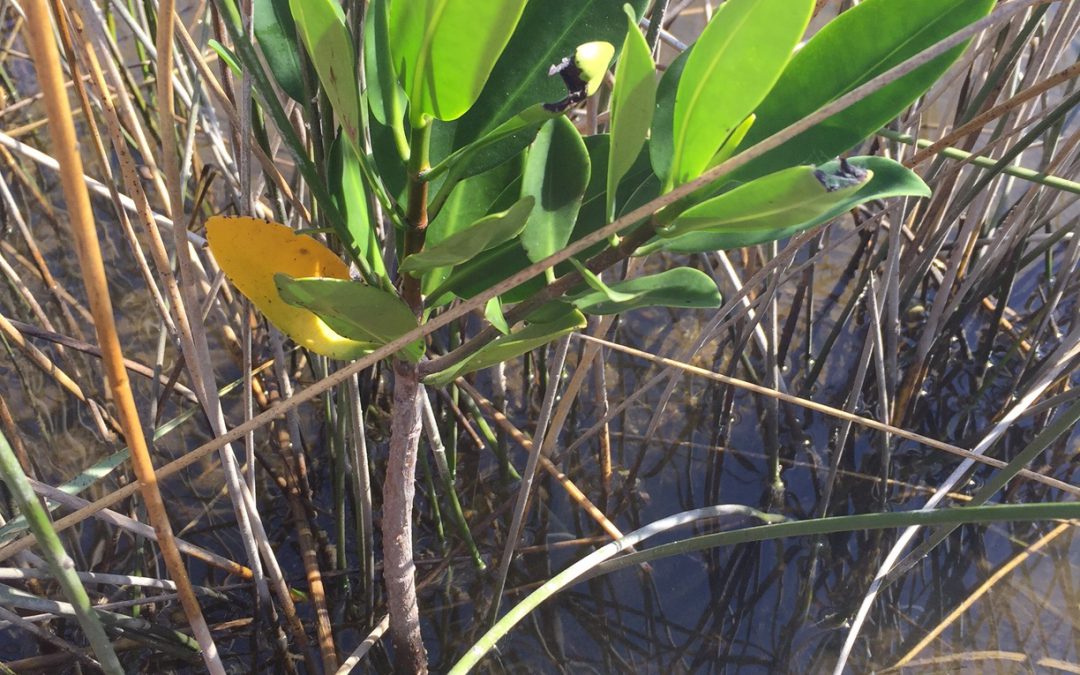
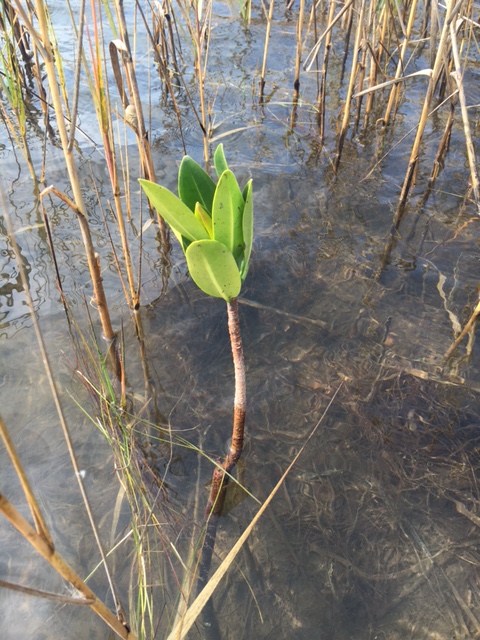
In 2017 I was leading another high school group on a field trip in a salt marsh in Big Lagoon State Park. We found a germinated seedling of a red mangrove doing very well. We explored more and found seven others in the nearby area. How many more were growing in the Pensacola Bay area?
A small red mangrove growing in Big Lagoon near Pensacola FL Photo: Rick O’Connor
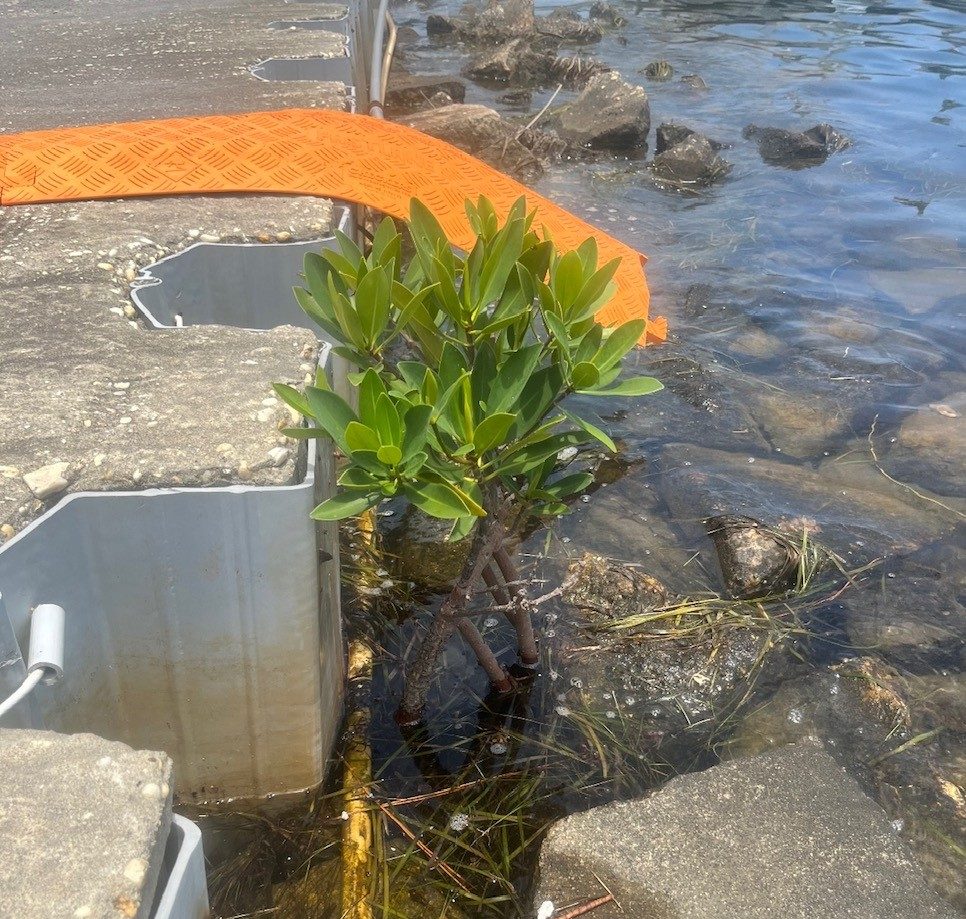
We partnered with a research team from Dauphin Island Sea Lab who was looking into this as well. The team included extension agents and specialists from Florida and Mississippi-Alabama Sea Grant, as well as biologists from the National Estuarine Research Reserves in Mississippi, Alabama, and Florida panhandle. Each county/region selected 10 transect sites that had the highest probability of mangroves to monitor each year. Mangroves appear to be established on some of the Mississippi barrier islands, as well as in St. Joe Bay. Individuals have been reported from Bay County. A ninth mangrove was found in Escambia County but a hard freeze in 2018 killed them all. Since then, one young multi-year red mangrove was found on NAS Pensacola. It died in the hard freeze of 2023. Despite the hard freezes, those established in St. Joe Bay seem to be holding on. I decided to make a visit and see.
A red mangrove growing at NAS Pensacola. Photo: Whitney Scheffel.
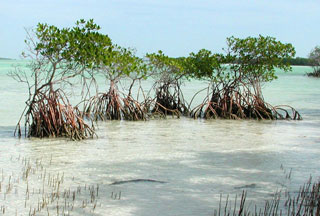
Black mangroves growing near St. George Island in Franklin County. Photo: Joshua Hodson
Wading out from the buffer preserve with Gulf County Sea Grant Agent Ray Bodrey, we found relatively large patches of mangroves, and seeds suggesting active expansion was ongoing. But I noticed the species we were seeing were black mangroves. I mentioned to Ray that what we had seen in Pensacola were red mangroves. He said that the red mangroves have a hard time here as well. Black mangroves are more tolerant of cold weather, and it is they who are establishing these large patches. There are reports of large patches of mangroves on the Mississippi barrier islands – and they are the black mangroves as well. I know that black mangroves have been established in the Chandeleur Islands in Louisiana for decades. I am convinced that if black mangroves seeds were to reach protected lagoons in Pensacola Bay, they would probably do well here as well.
I continue to conduct our transects each year in the Pensacola Bay area. I have a couple of trained volunteers helping me but could always use more. If you think you have seen a mangrove growing in the Florida panhandle, we would love to know and document their location. We know they are established in Gulf County, so our focus is now Escambia to Bay counties. If you think you have seen one, contact me at roc1@ul.edu or your county Sea Grant Agent.
I was having dinner with my family on a cool March evening when one said “I have not seen any Swallow-tailed Kites yet. We usually see them this time of year”. To which I replied, “I saw one today!” – and I had. It was March 23, a very windy afternoon, and I saw it briefly zip over our backyard. The Swallow-tailed Kites were back.
Back in the sense they were back from their long migration from South America. The Swallow-tailed Kite resides there and ventures north to Central and North America during the summer for the breeding season.
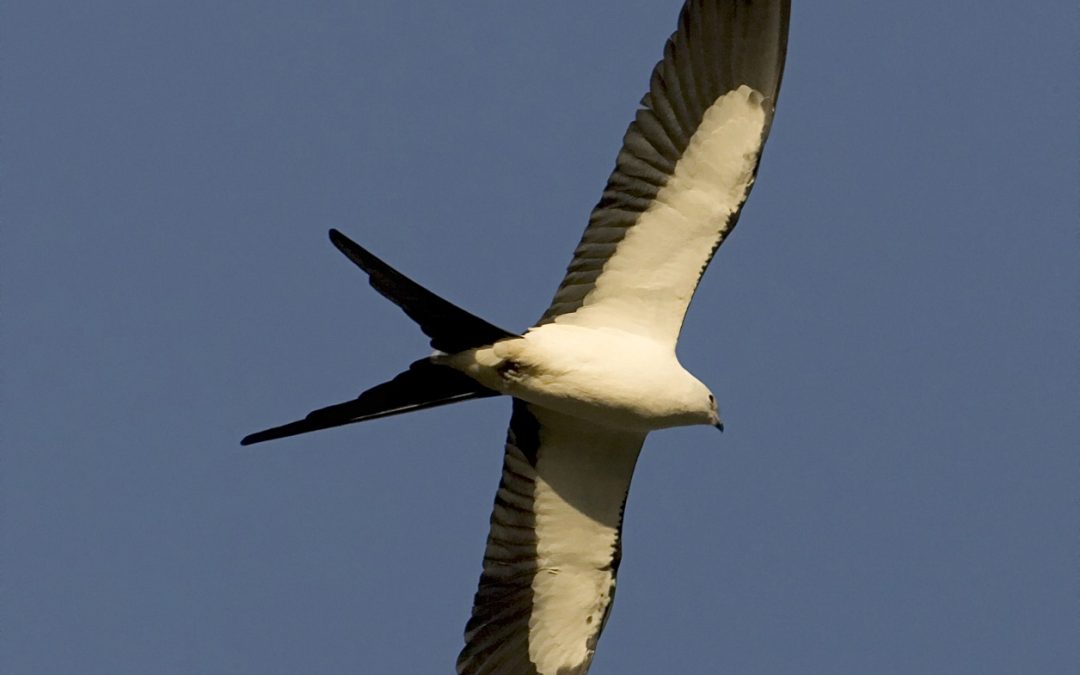
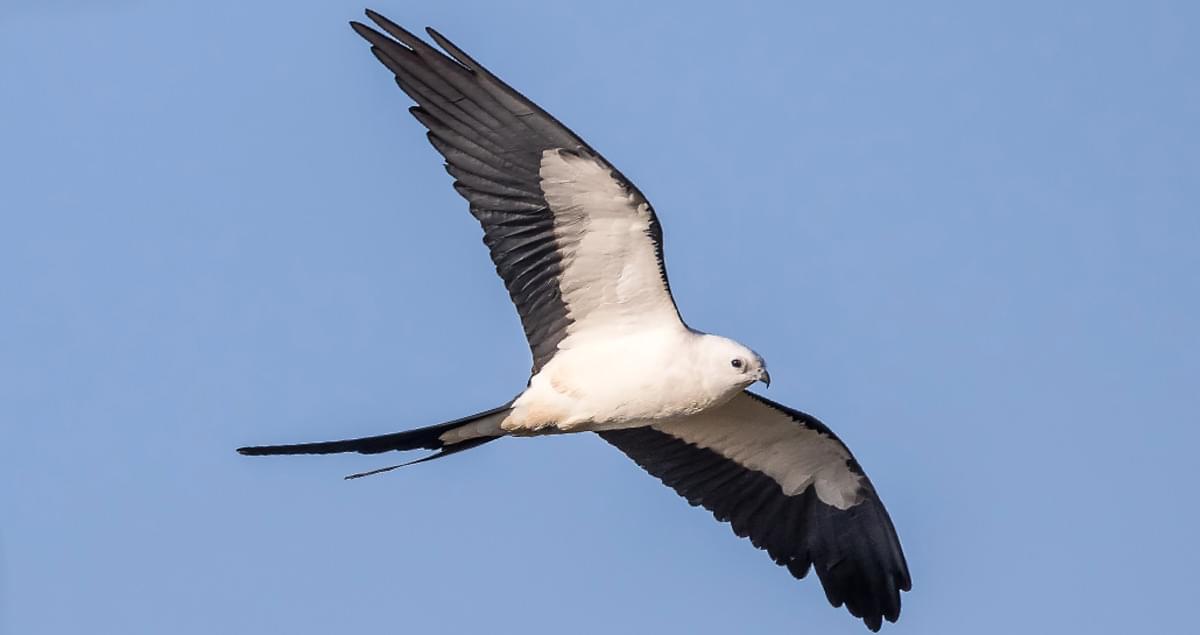
The Swallow-tailed Kite. Photo: Cornell University
It is a magnificent bird, described as “one of the most awesome birds in the U.S.”. Their long slender bodies are sharp in contrast with a brilliant white head and a deep black body. They have long pointed wings which they use to soar with grace, rarely flapping their wings, and their key feature of the scissor-looking forked tail. They are a relatively large bird somewhere between the size of a crow and a large goose. Swallow-tailed kites are often seen soaring just above the treetops searching for food but can also be seen at higher elevations gliding along with the wind. It is a bird that many get excited about when they see it.
Arriving in the United States in late February and March, they seek out opportunities for nesting habitat. Their preference are tall trees, usually 60 feet or taller, and most often select pine trees, though have been known to nest in cypress and other large trees. They usually select trees close to water or open fields. These locations provide an abundance of their favorite prey – insects. They can be seen zooming close to the trees to grab unwary prey and will, at times, take larger creatures like treefrogs, lizards, and small snakes. Their beaks are small however, and so prey selection is limited.
Both the males and females participate in nest building. Swallow-tailed kites are monogamous and mate pairing often occurs during the migration. They usually build a new nest each season but often is the same location. Males are territorial of these nest locations and defend them with local vocalizations. Despite this, many swallow-tailed kite nests can be found near each other.
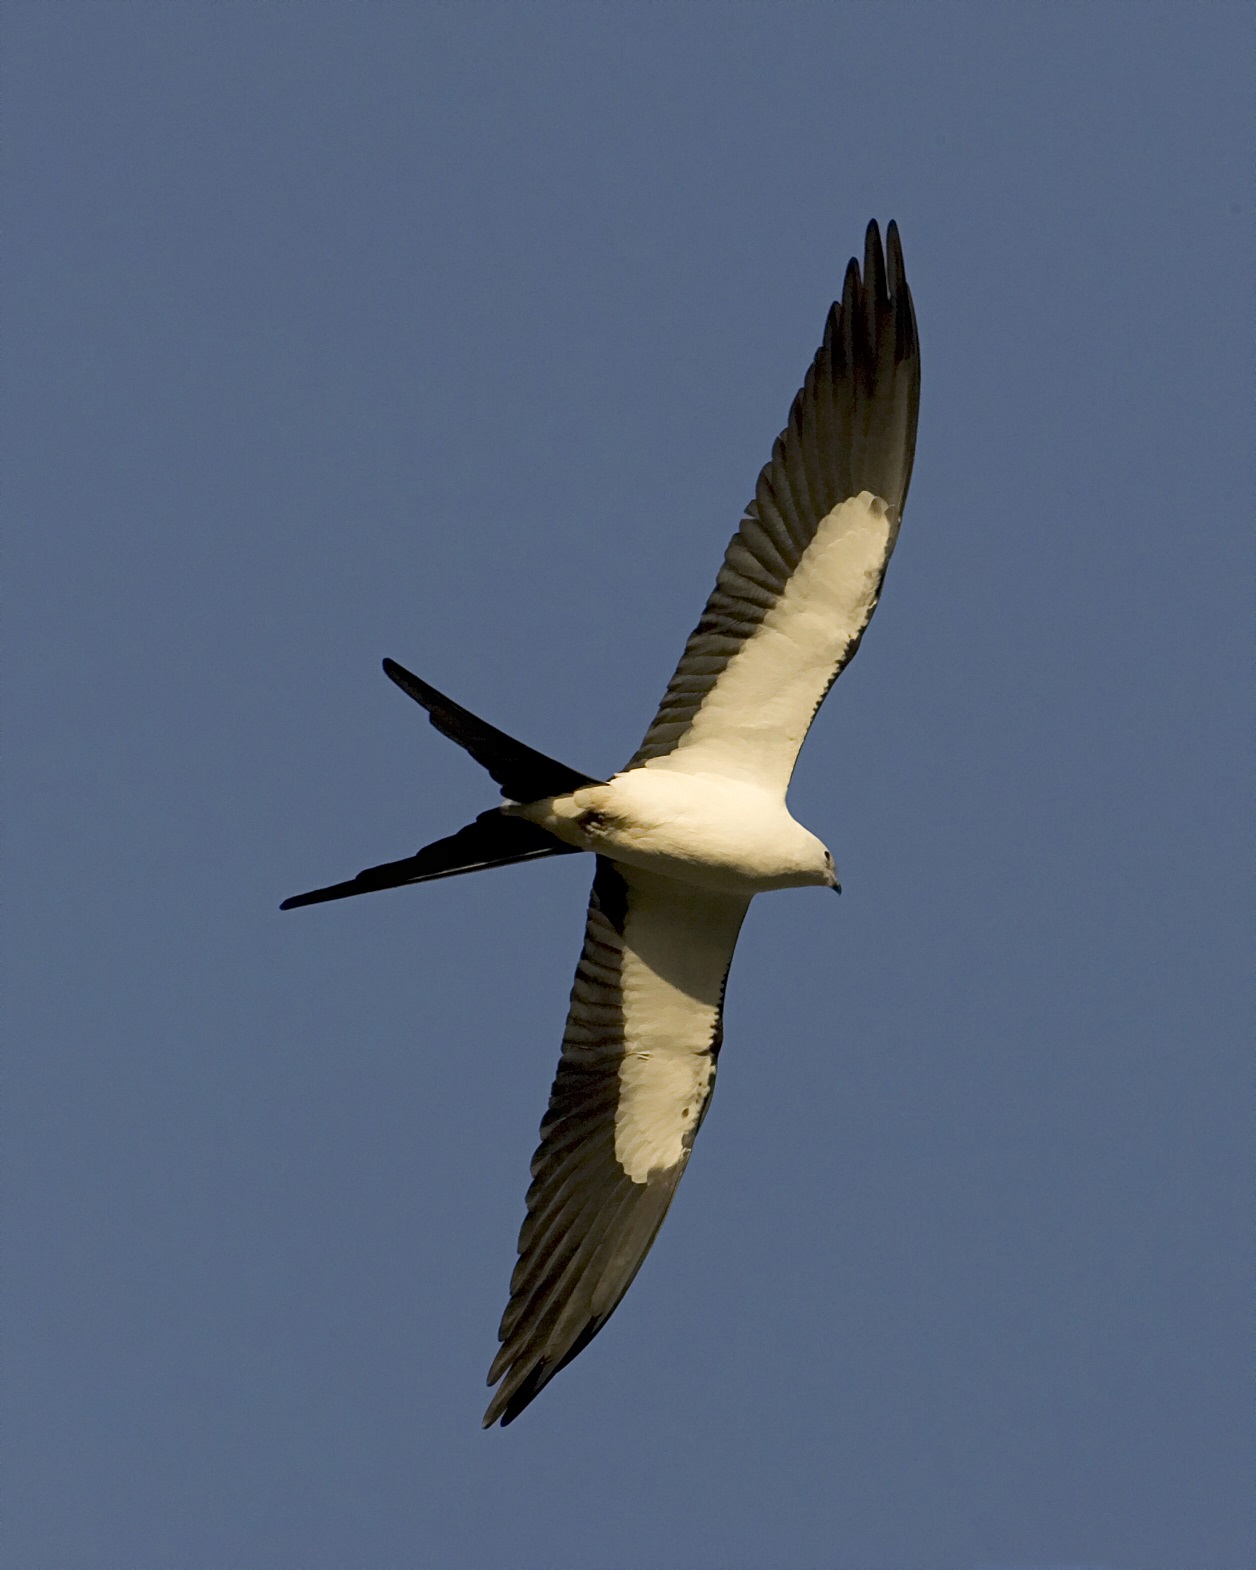
The Swallow-tailed Kite. Photo: Rodney Cammauf – National Park Photo.
Once the young hatch, the female remains with them while the male forages for food. He typically brings it back to the nest in his talons, perches and transfers the food to his beak, and the provides it to the female who in turn feeds the chicks. After fledging, around August or September, it is time to head back to South America and they leave our area until next spring.
Swallow-tailed kites were once common all along the Mississippi River drainage as far north as Minnesota. However, the numbers declined significantly, primarily due to humans shooting them, and today they are only found in the lower coastal regions of the southeastern U.S. Today they can be found, but are uncommon, in coastal Louisiana, Mississippi, Alabama, Georgia, and South Caroline. In Florida they are considered uncommon in the panhandle but common in the peninsula part of the state. Their numbers seem to be increasing but the loss of tall nesting trees is a major issue today. The clearing of these tall trees due to agriculture and urban development have kept them from reestablishing their original range. But for now – the swallow-tailed kites are back.
For more information on this amazing bird read the following.
Swallow-tailed Kite. All About Birds. Cornell Lab. Cornell University.
Organized and sponsored by Florida Sea Grant, the “Stem to Stern” workshop in November 2023 at the Emerald Coast Convention Center marked a significant gathering in marine conservation and management. This event drew together legal experts, representatives from the Florida Fish and Wildlife Conservation Commission (FWC), local marine resource coordinators, law enforcement, and industry stakeholders to tackle critical issues facing Florida’s marine environments. Through discussions that ranged from legal frameworks for boating and waterway access to environmental conservation strategies, the workshop facilitated a deep dive into the complexities of marine policy and stewardship. Discover new programs, insights, and collective expertise shared at “Stem to Stern.”
Florida Sea Grant Boating and Waterways Workshop
November 2, 2023 Emerald Coast Convention Center
1250 Miracle Strip Parkway SE – Ft. Walton Beach FL
9:00 – 9:25 WELCOME AND INTRODUCTIONS
Welcome
Rick O’Connor (Florida Sea Grant UF IFAS Extension)
Moderators –Mike Norberg and Jessica Valek (Okaloosa County)
3:15 – 3:45 WRAP UP – Robert Turpin (Escambia County Marine Resources)
PROGRAM SPONSORS
Acknowledgement
We extend our deepest gratitude to all who contributed to the success of the “Stem to Stern” workshop. To our esteemed speakers, whose expertise and insights into marine conservation and management have been invaluable, we offer our sincere thanks. Your presentations were not only informative but also inspirational, guiding us toward a more sustainable future for our waterways.
A special acknowledgment goes to the members of the planning and program committee. Your dedication and hard work in organizing this event did not go unnoticed. From the initial planning stages to the execution of the workshop, your efforts have been the backbone of this successful gathering.
We also want to thank the authors of the surveys that have provided us with essential data and perspectives. Your research and analysis contribute significantly to our understanding of the challenges and opportunities within Florida boating and waterways.
Lastly, we are incredibly grateful for the support from our sponsors. Your generosity and commitment to Florida Sea Grant and marine conservation have been crucial in bringing this workshop to life. Your support not only made this event possible but also highlights your dedication to safeguarding our marine ecosystems.
Together, we have taken an important step towards protecting and enhancing Florida’s waterways. Thank you for your contributions, commitment, and shared vision for a sustainable future.
Information edited and compiled by: L. Scott Jackson, Chantille Weber, and Amon Philyaw, UF/IFAS Extension Bay County
An Equal Opportunity Institution. UF/IFAS Extension, University of Florida, Institute of Food and Agricultural Sciences, Andra Johnson, Dean. Single copies of UF/IFAS Extension publications (excluding 4-H and youth publications) are available free to Florida residents from county UF/IFAS Extension offices.
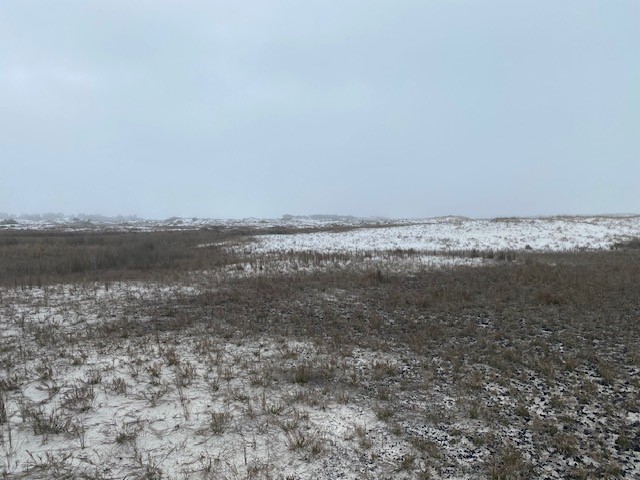
Though this is titled late winter, it did not feel like winter on this walk. The air temperature was 75°F. There was a blanket of fog over the beach, and it felt slightly humid and sticky, but with a cooler feel than we have in summer. It is true that Punxsutawney Phil did not see his shadow this year – signaling an early spring, and the weather today supported this, but spring does not officially begin until the equinox on March 21. So, this is a late winter walk.
This walk was near Big Sabine on Pensacola Beach. As I crossed the road at Park East and headed into the dunes there was a breeze from the south creating surf that could be heard across the island. The fog made things damp and chilled. And there was no sign of wildlife anywhere. The numerous songbirds I had encountered during early and mid-winter were gone. There were flowers in bloom but no insects pollinating them. Literally no wildlife was to be seen.
A foggy day on Pensacola Beach.
Photo: Rick O’Connor
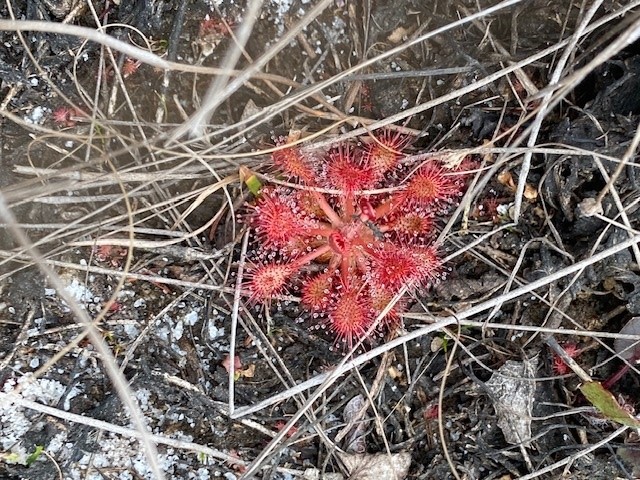
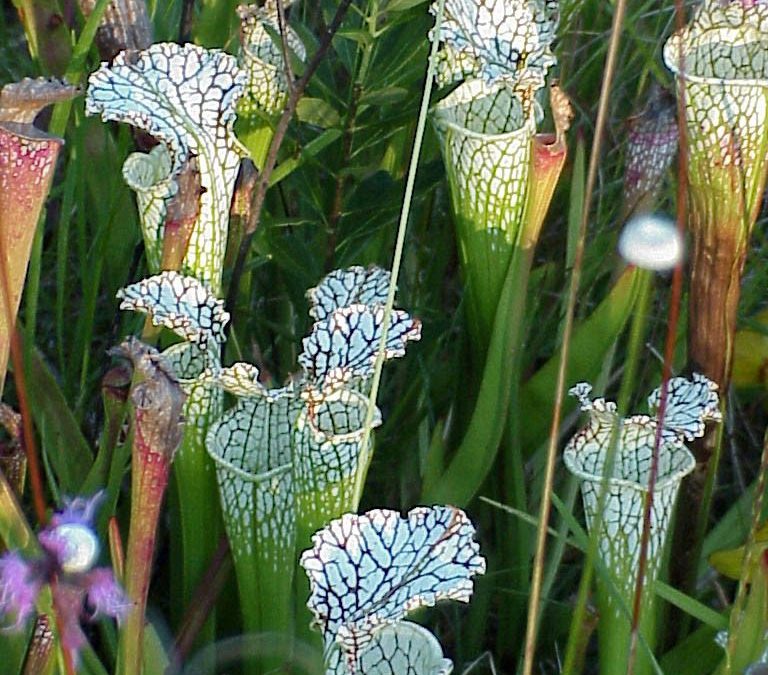
So, I turned my focus to the environment, noticing plants and the stages they were in. As you move from the primary dunes of the Gulf side into the more shrub covered secondary dunes, you cross through low areas in the dune field called swales. Here water collects during rain events forming ephemeral ponds and the plants associated with this habitat are more wetland than upland. In the boggy portions of the swale, I found sundews large and in a brilliant red color. These carnivorous plants produce tiny droplets of sugar water on threads at the tips of their leaves that attract the pollinators of the beach. Though sweet and delicious, they are also sticky and trap unaware insects which become a meal for them. Along with the sundew were numerous strands of ground pine, another carnivorous plant of the swale.
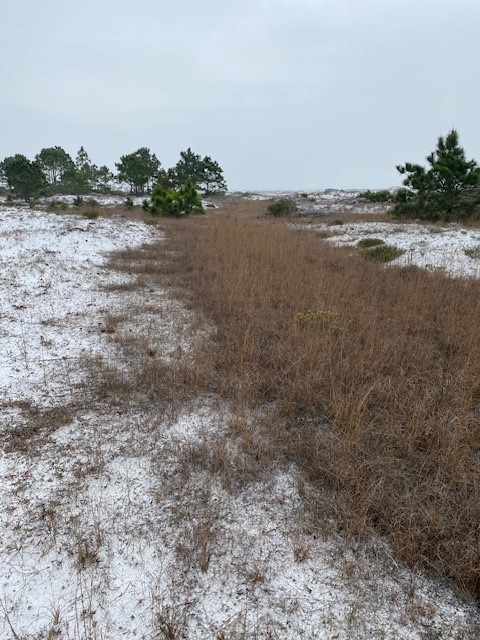
Swales are low areas of the dune field where water stands for periods of time and the more wetland plants can exist.
Photo: Rick O’ConnorThe carnivorous sundew inhabits more wetland locations.
Photo: Rick O’Connor
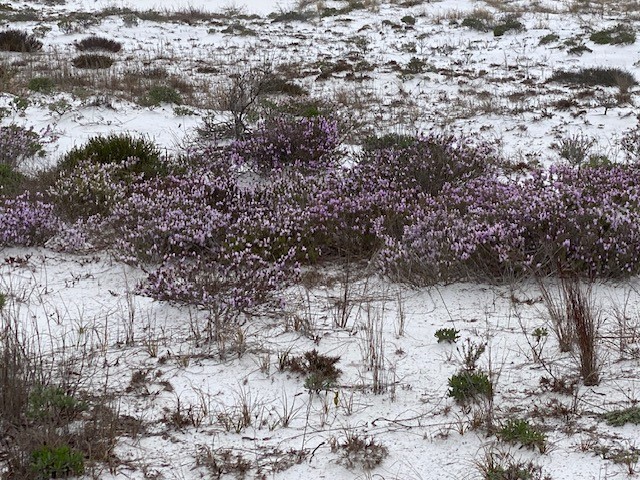
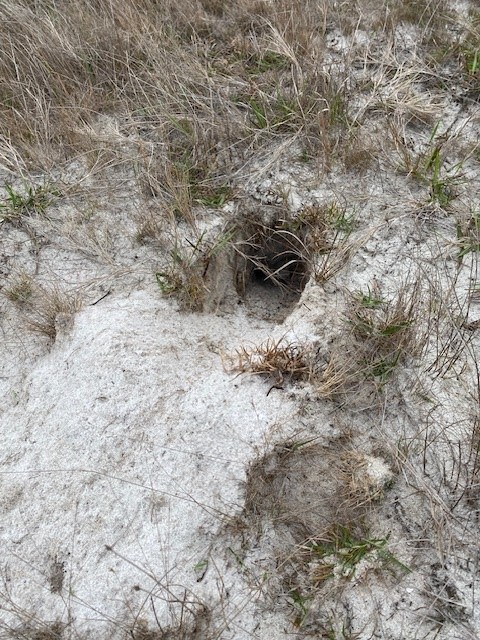
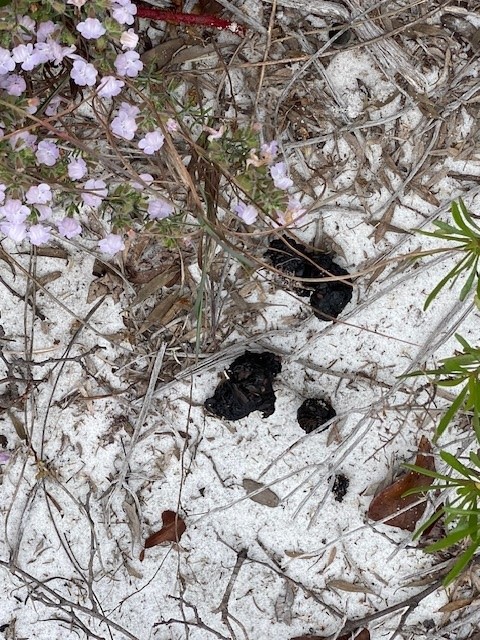
Beyond the swale, the secondary dunes were a blanket of lavender. The false rosemary, also called beach heather (Conradina), was in full bloom everywhere. As I walked through the dunes of flowers I came across the signs of wildlife. Armadillo dens were quite common. There were tracks of animals, including the raccoon, and scat was found. The scat contained seeds and, unlike the long-tapered shape of most carnivore scat, was blunt and rectangular shaped – suggesting a herbivore or omnivore. I did encounter a couple of ephemeral ponds with very little water, but there were no animals, or animal sign, to be found there.
The false rosemary was in bloom and the dunes were full of this lavender color.
Photo: Rick O’ConnorArmadillo burrows like this one can be found all over our barrier islands.
Photo: Rick O’ConnorThe blunt ended and rectangular shape of this scat suggests it was from a herbivore or omnivore. It was full of seeds.
Photo: Rick O’Connor
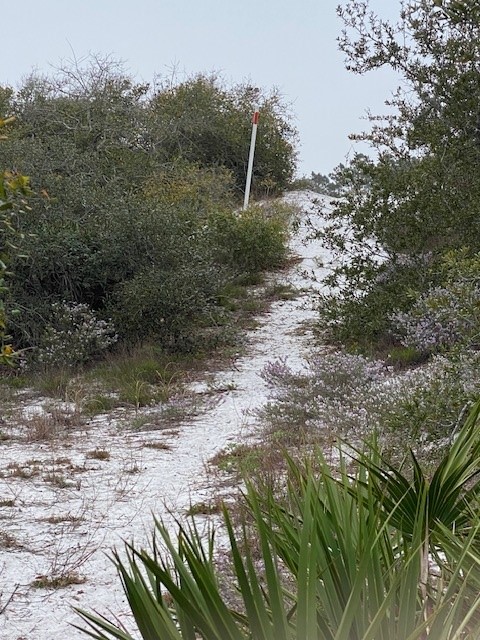
As you move from the secondary dunes into the maritime forest you pick up a section of the Florida Trail. This 1,500-mile trail begins at Ft. Pickens on the western end of Santa Rosa Island and ends near the Everglades. It was obvious that many of the animals who live in these dunes use this trail as well, there were numerous tracks covering it. Over the ridge into the maritime forest, you encounter marshes. The plants you find growing there help indicate whether the marsh is fresh or salt water. Pausing here to see if something stirred or moved, I saw and heard nothing and continued on.
The orange blaze indicates this is part of the Florida Trail.
Photo: Rick O’Connor
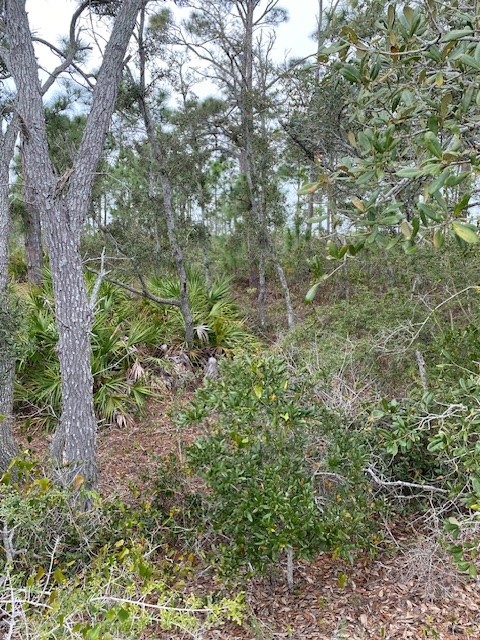
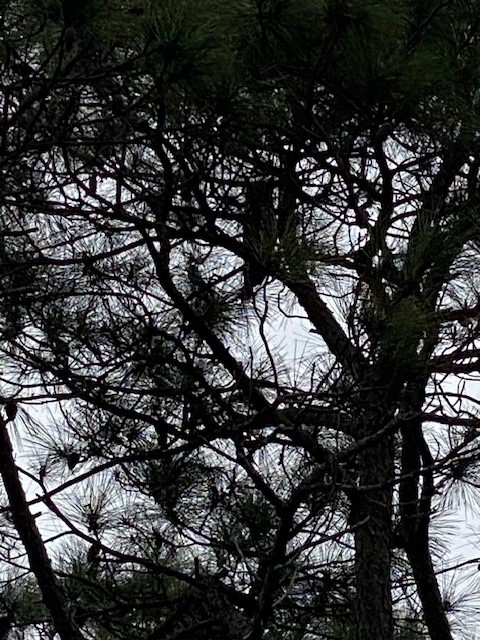
The maritime forest was full of healthy pine and oak trees, creating a completely different habitat for the wildlife out here. You get the feeling when you enter the forest that this is where the creatures prefer to be. Raccoons, skunks, coyote, snakes, birds, lizards, exist here and I was hoping to find something. And then it happened. Glancing up into one of the pine trees I saw a great horned owl – bingo! These are amazing birds and there have been a few reports of nesting great horned owls around the area. I did not see the nest but was happy to see the owl.
The maritime forests of our barrier islands is a completely different environment than the open dune fields.
Photo: Rick O’ConnorUsing the nests of other raptors, great horned owls raise their young this time of year. This one is in the “extended” position suggesting it is alarmed.
Photo: Rick O’Connor
I eventually reached the shore of Santa Rosa Sound and walked along for half a mile or so. I did see a great blue heron in the marsh, and some wharf crabs under a plank of wood – but there was nothing visible in the clear water of the Sound. There was evidence of armadillos digging. One section of the beach they had basically destroyed digging for grubs and other invertebrates to eat.
All in all, it was a quiet day. I am guessing that the foggy conditions moved the animals into their hiding places waiting for the sun to come out. Our next walk will be in early spring, and we are hoping to see more wildlife.
You should get out and take a hike on our beaches, there are plenty of cool things to see and it’s great for your mind.
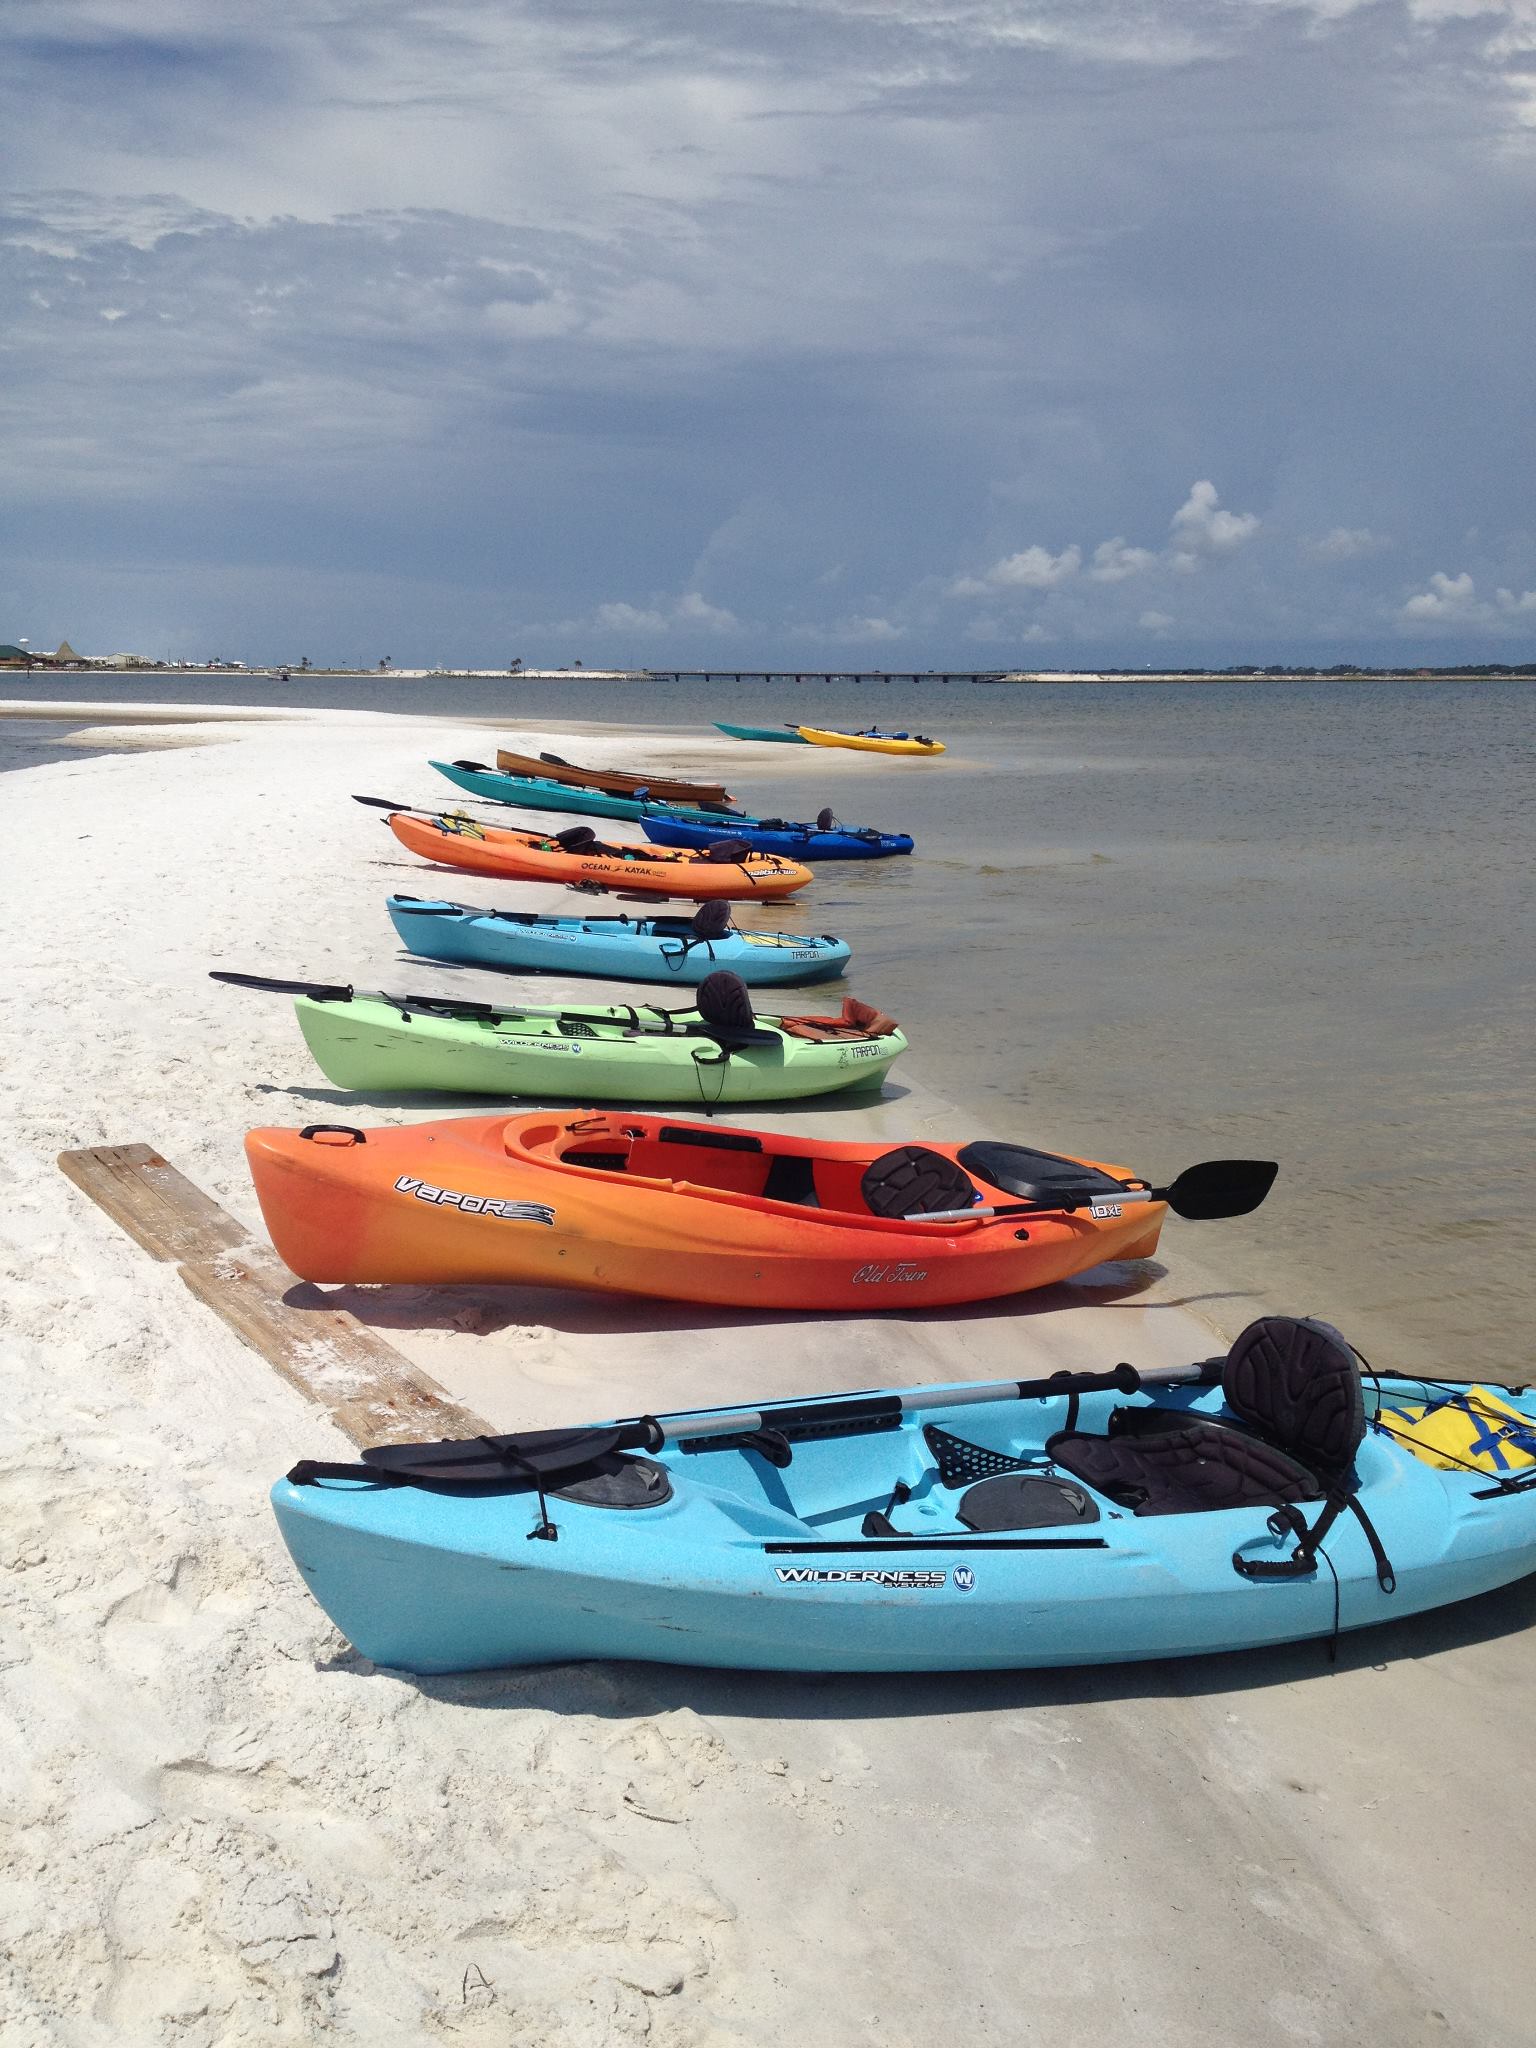
Kayaking over seagrass beds and stingrays, hiking among pitcher plants, boating past diving ospreys, and meeting hundreds of fascinating, like-minded people—these are just some of the great experiences I’ve had while teaching the Florida Master Naturalist Program. More than 20 years since its inception, the Florida Master Naturalist Program (FMNP) has inspired the creation of dozens of similar courses in other states and proven itself to be one of the most popular outreach programs to come out of UF IFAS Extension.
Kayaking Santa Rosa Sound in Navarre is one of the highlights of our Coastal Systems FMNP class. Photo credit: Carrie Stevenson, UF IFAS Extension
The mission of the FMNP is simple—to promote awareness, understanding, and respect of Florida’s natural world among Florida’s citizens and visitors. I have always felt strongly that if you want people to care about something, they need to understand it. And to really understand something, you need to experience it. I know my own passion for science and ecology was ignited early on by teachers who took us outside and helped us encounter the many wondrous surprises in the natural world. With the FMNP, we seek to do just that.
Master Naturalist students conduct field work in small groups. Photo credit: Carrie Stevenson, UF IFAS Extension
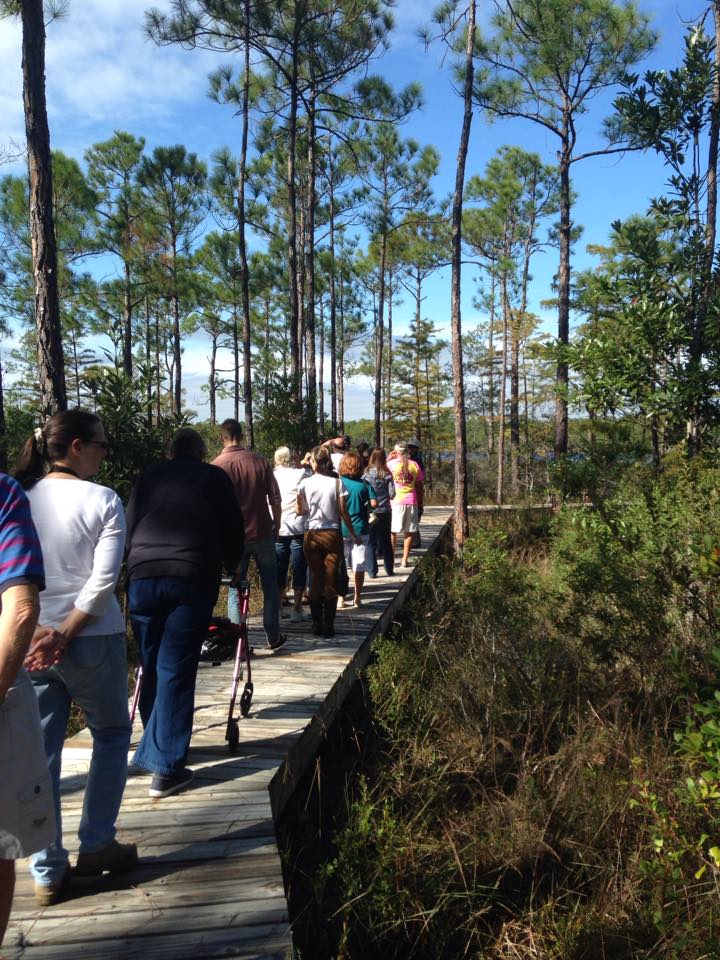
Over a span of 40 hours in 6-7 weeks, we spend about half our time with classroom presentations and the other half in the field, seeing the plants, animals, and ecosystems we discuss in class. In addition to classes and field trips, students produce a final project and present it to the class. These can range from labeled collections and slide presentations to building bird houses and new trails. The program is composed of three 40-hour core courses; Coastal, Upland, and Freshwater Systems. Seven “short courses” with 24 hours of class/field time include the Land Steward series (Conservation Science, Habitat Evaluation, Wildlife Monitoring, and Environmental Interpretation) and the Restoration courses (Coastal Restoration, Marine Habitat Restoration, and Invasive Plants). Locally, we try to rotate the core modules every couple of years and incorporate the short courses periodically. Registration includes a detailed course manual and, upon completion, FMNP patch, certificate, and pin denoting area of expertise. There are a handful of scholarships available for those interested in applying to offset costs.
Master Naturalist students walk “The Way” boardwalk in Perdido Key. Photo credit: Carrie Stevenson
The classes do not count towards university credit but are an excellent certification and professional development opportunity that many will list on a resume. While we’ve had ecotour operators, park rangers, environmental consultants, teachers, and archaeologists participate, most of our FMNP students are not professionals in the field. They come from every background imaginable but share an interest in the outdoors. Because we meet weekly, class members often form long-lasting friendships during the courses.
Information on upcoming classes in northwest Florida and all around the state is available online. Classes range from fully in-person to hybrid and online options. FMNP classes are restricted to adults 18 and over, but a new “Florida Youth Naturalist” curriculum has been designed through our 4-H program for young people. For more information on that, check out their website.