It is no surprise how hot it has been this summer. With increasing temperatures, the danger also increases for our agriculture and natural resources. Our agriculture and natural resources are an economical and lifestyle treasure that provides favored services like timber, water supply protection, livestock forage, recreation, fisheries, and hunting. Our forest and ecosystems are declining in health and biodiversity due to changed climate activity. Climate change impacts every type of natural resource. Plant and animal species distributions will continue to change as rising temperatures alter ecosystems and amplify existing environmental concerns.
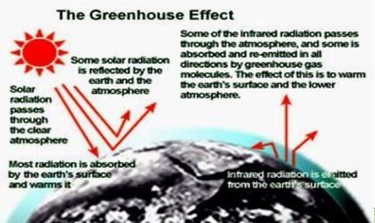
Climate change refers to the range of changes that will occur locally and globally due to this ‘global warming.’ These changes include changes in rainfall patterns, melting of glaciers, rising sea levels, and increasing temperature. To understand how our climate is changing, one must first know how our climate works. Greenhouse gases allow the sun’s rays to enter our atmosphere. Once the rays reflect off the earth’s surface, greenhouse gases trap them in the atmosphere and warm the planet. This act is called the greenhouse effect, and it is necessary for life on earth; the world would be too cold to live without it. Some greenhouse gases are present naturally and others are byproducts of human industry. Natural greenhouse gases include water vapor, carbon dioxide, methane, and nitrous oxide. Over the past 150 years, humans have caused a significant increase in the concentration of greenhouse gases occurring naturally and those made by humans in the atmosphere. Due to these increases, scientists have recorded environmental changes, projected to continue warming our planet to unprecedented levels.
Explaining what The Greenhouse Effect is
Biodiversity are one of the primary aspects at risk. Species that can adapt in wide geographic ranges, such as white-tailed deer and feral hogs, will likely continue to thrive. Species that depend on specific habitats, aquatic and coastal ecosystems, are at risk. Food and forage production will decrease in agricultural areas experiencing increased droughts. Higher temperatures decrease soil moisture, causing crop stress and water demand issues—further stressing U.S. surface and groundwater supplies used for irrigation. Many crops decrease in yield as temperatures rise beyond the heat tolerance range. Warmer winters increase the incidence of pests and diseases in our ecosystems. Extreme heat, especially nighttime heat, decreases animal activity. Impacts vary from different areas, depending on warming and adaption levels.
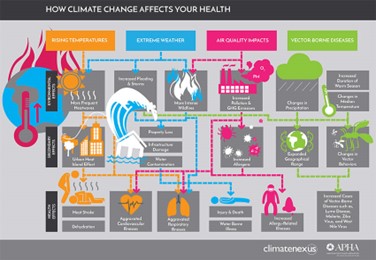
American Public Health Association
Explains how climate change affects your health
Climate action does not always require grand gestures or massive lifestyle changes. We can all play a part in combating climate change by making small adjustments in our daily routines. A fundamental step in tackling climate change is to adopt the “reduce, reuse, and recycle” mantra in your everyday life. By reducing waste, reusing items, and recycling materials, you can positively impact the environment. Energy consumption and water usage directly affect greenhouse gas emissions and water scarcity. You can significantly reduce your carbon footprint by adopting energy-efficient practices and conserving water.
Summertime always makes me think of the supermarket. At least one time each of the past few summers, I clearly remember being at the supermarket during a rainstorm and watching the water wash over the parking lot, talking with all the other people debating whether to run to their car with a buggy full of food. Supermarkets, home goods stores, medical facilities, libraries, and shopping centers all provide important services that we depend on for our everyday life, but their development has altered the natural processes that control the movement of water from the landscape to creeks and ultimately to the bays and bayous around us (collectively referred to as receiving waters). Concrete, asphalt, and building roof surfaces are impervious, meaning that water cannot pass through them. As a result, more water washes off the rooftops, parking lots, driveways, and roads than before the area was developed. Less water sinks into the ground to move slowly toward receiving waters and to recharge aquifers. More impervious surface leads to more runoff to receiving waters, resulting in greater erosion and higher levels of pollutants like nitrogen, phosphorus, and silt in these waterways. These extra pollutants from the landscape and from eroding stream banks have harmful effects many types of organisms that call these waterways home.
New development in Florida is required to include features that “treat” a fraction of the surface water that runs off impervious surfaces before flowing into receiving waters. Treating surface water runoff means holding it back and preventing it from running quickly off the developed landscape; as it is held back, some pollutants may settle out or be consumed by plants. Treatment is commonly accomplished through features like dry retention basins or wet detention ponds, where water is stored and then slowly moves through soil pathways toward receiving waters. These features are common parts of our developed landscape: the big pond behind the supermarket or in front of the new truck stop, or the grassy pit next to the gas station. While these satisfy regulations, they occupy a considerable amount of land, typically are aesthetically lacking, and may not actually reduce pollutant runoff or stormwater volume as intended. They also can be neglected and become a nuisance in the landscape.
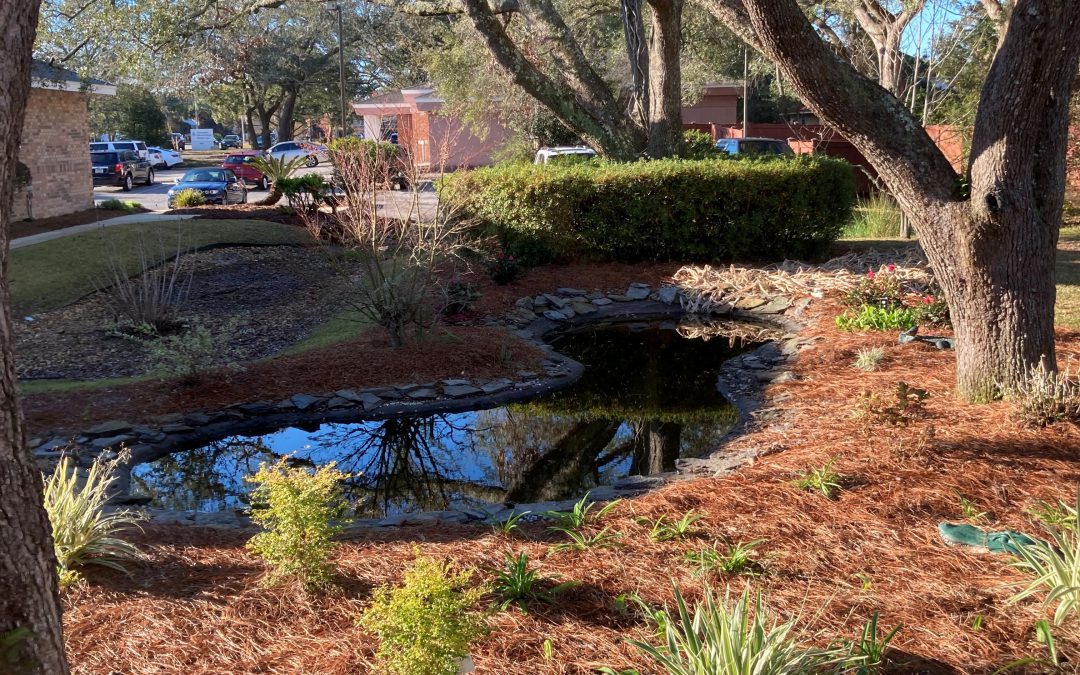
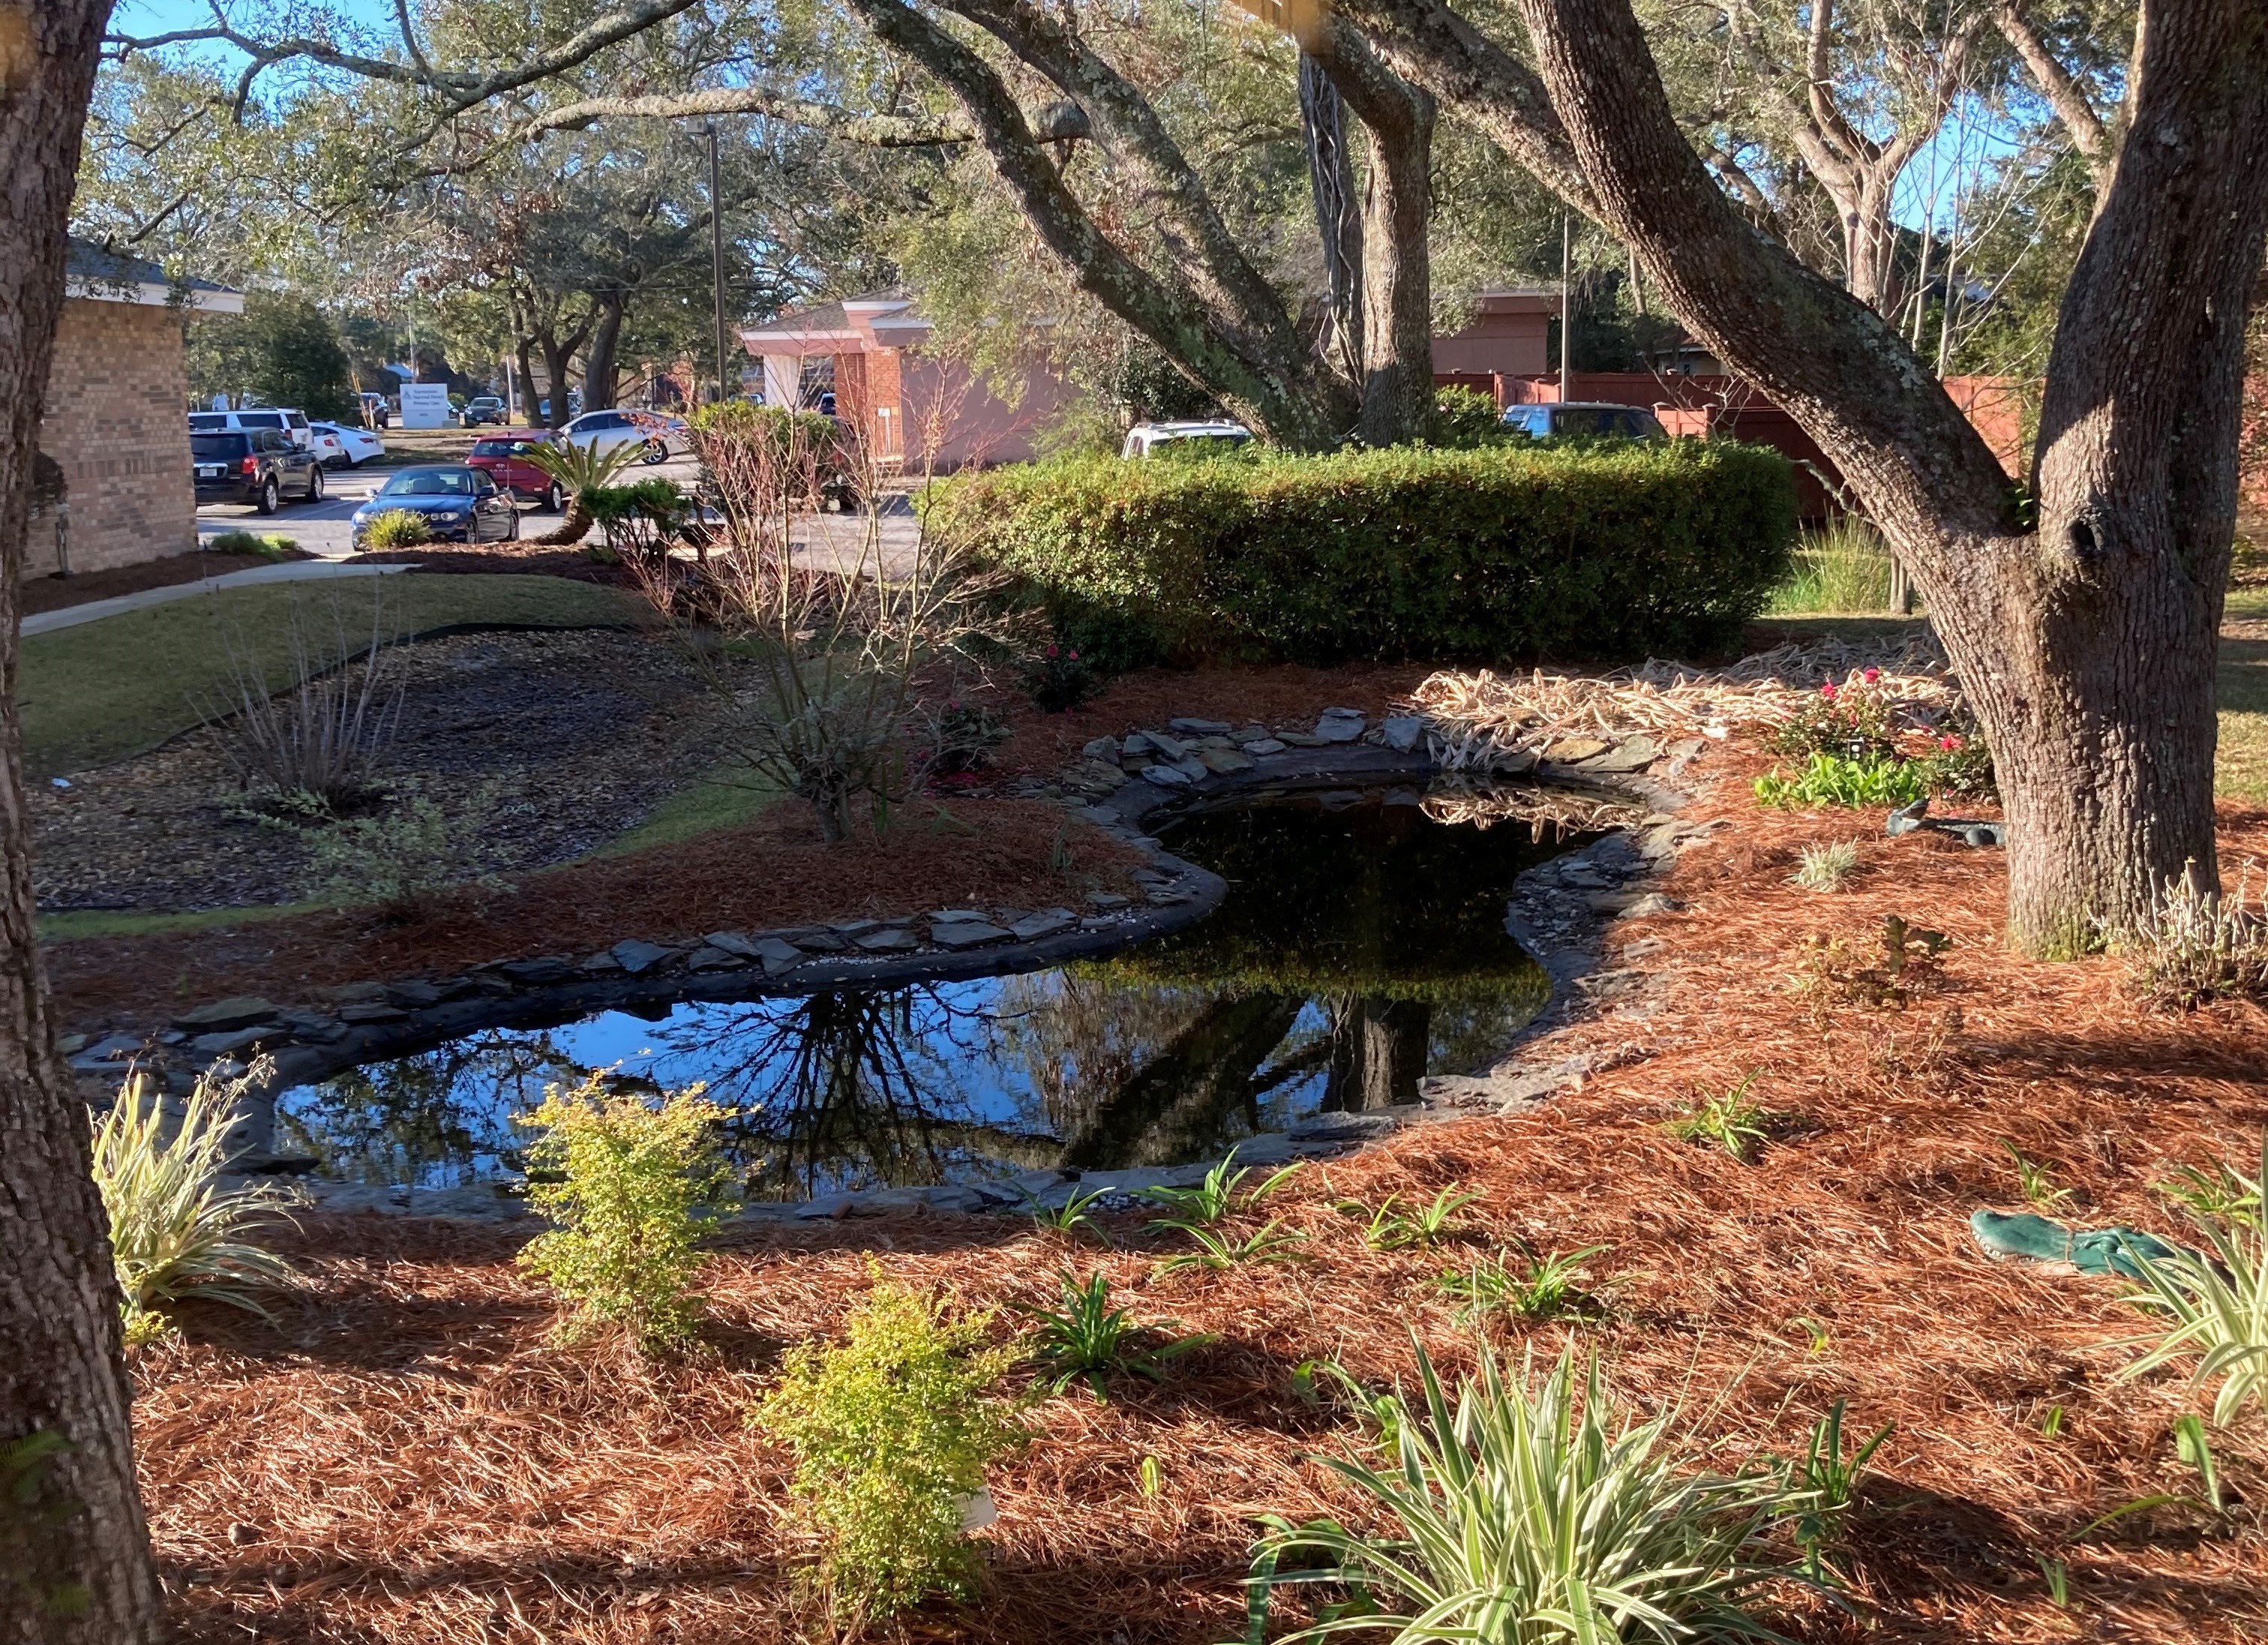
Nature-based stormwater infrastructure projects can play an important role in protecting communities in northwest Florida from the effects of heavy rainfall that occurs periodically in the region. Nature-based stormwater projects are designed primarily to incorporate the natural processes of infiltration that occur in undeveloped areas in the developed landscape, treating stormwater by reducing volumes of surface runoff and concentrations of pollution that could otherwise flow directly into receiving waters. Depending on their design, these features can also provide aesthetic enhancements that can increase the value of properties and the overall wellbeing of the communities where they are implemented. When used in coordination, nature-based projects such as roadside treatment swales, bioretention cells, rain gardens, green roofs, and porous pavement can provide similar levels of stormwater treatment as dry retention basins and detention ponds while also enhancing the aesthetic, recreational, or functional potential of the landscape.
Local government and extension staff across northwest Florida are working to introduce more nature-based stormwater projects into the panhandle landscape. To learn more about recent demonstration projects that have been implemented in our region, visit the WebGIS project https://arcg.is/1SWXTm0.
Rain garden/biofiltration cell at a medical office in Pensacola, Florida.
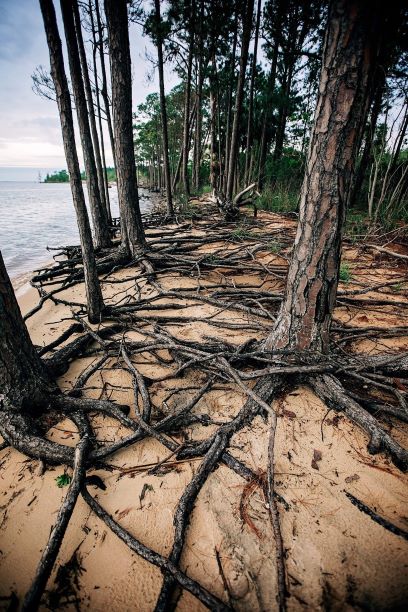
As the name implies, they are haunting—long stretches of standing, dead trees with exposed roots. These “ghost forests” are an unsettling scene in unsettling times for the environment. While coastal erosion is a fact of life—incoming waves, hurricanes, longshore drift of beach sand—the rate of its occurrence is startling lately.
Exposed roots of a ghost forest forming along the Escambia Bay. Photo credit: Deanie Sexton
Global rises in sea level due to increased atmospheric carbon levels mean more saltwater is moving into flat, coastal habitats that once served as a buffer from the open water. Salt is an exceedingly difficult compound for plants to handle, and only a few species have evolved mechanisms for tolerating it. Low-growing salt marshes and thick mangrove stands have always served as “first line of defense” buffers to take in wave action and absorb saltwater. If shorelines have too much wave action for marshes to form, wide stretches of sandy beach and dunes serve the same function, protecting the inland species of shrubs and trees. Many coastal areas are flat and stay at or just above sea level for thousands of yards, or even miles. This means that even a small increase in sea level can send saltwater deep into previously freshwater systems, drowning the marsh and flooding stands of oak and pine. The salt and sulfate in seawater will kill a tree quickly, although it may remain standing, dead, for months or years. Hurricanes and tropical storms exacerbate that damage, scouring out chunks of shoreline and knocking down already-unstable trees.
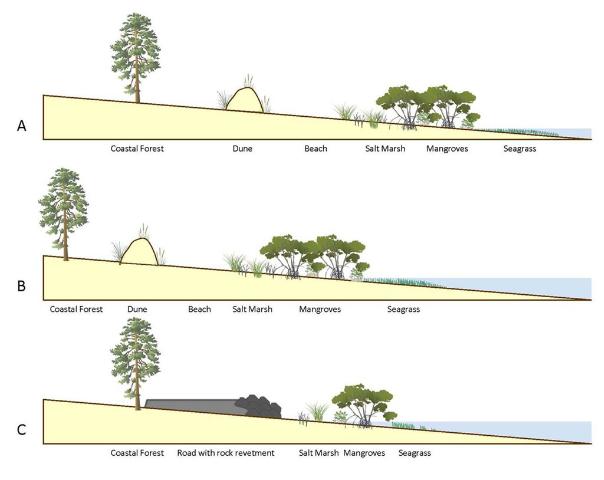
A slow increase in sea level could be tolerated and adapted to as salt marshes move inland and replace non-salt tolerant species. But this process of ecological succession can be interrupted if erosion and increased water levels occur too quickly. And if there is hard infrastructure inland of the marshes (like roads or buildings), the system experiences “coastal squeeze,” winnowing the marsh to a thin, eventually nonexistent ribbon, with no natural protection for that expensive infrastructure.
This diagram outlines the changes in coastal vegetation and shorelines as sea level rises. With “ghost forests,” the sea level moves into that coastal forest section. Figure credit: W. Gray, IAN Image Library
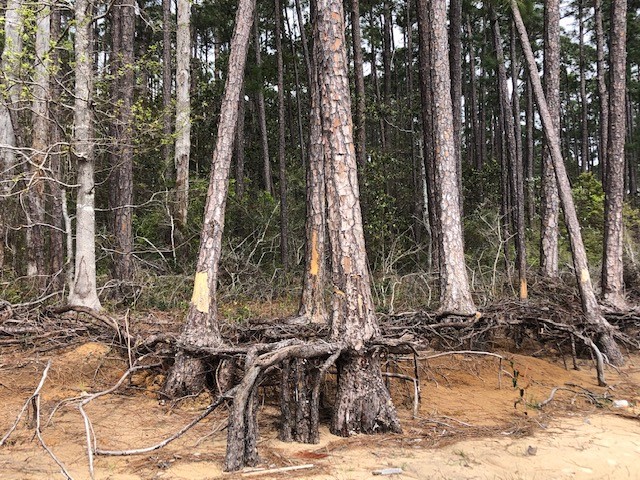
Ghost forests are popping up everywhere. Last year, Popular Mechanics magazine reported on a recently published study that used satellite imagery to document how 11% of a previously healthy forest was converted to standing dead trees along the coast of North Carolina. The trees died within a span of just 35 years (1984-2019). During that time frame, this stretch of coastline also experienced an extended drought and Category 3 Hurricane Irene. These impacts sped up the habitat loss, with over 19,000 hectares converted from forest to marsh and 1100 hectares of marsh vegetation gone, becoming open water.
A ghost forest forming along the shoreline of Blackwater Bay in Santa Rosa County. Photo credit: Carrie Stevenson, UF IFAS Extension
Due to increased coastal flooding and saltwater standing in forested areas, U.S. Fish and Wildlife Service employees are concerned that the historic Harriett Tubman Byway in Maryland—part of the famed underground railroad of the Civil War era—will soon be gone. Over 5,000 acres of tidal marsh have converted to open water in the area and large stands of trees have died. Even locally, trees along Escambia and Blackwater Bay are dying due to salt damage and heavy erosion. Hurricane Sally delivered a knockout punch to many remaining trees along the scenic bluffs of the bay.
Sea level has risen over 10” in the past 100 years in the Pensacola Bay area, and even mid-range Army Corps of Engineers estimates expect 0.6 to 1.4 feet of rise in the area by 2045. There are some actions we can take to mitigate future damage. Building a “living shoreline” of vegetation along a piece of waterfront property instead of using a seawall can help, especially if the vegetation growth outpaces sea level rise. You can also visit the City of Pensacola’s Climate Task Force report to learn more about climate action recommended (and being taken) locally, such as increasing the use of renewable energy and dedicating staff to sustainability measures.
Historically the average rainfall in the Pensacola Bay is around 60 inches per year. However, over the past 10 years that has increased to slightly more than 75 inches per year (see Table 1). The frequency of those levels over the past decade shows that most are between 60 – 80 inches but there have been two years with over 90 inches reported. In the last decade, nine of the 10 years had total rainfall above the historic mean for the area.
Along with the increase in rainfall has come an increase in development. This increase reduces the amount of the excess rainfall to percolate into the ground and recharge our aquifer. Instead, it is directed into stormwater projects to reduce flooding in the community. Some of this stormwater will eventually find its way to the estuary or the tributaries that feed the estuary. The question is whether this increase in freshwater run-off is enough to decrease the salinity of the bay system.
There are several restoration projects ongoing within the bay. Two of them Sea Grant has been involved in. One is monitoring the status of seagrass and the other is status of bay scallops. The species of seagrass in lower bay, such as turtle grass (Thalassia testudnium) and shoal grass (Halodule wrightii) require salinities to be at, or above, 20 parts per thousand. Bay scallops depend on turtle grass for their life cycle and also require the salinity at, or above, 20 ppt.
Citizen volunteers are assisting Florida Sea Grant by monitoring the salinity of the bay on a weekly basis.
Volunteers are trained to use a refractometer and asked to monitor their assigned beach once a week, reporting their results to Sea Grant and calibrating their instrument once a month.
We are asking our volunteers to continue to monitor until they have logged 100 readings.
Currently 21 locations around the bay are being monitored. Nine are in the Big Lagoon area, eight near downtown Pensacola, and four near Pensacola Beach.
12 of these sites are actively being monitored at this time, 3 have reached the 100-reading mark, and 6 have not been monitored in some time.
Note:
Our volunteers are monitoring the water at the surface near the beach due to ease of access. The seagrass and scallops we are interested in grow at the bottom and at depth. However, saline water is more dense than fresh, and it is assumed that the water on the bottom at depth is saltier than the data being found at the surface near the beach.
There are other agencies who are monitoring salinity at depth.
Data for Each Site as of the end of 2022
Table 3 – Salinity Mean, Median, and Mode from Around the Pensacola Bay Area
Water Body
No. of samples logged
Mean
Median
Mode
Bayou Chico
7
10
5
5
Bayou Grande
29
20
21
21
Bayou Texar
10
8
7
ND
Big Lagoon
15
23
20
20
Big Lagoon SP
51
16
15
14
Big Sabine
64
22
22
22
Bruce Beach
1
18
18
ND
Ft. McRee
4
21
21
19
Galvez Landing
65
22
23
22
Hawkshaw
24
16
15
15
Kees Bayou
100
20
21
14
Little Sabine
100
23
23
25
Lower Perdido Bay
100
16
15
20
Navy Point SE
21
17
17
20
Navy Point SW
22
16
17
10
Old River
36
23
23
25
Oriole Beach
51
25
25
25
Perdido Key SP
33
21
20
15
Sanders Beach
70
18
18
18
Siguenza Cove
11
22
21
21
Shoreline Park
10
25
25
25
TOTAL
824
19
19
19
Table 4 – Salinity Mean, Median, and Mode from the Big Lagoon Area
Water Body
No. of samples logged
Mean
Median
Mode
Big Lagoon
15
23
20
20
Big Lagoon SP
51
16
15
14
Ft. McRee
4
21
21
19
Galvez Landing
65
22
23
22
Kees Bayou
100
20
21
14
Lower Perdido Bay
100
16
15
20
Old River
36
23
23
25
Perdido Key SP
33
21
20
15
Siguenza Cove
11
22
21
21
TOTAL
415
20
20
19
Table 5 – Salinity Mean, Median, and Mode for the Downtown Pensacola Area
Water Body
No. of samples logged
Mean
Median
Mode
Bayou Chico
7
10
5
5
Bayou Grande
29
20
21
21
Bayou Texar
10
8
7
ND
Bruce Beach
1
18
18
ND
Hawkshaw
24
16
15
15
Navy Point SE
21
17
17
20
Navy Point SW
22
16
17
10
Sanders Beach
70
18
18
18
TOTAL
184
15
15
15
Table 6 – Salinity Mean, Median, Mode for the Pensacola Beach Area
Water Body
No. of samples logged
Mean
Median
Mode
Big Sabine
64
22
22
22
Little Sabine
100
23
23
25
Oriole Beach
51
25
25
25
Shoreline Park
10
25
25
25
TOTAL
225
24
24
24
Discussion
A glance at Table 3 will show all 21 bodies of water that have been involved in this project. Three of those, Lower Perdido Bay, Kees Bayou, and Little Sabine have reached the 100-reading mark.
For Lower Perdido Bay the mean salinity was 16 ppt ±5. The highest reading was 24 ppt and the lowest was 6 ppt. The median was 15 ppt and the mode was 20. These data suggest that this body of water would not support turtle grass or bay scallops, but it is not believed that historically lower Perdido Bay did. We would like to thank Bob Jackson for his effort on collecting these data.
For Kees Bayou the mean salinity was 20 ppt ±6. The highest reading was 31 ppt and the lowest was 5 ppt. The median was 21 ppt and the mode was 14 ppt. These data suggest that turtle grass and bay scallops could survive here. It is noted that Kees Bayou is a shallow basin located next to a highway and during intense rainfall the salinities could drop drastically to cause a decline of both target species. We would like to thank Marty Goodman for his effort on collecting these data.
For Little Sabine the mean salinity was 23 ppt ±4. The highest reading was 30 ppt and the lowest was 12 ppt. The median was 23 ppt and the mode was 25 ppt. These data also suggest that both turtle grass and scallops could survive in Little Sabine, and there are records that scallops were once there. Turtle grass exist there now. We would like to thank Betsy Walker and Liz Hewson for their efforts on collecting these data.
The Big Lagoon Area
These data suggest that most of the sampled areas could, in fact, support both turtle grass and scallops, and there are records that they have supported both in relatively recent years. One note of interest is the lower salinities near Big Lagoon State Park. Most of the sites have data at 20 ppt or higher – except Lower Perdido Bay (understandable) but we are not sure why the numbers are below 20 ppt. at the state park. We would like to thank our active volunteers in the Big Lagoon area Jessica Bickell, Glenn Conrad, John Williams, and Emogene Johnson for their effort in collecting these data.
The Downtown Pensacola Area
These data suggest that this area of the bay would not support turtle grass nor bay scallops. But historically they did not. Seagrass does exist in these bodies of water but much of it is widgeon grass (Ruppia maritima) which can tolerate lower salinities. We would like to thank our active volunteers for the downtown area Tim Richardson and Glenn Conrad for their efforts in collecting these data.
The Pensacola Beach Area
These data suggest that Santa Rosa Sound could support, and do support, populations of turtle grass and scallops. During our scallop searches conducted in July we have found one live scallop in Big Lagoon and two in Santa Rosa Sound over the last six years. Again, these data suggests that all of these locations could do so with the highest salinities in the bay area based on these data. We would like to thank our active volunteers in the Pensacola Beach area Ann Livingston, Gina and Ingo Hertz, and Holly Forrester for their efforts in collecting these data.
Though we have not reached the targeted 100-readings for most of our sites, these early results suggest the rainfall may not be lowering the salinity. We will continue to monitor until we do reach the 100-reading for each and have a better idea.
We are seeking new volunteers. The water bodies needing help are Bayou Chico, Bayou Texar, Big Lagoon, Bruce Beach, and Sanders Beach. If you are interested contact me at roc1@ufl.edu
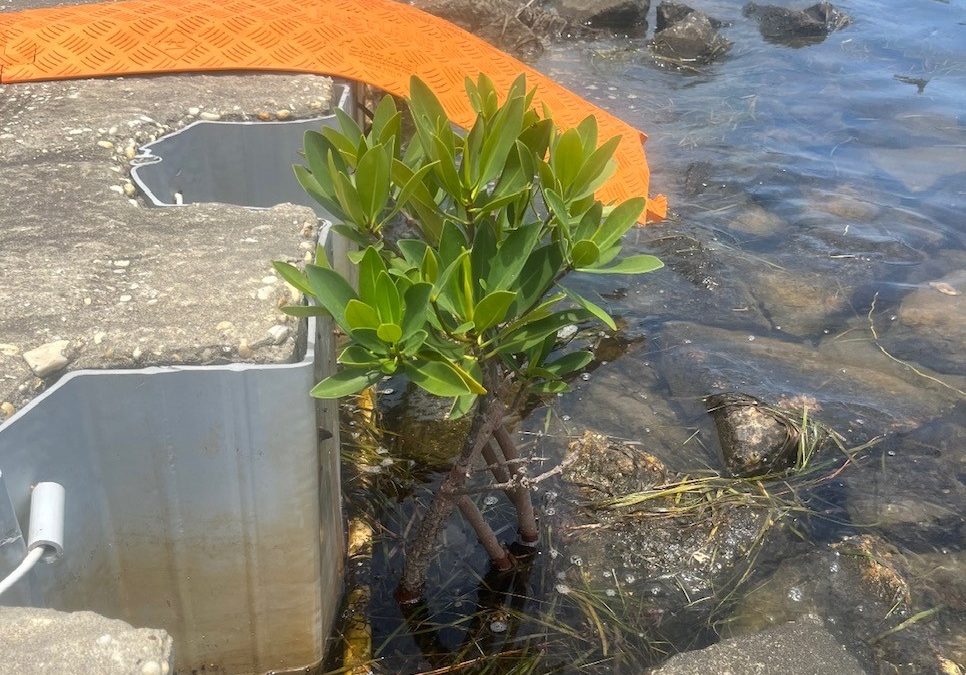
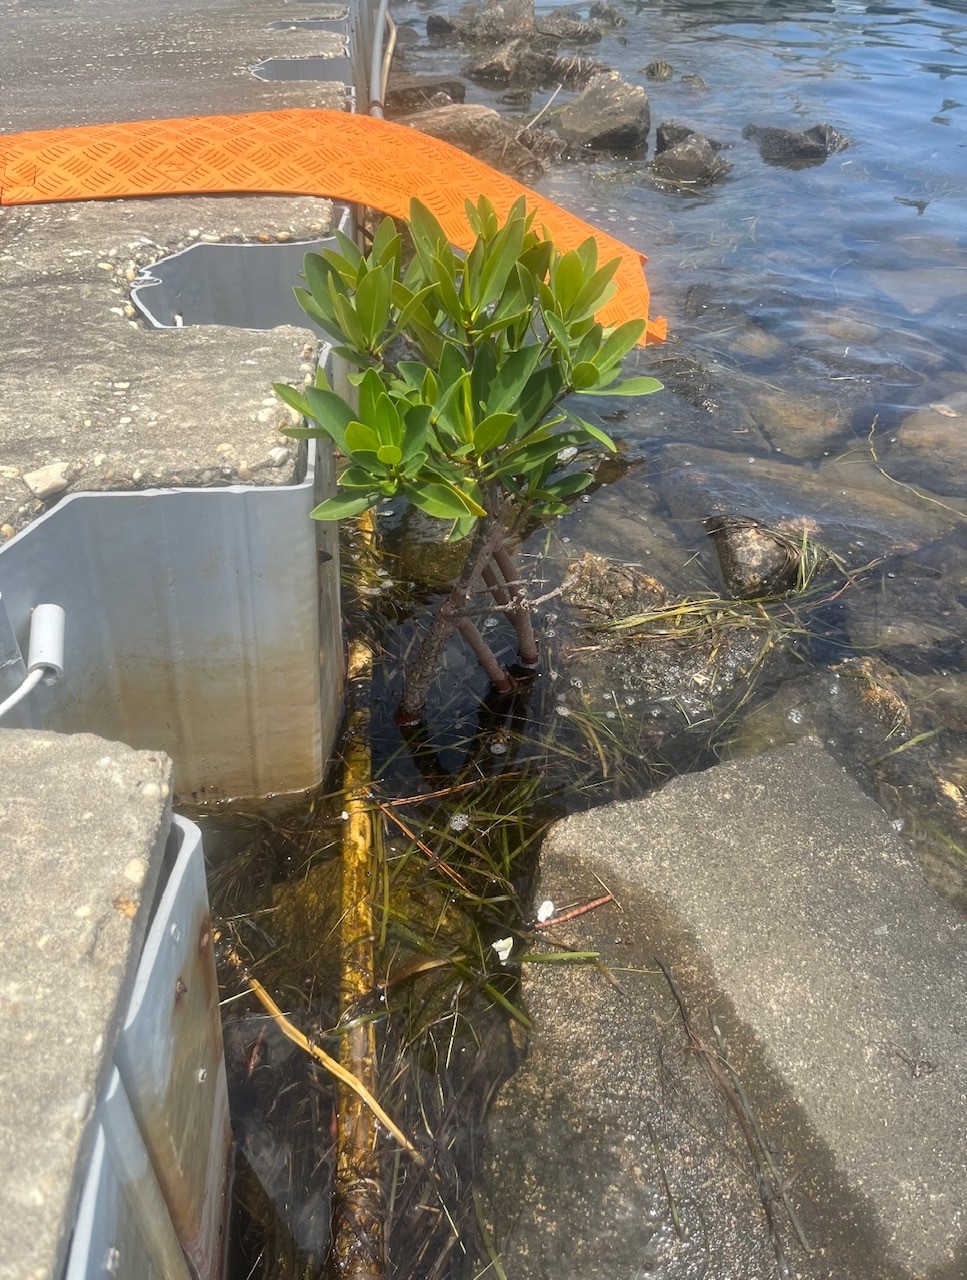
Mangroves in the northern Gulf of Mexico are a relatively new thing for most coastal counties. Some residents are aware they are arriving and are not concerned. Some are aware and are actually excited about it. Some are aware and are concerned. Some are not aware. And others have no idea what a mangrove is. Let’s start with that group.
Black mangroves growing near St. George Island in Franklin County. Photo: Joshua Hodson.
Mangroves are salt tolerant trees that are found all around the globe within the tropics. They grow along the shorelines in areas where they are protected from ocean wind and waves – they like estuaries. There are several species and their location along the shore depends on how long they can be submerged in water. There is a definite zonation of these trees.
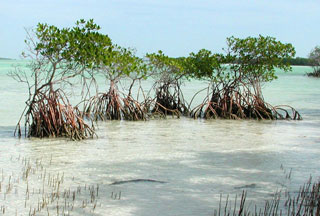
The red mangrove with their distinct prop roots. Photo: University of Florida
The red mangrove (Rhizophora mangle) is found closest to the waters edge. They can be identified by their prop roots which are designed to keep it standing when the water is moving and shifting the sediment below it. These prop roots also useful during tropical storms when the wave energy increases. The have distinct looking propagules, which are elongated floating seeds which allows the plant to disperse their offspring using the currents and tides. The propagules often wash ashore on northern Gulf beaches but usually in locations not conducive to growth, or they do not survive the winters. These plants can tolerate temperatures in the 30sF for a night or two, but when it drops into the 20sF, and certainly into the 10sF, they will not survive. Despite not being cold tolerant, they have been found growing in the northern Gulf of Mexico. All the mangroves found in the Pensacola area have been of this species.
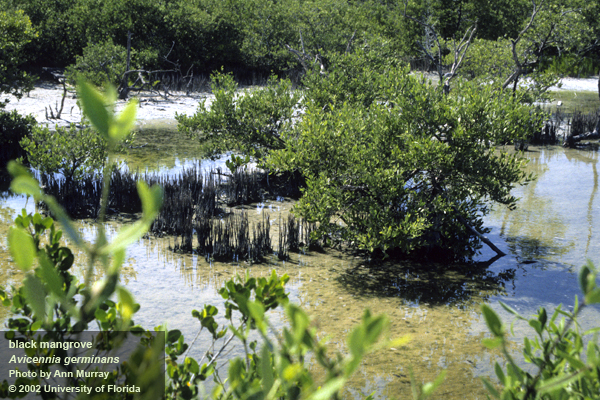
Black mangroves with their pneumatophores. Photo: University of Florida
The black mangrove (Avicennia germinans) is found higher in the intertidal zone. It lacks the prop roots of the red but rather has what are called pneumatophores, which resemble the knees of the cypress trees. These pneumatophores have structures that help increase the oxygen uptake for the plant, being that the sediments they live in are quite hypoxic. The seeds of the black mangrove are not elongated but rather resemble a bean. These trees are more tolerant of cold weather than the red mangrove and it is they that have led the march north. There are large stands of these trees in the Apalachicola area as well as barrier islands in Mississippi, Louisiana, and Texas. We have not found a black mangrove growing in Pensacola as of yet.
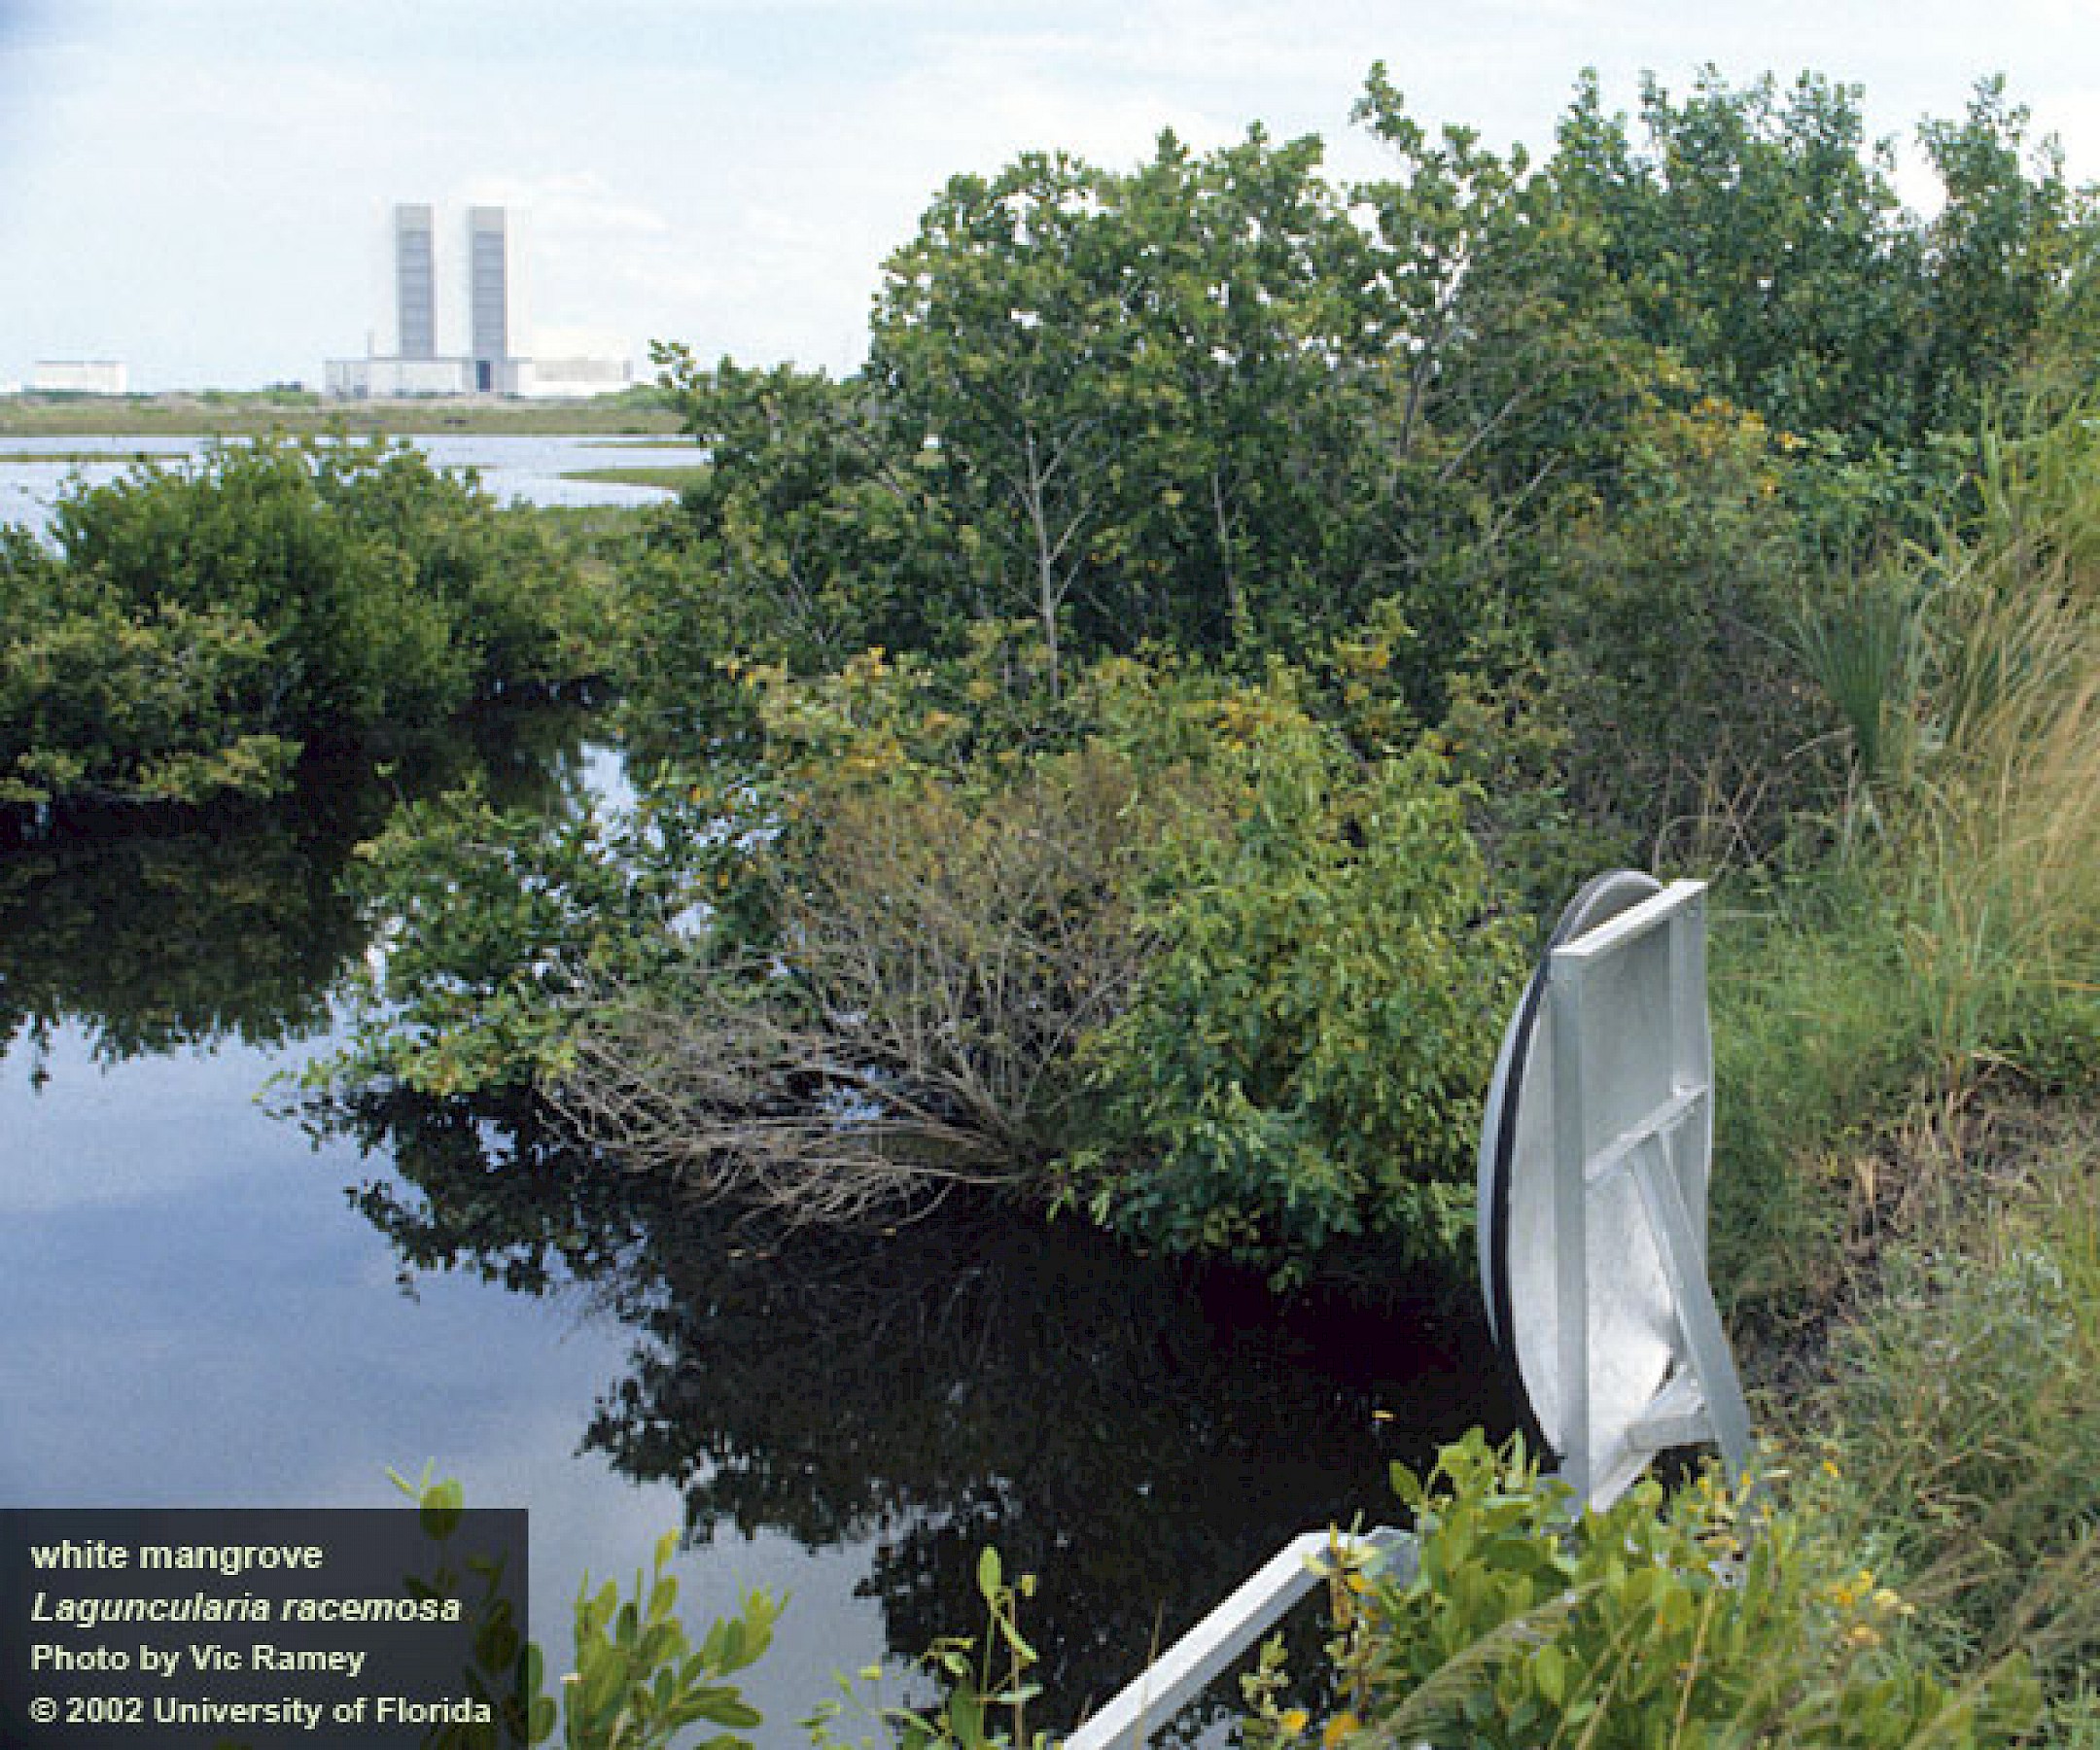
The larger white mangrove. Photo: University of Florida
White mangroves (Laguncularia racemosa) grow more inland than the other two. This species can grow into a large tree (up to 40 feet). Their leaves can excrete salt allowing them to live in saltier conditions. There are no records of this tree in the northern Gulf of Mexico to my knowledge.
Why would anyone be concerned about mangroves dispersing into the northern Gulf?
Those who are concerned are aware that is a shoreline tree that will grow and possibly block their view of the water. They also are aware that this tree is protected by the state, and they are not allowed to remove or trim the tree without a permit. In south Florida trimming mangroves is allowed in some counties during certain times of the year and only by certified arborist. Those concerned are not excited about potentially loosing their water view.
A red mangrove growing near the pass of Pensacola Bay. Photo: Whitney Scheffel.
Why would anyone be excited about mangroves dispersing into the northern Gulf?
Folks who are excited about the possible coming of the mangroves are so because they have spent time snorkeling and fishing in and around them in more southern locations. The prop roots of the red mangrove create an underwater wonderland of marine life. Small fish, crabs, anemones, starfish, mollusk and more find the large openings formed by the roots as great habitat. These in turn attract larger fish like snook, tarpon, rays, and flounder. Many species of larger fish are popular targets for anglers. Manatees are often found in mangrove swamps grazing on the algae and seagrasses growing nearby and enjoying the relatively calm water. Those who have experienced this in south Florida are excited they may have it here in the north.
How many mangroves, and which species, have dispersed into the northern Gulf is still being studied. Florida Sea Grant has partnered with Mississippi-Alabama Sea Grant and three of the National Estuarine Research Preserves to survey for mangroves in our panhandle counties and along coastal Mississippi and Alabama. Ten transects have identified in each that are surveyed once a year by volunteers using paddle craft. The presence of a mangrove is documented, measured, photographed and shared with the team, which is overseen by Whitney Scheffel of the Pensacola-Perdido Bay Estuary Program. If you are interested in participating in a survey, contact your county Sea Grant Extension Agent.
In this series we have looked at where the concept of climate change came from and how climate has changed over the centuries. We looked closer at the changes over the last decade and what the most recent IPCC report is telling us. We also looked at how changes have impacted Florida and the panhandle specifically. Much of the news is concerning to many and the outlook for the rest of the century paints a picture of climate problems we will have to deal with. But hope is not lost. Based on the 2021 AR6 report, even if we stop all greenhouse gas emissions today, the sea will rise – we have missed that tipping point and will have to plan for that. But there are other areas where our communities can make changes to help turn this thing around. In Part 5 we will look at potential solutions and specifically focus on where individuals like you and I can make changes that can help.
Photo: Molly O’Connor
Where do you start?
As G.T. Miller states in his book Living in the Environment1it is going to be tough. It is a global problem and will take many nations to agree to make things happen. We know how hard that can be. It is also a political problem, and we know that can be hard as well. It is also affecting some regions of the planet more than others and thus some will be more concerned and ready to act, while others do not see the need to spend resources on the issue. Miller states there are two basic plans of attack on this – (1) reduce greenhouse gas emissions, or (2) try and mitigate the impacts.
During the 1970s Dr. William Rathje developed a program at the University of Arizona called Garbology. One of the objectives of the program was to determine what humans throw away in order to determine what the “big players” were in reducing solid waste going to the landfill1. They were able to develop a pie chart showing what items made up the material we call garbage and then developed a plan to reduce those “big players”. Let’s take the same approach with reducing greenhouse gases. What are the sources of these gases? Who are the “big players” so that we know where to direct our efforts to significantly reduce emissions and curtail some of the possible problems predicted by the models?
According to a 2021 EPA report, carbon dioxide (CO2) makes up 76% of the global greenhouse gas emissions2. This would be an obvious gas to target significant reductions. 86% of the carbon dioxide comes from the burning of fossil fuels, a more specific target for reduction and a good starting point.
Percentage of Greenhouse Gas Emissions
Gas
Source
65%
Carbon dioxide (CO2)
Fossil Fuels
16%
Methane (CH4)
Waste, Biomass energy
11%
Carbon dioxide (CO2)
Deforestation, Agriculture, and Soil degradation
6%
Nitrous oxide (N2O)
Fertilizer use
2%
Fluorinated gases
Industrial processing, Refrigerators, and some consumer products
Source: U.S. Environmental Protection Agency
So, where are fossil fuels being burned?
Where can we begin to discuss reductions there?
The same US EPA report breaks down the economic sectors where greenhouse gases are being produced on a global scale. A second report focuses on those same sectors but from the United States3. The table below compares these two.
Global Economic Sector
Percent
U.S. Economic Sector
Percent
Electricity and Heat Production
25%
Transportation
29%
Agriculture and Forestry activities
24%
Electricity and Heat Production
25%
Industry
21%
Industry
23%
Transportation
14%
Commercial and Residential use
13%
Other Energy Sources
10%
Land Use and Forestry activities
12%1
Agriculture
10%
Source: U.S. Environmental Protection Agency
noted that total my not round to 100% due to independent rounding
Comparing the greenhouse gas emissions of U.S. economic sectors to those of the world shows a few things.
Electricity and heat production is a major producer of GHG and a good target for reduction.
Transportation is a larger problem in the U.S., in fact it is the number one problem.
Agriculture and forestry are larger problems on the global scale, less of one in the U.S.
Commercial and residential use is a larger problem than agriculture and forestry in the U.S., it was not even reported on a global scale.
Now we know who the “big players” are. Can we do anything about these?
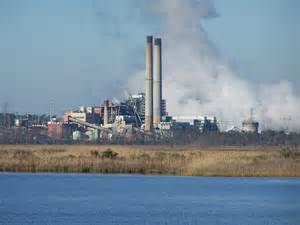
Reducing emissions from electricity and heat production will have to come from our leaders. At the time of this writing, the United Nations Climate Summit is going in Scotland and much discussion about this is going on. China, Russia, and India are all concerned about reducing GHG from coal powered plants. This is understandable being that this is the major source of energy for those nations. However, the negative impact of burning coal on the climate is serious and cannot be ignored if the world is serious about reducing, or eliminating, the long-term impacts of climate change. So, the move away from coal is a good start.
Power plant on one of the panhandle estuaries. Photo: Flickr
The EPA reported in 2019 that United States has seen a decrease in greenhouse gas emissions primarily due to a decrease in energy use and the decrease in the use of coal – showing it can be done3. The United States is discussing reducing the use of coal even further, but not all in congress support this – primarily those who represent states where coal mining is a large industry. But again, the negative impacts of burning coal are there and, if the world wants to “turn this thing around”, we will need to consider doing this. Again, there is little the citizen can do to make these changes other than selecting leaders who are willing to. It is in their hands.
The transportation issue is different… we can make a difference here.
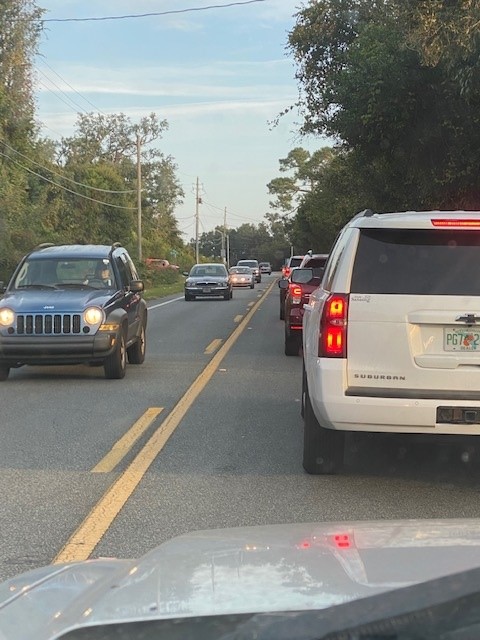
In the U.S. transportation produces 29% of the greenhouse gas emissions, #1. It is only 14% of the problem worldwide. Americans love their cars. We drive everywhere. Most Americans live at least 25 miles from where they work, many live much further, some actually live in a different state. Being work, most of these drivers are traveling alone, carpooling is not a common practice, and mass transit is not available in many communities. So, we sit in traffic jams every morning and evening trying to get to the places we want, and need, and complain of the congestion, wishing the local government could improve traffic flow. One of the reasons we have this problem, and other parts of the world do not, is how we design our cities.
Heavy traffic is common place in the U.S. with our dependence on cars. Photo: Rick O’Connor
Some city planners argue the best way to reduce the transportation issue is by compact development. This is a plan that would have residents live within walking or biking distance of everything they need – home, work, stores, etc. Our ancestors lived this way primarily because they had to, they did not have cars. The wealthy, who had horse and carriage, could live outside of town and ride in when they wanted.
This desire to live outside of the city in more open space could be used in another form of urban development that could still reduce the transportation problem – satellite development. In this method, residents would live in suburb areas that were connected to the urban workplace by mass transit. Imagine living in a suburb where you went to the rail station, climbed on, and traveled over greenspaces (supporting forest and pasture lands) to the urban work area. There are many cities in the U.S. who have this type of system in place, but few travel over greenspaces – they mostly travel over other suburban developments.
However, this would generate crowds at the terminal and the stress that comes with it. It would make it harder to “stop by the store” on the way home – though the stores would be within walking distance in the residential “satellite” area. Walt Disney promoted this idea when he was planning Epcot and used the monorail as an example of how it could be done.
But we love our cars… so, another plan would be what is called corridor development. Here, people would live in the residential satellite suburbs but rather than mass transit into the city, there would be a “freeway” for cars to use. Freeway in this sense meaning nothing but highway… no traffic lights, no stores, nothing the impede traffic until you get there. Think in terms of our interstate system. There are many examples of this design around the country. Even here close to home, highway 98 was diverted around Destin to avoid traffic jams. The idea was there would be a clear road around if you were traveling through. But as we will see, in most cases, this did not work.
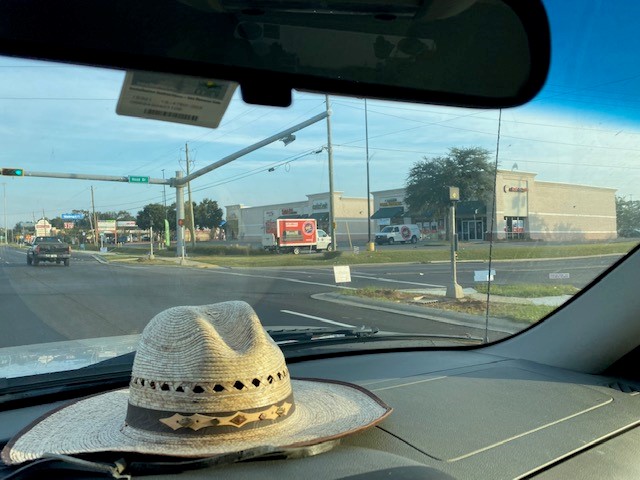
Heavy urban development “sprawls” away from the city in many U.S. communities. The “corridor” to work has become congested. Photo: Rick O’Connor
In most cases we plan a corridor design but along the “freeway” route we build new residential developments – they want stores closer and so strip malls and other commercial developments spring up – these residents and businesses need access to the “freeway”, so traffic lights go up and now the city has basically moved away from the central hub into the suburbs forming what we call a megalopolis. I bet this scenario sounds very familiar. It is happening everywhere – even here in the Pensacola area.
Urban sprawl is a big problem and only makes the transportation issue a larger one. G.T. Miller Jr. mentions that urban sprawl is occurring because
There is affordable land to do so
We have automobiles so we can function in the design
Gasoline is cheap
And we do not plan our cities well
So, we live in a car dominated society – traveling everywhere – usually alone.
Can we do anything about this?
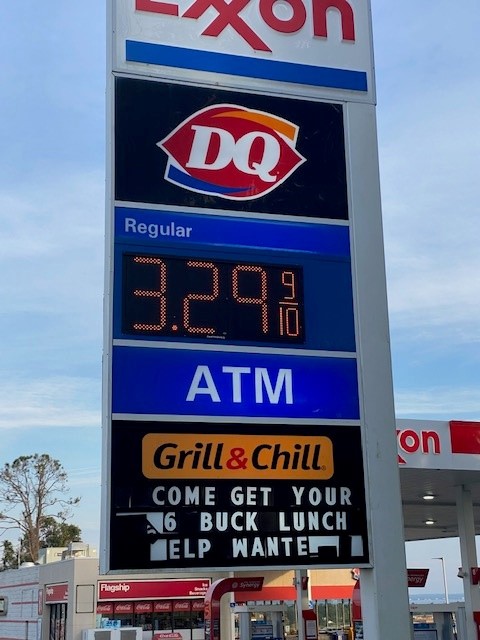
Many scientists and economists believe the only way to reduce the transportation problem is to make it expensive to use. It is believed that making gasoline more expensive would force many to change their driving habits. Currently gas prices are moving towards $4.00 / gallon. We have seen this before and the driving practices did not change much. Some economists believe you will not see such changes until gas reaches $5.00 or $6.00 / gallon – a price many other developed nations routinely spend. It will be interesting to see.
How high will gas prices have to go before U.S. transportation behaviors change? Photo: Rick O’Connor
Another idea on the cost side is a gasoline tax to cover the estimated harmful costs of driving. The funds from such taxes could be used to develop mass transit systems, bike lanes, and sidewalks. This is occurring in other parts of the world but would probably not work in the United States. Miller gives three reasons why it would be a hard sell in the United States.
There would be opposition to any tax.
Fast, efficient, reliable, and affordable mass transit systems and bike lanes are not widely available in most U.S. communities
The way our communities are designed… we need cars
Other suggested financial methods would include raising parking fees within the city, and more toll roads.
But while we wait and see where gas prices will go and when people will make changes in their driving habits, is there anything else we could do?
Yes…
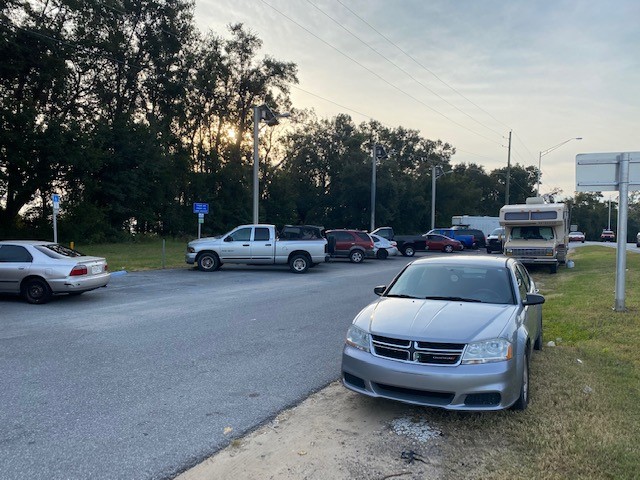
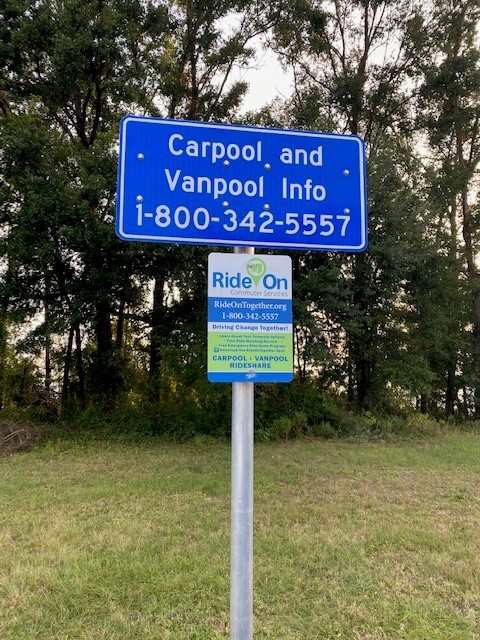
Carpooling has been suggested since the 1970s. It does occur but has not caught on as many had hoped. Within our community here in Pensacola there are several “park and ride” parking lots and there usually cars in them.
This carpool parking lot near Pensacola is completely full. Indicating more use of this service. Photo: Rick O’Connor
Carpooling is one method to reduce fuel use and GHG emissions. Photo: Rick O’Connor
There has been an increase interest in hybrid and electric cars in recent years. One concern for electric was the ability to pull heavy loads, something Americans will require. In just the past year one major auto maker began promoting an all-electric truck they assure has the pulling power of a similar size gas powered truck. One colleague of mine recently bought an all-electric jeep which he assured me has plenty of power to pull. More electric charge stations are appearing in local communities, and it seems this is an option for many.
It was also noted in the EPA report that changing our driving habits (i.e., fast starts, incorrect tire pressure, etc.) does make a difference. I know we have all seen the driver who is speeding – darting in and out of traffic only to be at the same stop light with all others in the end. So, changing HOW we drive can help as well.
As mentioned, agriculture and forestry are not as big of an issue in the U.S. as it is on a global scale. There are numerous BMPs farmers can use to reduce their carbon footprint and restore the natural carbon-sequestration. Most not only help with reducing GHG but save the farmers money. There are financial incentives for them to participate in these BMP programs – and so many farmers are using these BMPs. But none-the-less there are things we can still do in this area.
Support local farmers who are participating in BMP programs by purchasing their products where/when you can. On a global scale the negative impacts of agriculture are increasing. You may have to do a little homework to see where our farmers are selling their products, but it is good to support their efforts.
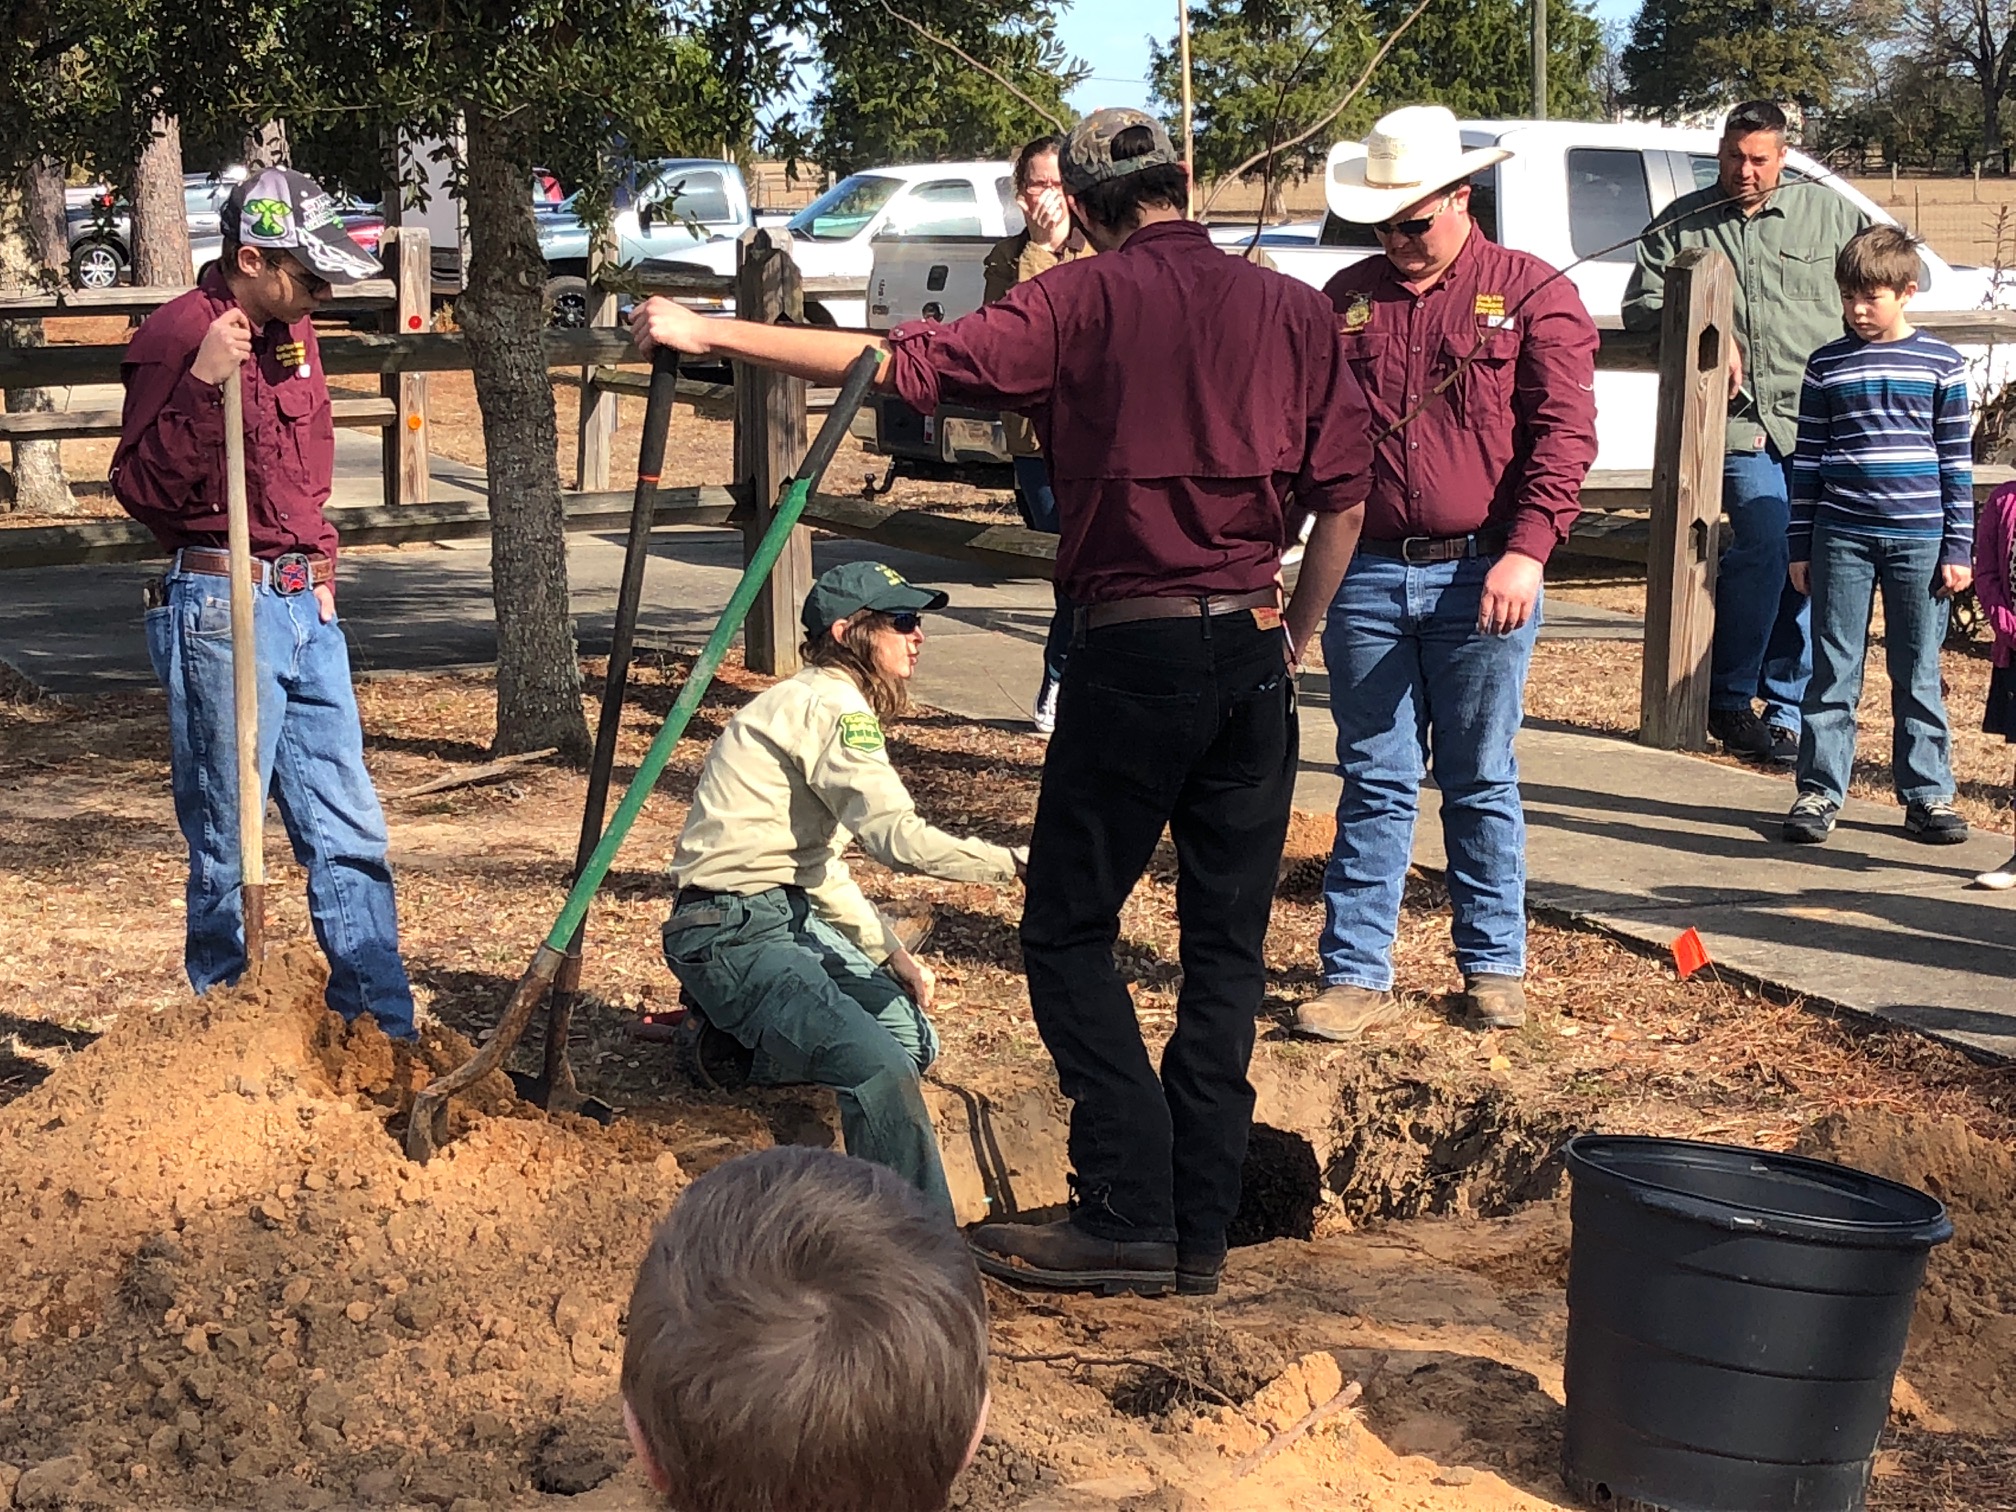
Plant a tree… though our forestry industry is making improvements, many communities are clearing land to expand development. Many of these developments are clearing ALL of the trees and putting few back afterwards. Planting a tree not only helps sequester carbon it has been found that shade from trees can lower internal house temperatures up to 10°F, saving heating and cooling costs as well as the energy needed for these1.
Author and county forester Cathy Hardin demonstrates proper tree planting at a past Arbor Day program. Photo credit: Carrie Stevenson, UF IFAS Extension
And then there is commercial and residential energy use. Something that did not even make it on a global scale.
How can we reduce energy use at home and at work?
There are plenty of ways and we need to consider them. According to the EPA report, energy use in the residential and commercial sector is increasing, not decreasing3.
Let’s begin with smart buildings…
Our home was struck by lighting in 2013 and we rebuilt using as many energy efficient methods as we could. Spray foam insultation, better windows, energy efficient appliances, LED lighting, metal roof, and setting the thermostat smarter have all worked well for us. We are typically billed less than $200 per month for our electricity – and there is more we can do. Your local utility company, and your county extension office, can give you numerous tips on how you can save energy in your home or office.
The 2019 EPA report suggests that greenhouse gas emissions are increasing in the areas of transportation, residential and commercial use, and some agriculture practices. But they are decreasing in energy production, industrial processing, and forestry activities. So, we know we can do this. We just need to step up and do it.
References
1 Miller Jr., G.T., S.E. Spoolman. 2011. Living in the Environment; Concepts, Connections, and Solutions. 17th edition. Brooks and Cole Publishing. Belmont CA. pp. 674.
2 Sources of Greenhouse Emissions. 2021. Global Greenhouse Gas Emissions Data. United States Environmental Protection Agency.